This is a test post as a starter for my blog. I hope you find this and later posts interesting.
Iceland, home to Eyjafjalljökull and Grimsvötn, whose eruptions in 2010 and 2011, resp., disrupted European airspace, is recommended as a great place to study volcanology, with many types of volcanic activity and relatively easily accessible. It is also a great holiday destination, not that I have been privileged enough to visit.
Iceland, located between 67.2°N 23.0°W and 63.0°N 13.0°W, has an area of 103,000 km2 and a population of 364,000. Lying on both the North American Plate and the Eurasian Plate, it is the only large surface expression of the MAR where its volcanic activity can be easily studied by field volcanologists. Iceland, itself, was formed from magma and accretion.
The Mid Atlantic Ridge in the northern hemisphere is the boundary the North American Plate and the Eurasian Plates. As the plates separate, the ridge widens and allows rising magma to come to the surface. The magma rises under its own buoyancy; hotter magma is less dense than the colder surrounding rock.
In addition to the MAR, the Icelandic Hotspot, a mantle plume, contributes to both plate separation and volcanic activity. The Iceland Plateau, itself, is a large basaltic igneous province. The plume head is thought to be located in the region of the Vatnajökull icecap.
The MAR crosses Iceland in a series of transform and extensional faults, starting at the Reykjanes Peninsula in the south west to the Tjörnes Fracture Zone in the north. Plotting the earthquakes reported by the Icelandic Meteorological Office (IMO) from January 2016 to 12 April 2020 shows the path of the MAR.
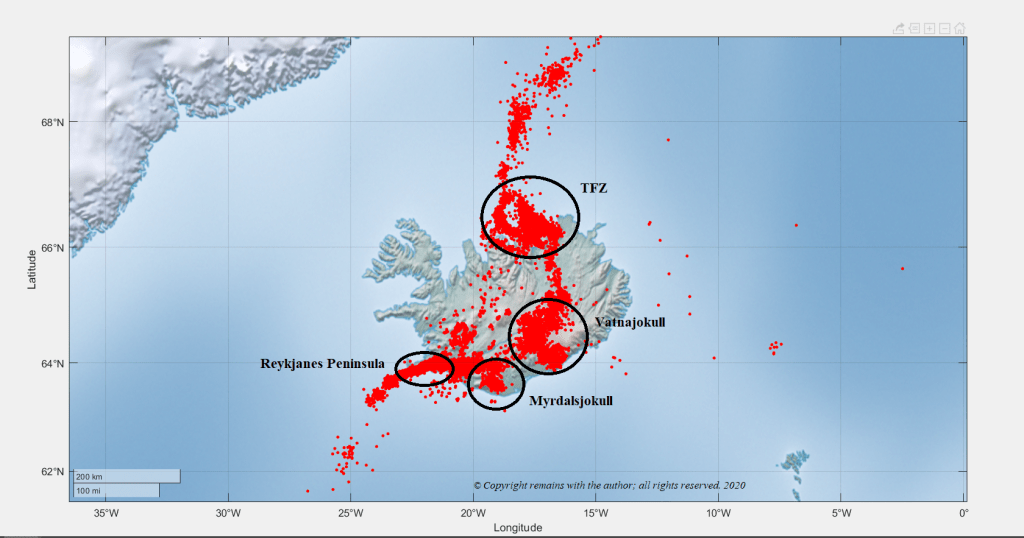
If we take a look at a three-dimensional plot of the same earthquake looking from the south, we can see that there are deeper earthquakes under the volcanic regions Myrdalsjökull and Vatnajökull.

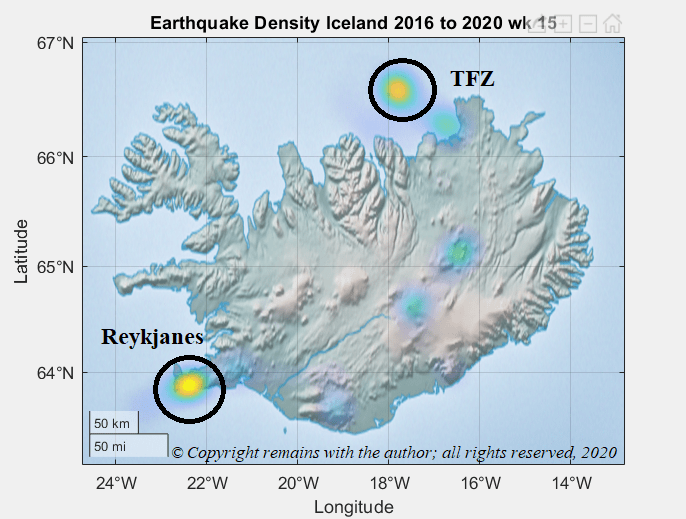
A geodensity plot of the same earthquakes, weighted by magnitude, shows most activity (yellow areas) at the western end of the Reykjanes Peninsula and on the Tjörnes Fracture Zone to the north. Other areas of interest are Myrdalsjökull (Katla), Vatnajökull (Barðabunga) and Herðubreið.
Iceland is often touted as having every form of volcanism going but it does not have an obvious active subduction zone; eruptions tend to be associated with fissures. Not to worry, Iceland has many active volcanoes, including: Askja, Bárðabunga, Eyjafjalljökull, Katla, Grimsvötn, Hekla and Surtsey – plenty to offer us in terms of volcanic and seismic activity.
Our plot is data-heavy (in the region of 104,000 earthquakes) so we cannot see much more without further analysis. We will look at each volcanic region in turn in later posts.
Thank you for reading this and I look forward to sharing the next post with you.
The Armchair Volcanologist
© Copyright remains with the author; all rights reserved, 2020
Sources:
All plots are the author’s own work.
Raw earthquake data: Icelandic Meteorological Office, IMO: https://en.vedur.is/
Software used for 3D and geoplots: MatLab

Great introduction. Look forward to more posts 🙂