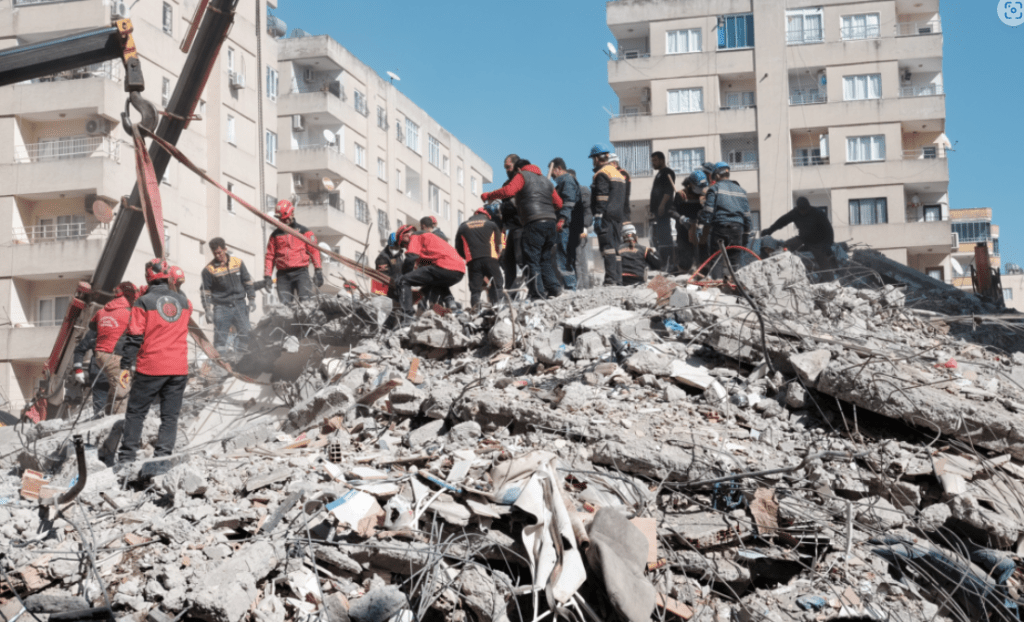
Fig 1: Rescue workers in in Osmaniye, Turkey. Cropped from image by Onur Erdoğan, Public Domain, Wiki Commons
It’s approximately one month on from 6th February 2023 when a 7.8 magnitude earthquake struck on the south western end of the East Anatolian Fault Zone at 01:18 UTC (04:18 local time) 32.4km west northwest of the town of Gaziantep. This, followed by large aftershocks, including a very shallow 7.5 magnitude earthquake to the north of the first quake, caused catastrophic damage in central and southern Turkey, and northern and western Syria. The 7.5 earthquake signalled the rupturing of a second fault zone, the Sürgü-Misis Fault. The final fatality number is not yet available but, at the time of writing, fatalities exceeded 50,000, with hundreds of thousands injured and millions displaced. Our thoughts are with the victims, including those facing a long road to recovery.
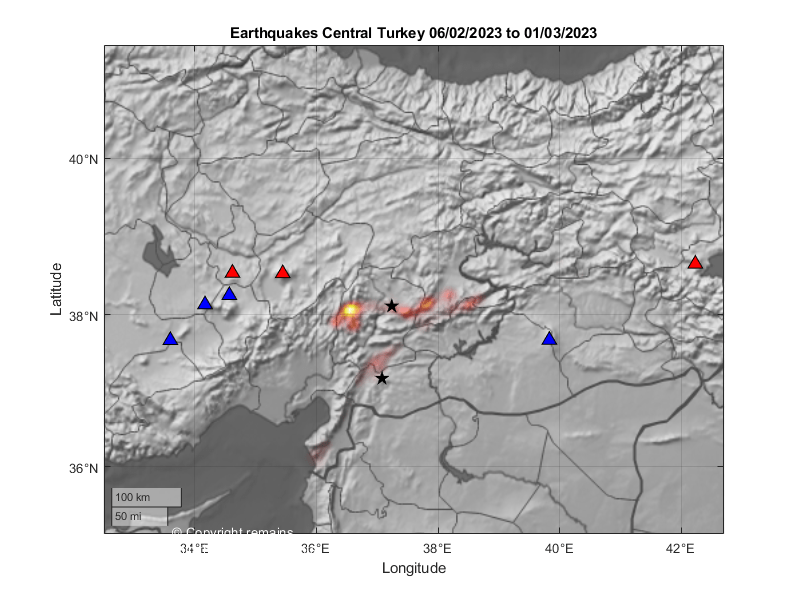
We have taken a look at the earthquakes surrounding the Anatolian Plate from the start of January 2023 to 1st March 2023.
Tectonic Settings
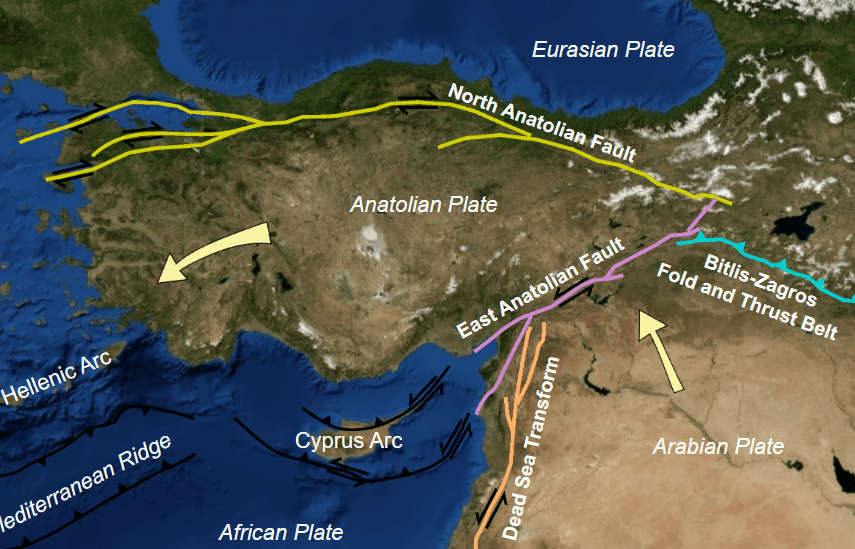
The Anatolian Plate lies between the Eurasian Plate, Arabian Plate and African Plate. The African Plate is moving at a rate of 2.15cm per year in a north easterly direction, the Eurasian Plate is moving south, relative to the African Plate, at a rate of 7-14mm per year, the Arabian Plate is moving northward at a rate of 15-20mm per year and the Anatolian Plate is moving south west at the rate of 21mm per year. The relative motions are accommodated by the North Anatolian Fault, East Anatolian Fault, Bitlis – Zagros Fold and Thrust Belt and Dead Sea Transform Fault System.
Fig 2: Image by Roxy – Own work, CC BY-SA 3.0, Wiki Commons
The East Anatolian Fault is a 500km long fault zone which marks the plate boundary between the Anatolian and Arabian Plates; the boundary is a transform one with left lateral strike slip seismic activity and a slip rate of 10mm per year. The Anatolian Plate is pushed westward by the Arabian Plate moving northwards towards the Eurasian Plate.
The East Anatolian Fault is a single fault between Karliova and Çelikhan. After Çelikhan the fault zone splits into north and south strand, both of which include multiple faults. The Sürgü-Misis Fault makes up the northern strand; it is a 380km long stretching between Çelikhan and Karataş; the eastern parts of the east-west section are made up of the Çardak and Sürgü faults; the sytem changes direction at the Göksun bend dividing into seven north east trending fault systems – the Karataş, Yumurtalık, Toprakkale, Savrun, Misis, Çokak and Düziçi-İskenderun faults. The Sürgü-Misis Fault system connects to the Cyprus Arc via the Misis-Kyrenia fault system. The southern strand of the East Anatolian Fault is less certain; the East Anatolian Fault may extend to the north of Cyprus; and, the NNE trending Türkoğlu-Amik section (the Karasu Fault Zone) may be a separate fault, linking the Dead Sea Transform to the East Anatolian Fault. The Karasu Rift has had Quaternary volcanic activity on northern part and sides of the rift between Kirikhan, Reyhanli and Fevzipaşa in an area 94km long and 12-25km wide.
The North Anatolian Fault, another strike slip fault, accommodates the relative motion between the Anatolian Plate and the Eurasian Plate. The North Anatolian Fault and the East Anatolian Fault meet the Bitlis – Zagros Fold and Thrust Belt, where the Arabian Plate subducts under the Eurasian Plate, at the Karliova Triple Junction.
Not very far to the west, the African Plate is subducting under the Anatolian Plate at the Cyrpus Arc. The Dead Sea Transform Fault System to the south marks the transform boundary between the Arabian and African Plates. The East Anatolian Fault meets the Dead Sea Transform Fault System at the Maras Triple Junction.
Earthquake Plots
We initially plotted the earthquakes from 1 January 2023 to 25 February 2023 for the area 34.47361°N, 25.22222°E to 42.25833°N, 44.45056°E. We then looked at 35.3122°N, 32.50944°E to 41.21667°N, 42.70056°E, focussing on the East Anatolian Fault. The results are shown in the following videos and earthquake density plot.
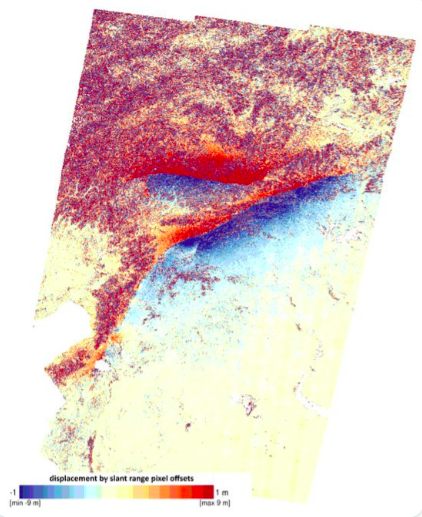
Fig 7: Surface rupture from the two earthquakes as shown by analysing before and after satellite images. The first rupture on the East Anatolian Fault was 190km long and the second on the Sürgü-Misis Fault was 38km long (Image credit: Copernicus/NERC/COMET)
Most of the faults within the East Anatolian Fault Zone seem to have moved in the period we looked at. However, the scale of our plots may be misleading. Our plots do show a tenuous link between the East Anatolian Fault and the Cyprus Arc. There was some activity on the Arc preceding the 7.8 earthquake. After shocks have migrated through the fault system towards the Arc. There is no obvious link with the Dead Sea Transform Fault in the time period selected but geologically-speaking that is a very short period.
“Paleoseismology of the western Sürgü–Misis fault system: East Anatolian Fault, Turkey”, Tamer Y. Duman, Hasan Elmacı, Selim Özalp, Akın Kürçer, Meryem Kara, Ersin Özdemir, Ayhan Yavuzoğlu & Çağıl Uygun Güldoğan, Mediterranean Geoscience Reviews volume 2, pages411–437 (2020) https://link.springer.com/article/10.1007/s42990-020-00041-6
The earthquake swarm is continuing on São Jorge as we write, albeit it at a much lower intensity. The swarm is located on the Manadas Fissure system. INVOLCAN has sent a team to assist the local scientists (CIVISA and IVAR). CIVISA advised on 6 April 2022 that volcano-tectonic earthquakes had been detected suggesting magma movement at depth.
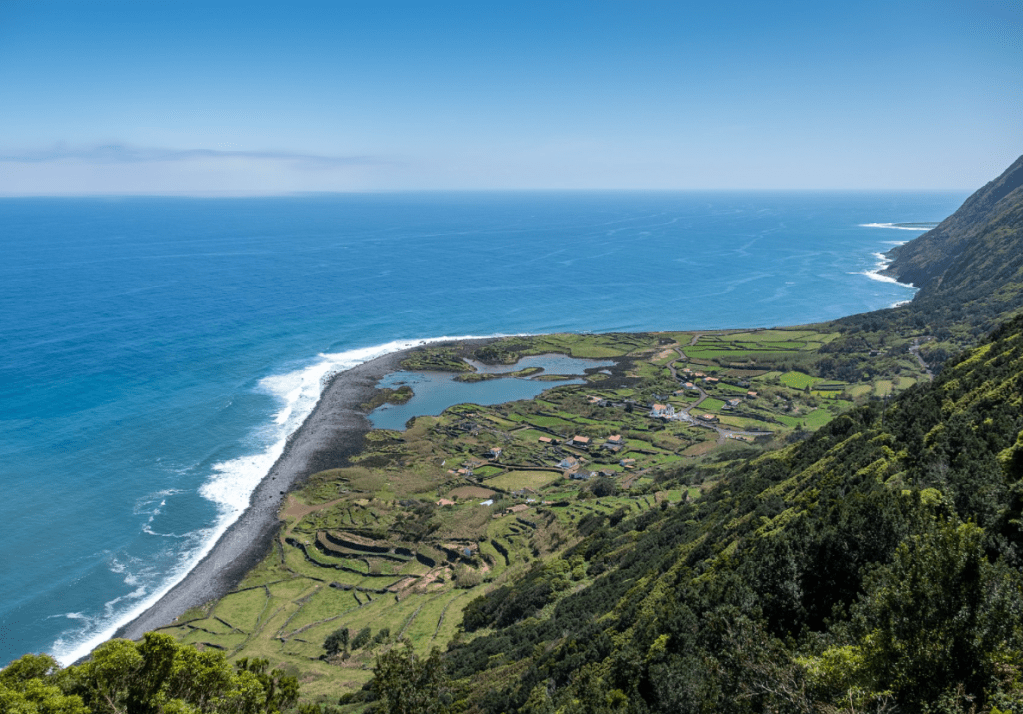
Fig 1: Image of Fajã dos Cubres, São Jorge, Azores, cropped from one by Jules Verne Times Two. Published under CC BY-SA 4.0 (Source: São Jorge Island – Wikipedia).
While we wait to see what transpires, here are some statistics.
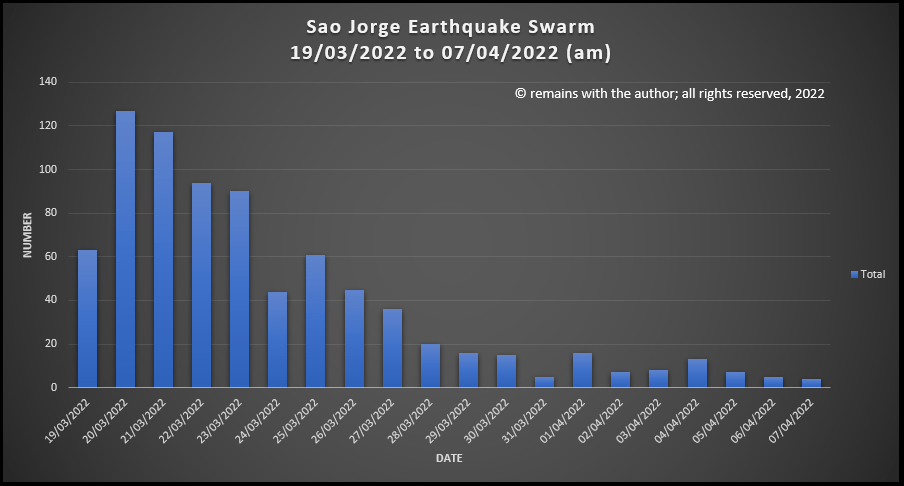
Number of earthquakes ≥2.0 reported on IPMA’s site: 793
Maximum number: 127 on 20 March 2022
Minimum number: 5 on 31/03/2022 and 06/04/2022 (7/04/2022 is not a complete day)
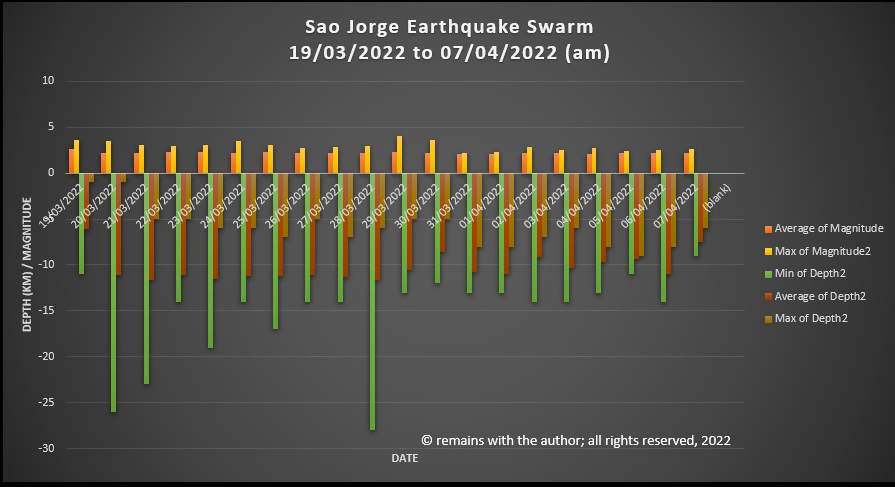
Maximum magnitude: 4.0 (29/03/2022, 21:56:16, 38.686°N, 28.215°W, 10km)
Maximum depth: 26km on 20 March 2022 and 28km on 28 March 2022.
Good Afternoon! (Updated 30/03/2022 to include Background)
On 19 March 2022 an earthquake swarm started on São Jorge, an island in the Azores. The swarm is ongoing at the time of writing. By 28 March 2022, c.14,000 earthquakes had been recorded. This swarm is likely to be caused by a magmatic intrusion.
Fig 1: Image of Fajã dos Cubres, São Jorge, Azores, cropped from one by Jules Verne Times Two. Published under CC BY-SA 4.0 (Source: São Jorge Island – Wikipedia).
INVOLCAN have estimated that up to 20 million cubic meters of magma may have accumulated under São Jorge during the swarm, based on satellite measurements of ground deformation. CIVISA (Centro de Informação e Vigilância Sismovulcânica dos Açores) has raised the alert level to V4 (out of a scale to V6. V5 and V6 are in eruption, based on size of the eruption).
There are four likely outcomes:
An eruption occurs in the next few days to weeks, possibly with little warning.
A larger earthquake occurs alongside changes in the magma intrusion leading to an eruption or stalling of the intrusion.
The current swarm and deformation end without eruption. Future swarms and deformation lead to an eruption.
The activity ceases and the intrusion cools with no further activity.
Locals have been advised to prepare to evacuate due to the risk of eruption or larger earthquakes. Our thoughts are with them.
Let’s take a look at what is going on underground. We have downloaded the earthquake data reported by The Portuguese Institute for Sea and Atmosphere, I. P. (Source: IPMA – Seismic map). This shows earthquakes ≥2.0 magnitude. At the time of our download c. 840 earthquakes ≥2.0 had been recorded for São Jorge from 19/03/2022.
Our video shows geoscatter plots by day, showing the north-westward migration of the swarm, and 3D rotating scatter plots.
Around 8,400 people live on the island in settlements around the coast. Transport links have historical been by sea as land transport was inhibited by the harsh volcanic terrain. The economy is reliant on dairy farming, including the export of São Jorge cheese, fishing and some cereals, vineyards and local vegetables. The opening of an airport in 1982 led to the expansion of the export of cheese, farming and small crafts.
São Jorge Island, itself, is 55km long and 6km wide volcanic ridge in the Azores Archipelago. The Azores are located at a triple junction between the North American, Eurasian and Nubian Plates; the Mid Atlantic Ridge forms the eastern boundary of the North American Plate. The Azores Plateau is considered to be a large igneous province generated from a plume interacting with the Mid Atlantic Ridge between 20 and 7 million years ago. Fissural volcanic activity arising from the interaction and tectonics created the islands.
There are four known centres of volcanic activity on São Jorge: the São João area on the south eastern end of the island; the Topo Volcanic Complex, occupying most of the eastern side of the island; the Rosais Volcanic Complex, with basalt and andesites; and Manadas Volcanic Complex on the west side of the island. The earliest known subaerial lava is alkaline enriched c.1.32 – c.1.21 million years old from deep partial melting of an enriched garnet peridotite mantle source. This is located at the south east end of the island at São João with a NW-SE to NNW-SSE direction oblique to the current WNW -ESE axis of the island. The period includes at least thee episodes of magma differentiation from alkaline basalts to mugearites in a shallow magma reservoir. Subaerial activity resumed c. 750,000 years ago at the Topo Volcanic Complex, with several overlapping episodes migrating westward along the axis of the island. Activity in the western side of the island started c. 731,000 years ago. The lavas generated 750,000 years ago and subsequently were also generated from an enriched mantle source. The different phases of subaerial growth are attributed to different episodes of deformation reopening the magma feeding system. It is possible that submarine activity occurred during the period of apparent quiescence.
GVP lists 11 confirmed Holocene eruptions for São Jorge, of which one is VEI 3 (1580), one is VEI 2 (1800) and one is VEI 1 (1808). Three are submarine: 1964, off the SW coast; 1902, off Ponta do Topo; and, 1800, also off Ponto do Topo. The eruptions in 1580 and 1808 caused widespread damage. In the 1580 eruption, magma ascended from 23km or more, ponded at 16km and then erupted in three lava flows along the Ribeira da Almeida, Queimada and between Ribeiro do Nabo and the beach of Cruzes; ten people were killed. In the Urzelina eruption in 1808 , fractionated residual ponded magma from the 1580 eruption emerged as andesite-basaltic lava to flow south west of Pico do Pedro to Urzelina. This eruption caused gases and chloric, sulfuric and carboxylic acid vapours to be emitted from the Manadas Ridge, which along with eight large earthquakes, caused significant damage to property and farmland. Eight people were killed in the 1808 eruption.
The island and surrounding area is heavily faulted. Submarine fractures between the São Jorge and Pico have resulted in large damaging earthquakes. In 1757, an earthquake centred in Fajã dos Vimes resulted in destruction of property in Manadas and the death of c. 20% of its population (1,000 people).
A series of seismic swarms in February 1964 associated with an offshore eruption 6.5km northwest of Velas led to large earthquakes which destroyed most property in the western side of the island. The eruption was preceded by seismic activity starting tremors felt on 21 August 1963, followed by a swarm which lasted from mid-December 1963 to January 1964 and the cutting of submarine cables on 29 January and 1 February 1964. Volcanic tremors started on 14 February 1964, resulting in a large damaging earthquake on 15 February after a lull in activity. The earthquakes initially impacted Urzelina, Manadas, San António and Norte Grand before migrating north west to include Rosais, Beira, Velas, and Santa Amaro. Low intensity tremors occurred in the period before the next large events on 21 February 1964 when three large tremors caused more damage; this phase ended on 24 February 1964. Earthquake foci near the centre of the island had depths of 5km, whereas those near Velas were 10-20km in depth. Neighbouring islands also experienced large tremors. The event ended on 25 February 1964. 5,000 people were evacuated from the island during this time, not an easy task as storms in the channel between Terceira, Pico an b d Faial hampered relief efforts, along with lack of planning. This time with monitoring the authorities are better prepared.
Time will tell when the next eruption occurs on São Jorge. In the meantime, here’s hoping that the disruption to local residents is short-lived.
Anthony Hildebrand, Pedro Madureira, Fernando Ornelas Marques, Inês Cruz, Bernard Henry, Pedro Silva, “Multi-stage evolution of a subaerial volcanic ridge over the last 1.3 Myr: S. Jorge Island, Azores Triple Junction”, Earth and Planetary Science Letters, Volume 273, Issues 3-4, 15 September 2008, Pages 289 -298.
Anthony Hildebrand, Dominique Weis, Pedro Madueira, Fernando Ornelas Marques, “Recent plate re-organisation at the Azores Triple Junction: Evidence from combined geochemical and geochronological data on Faial, S. Jorge and Terceira volcanic islands”, Lithos, 210-211, (2014), 27-39.
Vittorio Zanon, Fátima Vieros, “A multi-method re-evaluation of the volcanic events during 1580 CE and 1808 eruptions at São Jorge Island (Azores Archipelago, Portugal), Journal of Volcanology and Geothermal Research, Volume 373, 15 March 2019, Pages 51–67.
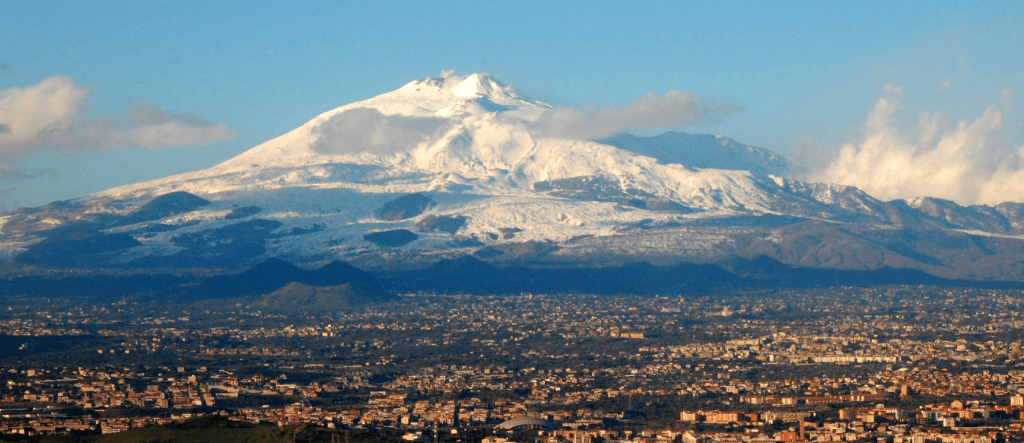
Fig 1: Cropped image of Mount Etna with Catania in the foreground from a photo by BenAveling in 2007, published under CC BY-SA 4.0. Source: Mount Etna – Wikipedia
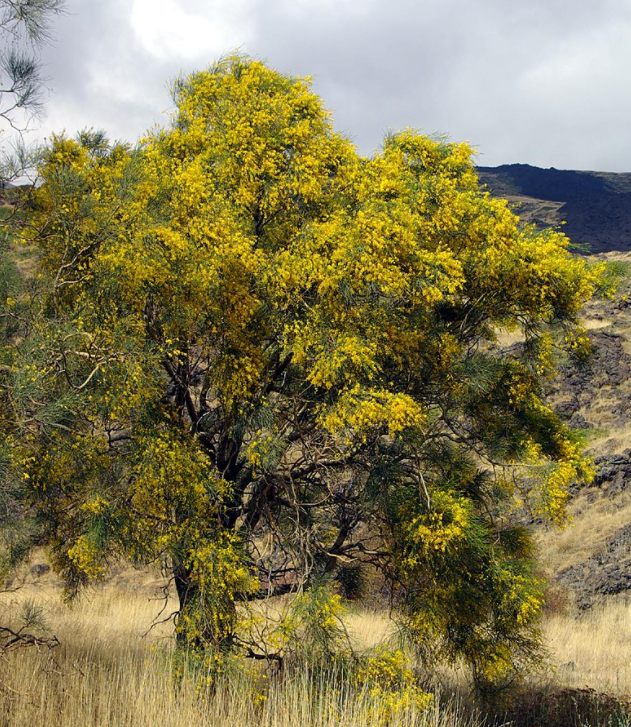
Today we are looking at Mount Etna, Europe’s largest and most active volcano, sited on the eastern side of Sicily. Sicily has been at the heart of many Mediterranean trading routes. As a result, the volcano has been widely studied. Etna has been designated a Decade Volcano by the UN. She is home to indigenous species, Etna Broom, which thrives on its lower slopes. In 2013, she was designated a UNESCO World Heritage Site.
Apart from the widely reported recent activity, she caught our eye because of the interesting tectonic setting between the African Plate, Eurasian Plate, Adriatic Plate and additional micro-plates. The area has some of the deepest subduction in the Mediterranean region. We start with her tectonic setting.
Mount Etna is a c.3,320m high complex volcano with four summit craters: the North East, Voragine, Bocca Nuova and the South East Craters and many cinder cones. The volcano is made up of an old shield volcano, topped by stratovolcanoes, Ellittico and Mongibello. It is truncated by small nested calderas.
The volcano has erupted basalts, viscous granitic lava, trachyte and again basalt. The last is rich in iron with microscopic gold particles. The basalt is used for building and sculpture. Until health and safety concerns banned it, the fluid lava was collected to be made into souvenirs for tourists.
The source for Etna’s lavas is not clear. You will see from our earthquake plots below that there is little evidence of subduction beneath Etna, herself, although there is clear evidence of subduction beneath the neighbouring Aeolian Arc. Various theories have been proposed: rifting; a hot spot; and, the intersection of breaks in the crust associated with the subduction of the African Plate under the Eurasian Plate, providing a channel for magma.
Tectonic Setting
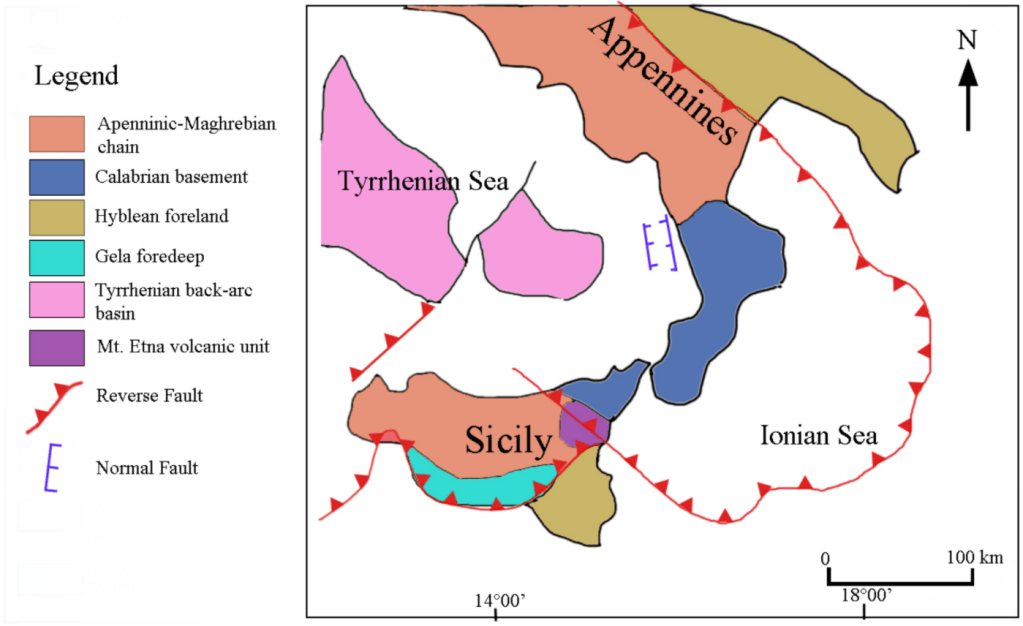
The collision of the Eurasian and African Plate has a complex history. In the vicinity of Sicily, the Tyrrhenian and Ionian Seas opened, the Aeolian – Calabrian Arc suffered subduction, bending and compression and the edge of the Eurasian Plate was thrust over the edge of the African Plate. The Adriatic Plate broke off and the Ionian Plate was subducted under the Tyrrhenian Sea.
Sicily
The main tectonic features of Sicily are the crystalline units of the Calabrian arc; the Neogene Maghrebian fold and thrust belt created during the opening of the Tyrrhenian Basin; the Catania – Gela foredeep; and the Hyblean Plateau.
The Calabrian Arc unit is located in the north eastern part of Sicily. It is the tectonic unit that connects the Apennines with the North African Maghrebide. The Arc migrated to the south east, driven by the subduction of the Ionian slab east of Sicily. In the early Miocene, Calabria was attached to Sardinia. Trench roll back to the east and extension in the middle Miocene, caused Calabria to break off from Sardinia. By the early Pliocene, back arc volcanism relating to subduction of the Ionian slab had created new crust in the Tyrrhenian Sea. From the Pleistocene, the eastern portion of the Arc formed the Apennine mountains in Italy, while the Calabrian block had migrated to Sicily. The migration is ongoing. Palaeozoic igneous and metamorphic basement rocks are exposed at this part of the island. Triassic late Cretaceous carbonate is overlain by Paleogene – Middle Miocene turbidites, Middle Miocene to – Messinian rift deposits, Messinian evaporites and early Pliocene chalk.
The Maghrebian fold and thrust belt, part of a subduction regime, comprises frontal accretion and detached nappes of Mesozoic carbonate, which has been folded in to a syncline, underlying the anticline of the Caltanissetta region.
The Catania – Gela foredeep extends from the northern margin of the Hyblean Plateau to the offshore Gela basin of southwestern Sicily. It was formed due to bending of the carbonate platform caused by loading at the front of the Gela nappe. In the late Miocene – Pleistocene sediments were deposited, including limestones, evaporites and sandy clays.
The Hyblean Plateau is on the Nubian Plate. In the early Miocene, regional uplift caused by thrusting and volcanism resulting in the emergence of a carbonate platform in the eastern Hyblean Plateau. In the late Miocene, sea level fall and uplift caused the deposition of evaporites in the Mediterranean basin. This was followed by subsidence in the foreland and deposition of sediments. In the late Miocene – early Pleistocene, basaltic volcanic activity occurred; alkaline basalts were erupted during the late Miocene. In the late Pliocene, large volumes of tholeiitic basalt was erupted and the foredeep north of the Hyblean foreland collapsed.
Mastrolembo et al(1) found evidence for independent lithospheric blocks by studying GPS velocities relative to the Eurasian and Nubian Plates. The Sicilian domain rotates clockwise with respect to Eurasia and is fragmented into three distinct blocks: the south eastern, the central and the north eastern Sicily blocks, which move independently from the African Plate.
Deep faults transect the island. Currently, the Tyrrhenian side of Sicily is being compressed and the Ionian side extended. Mount Etna, itself, is located near to the junction of three major lithospheric faults which may reach the mantle: the east to west Mt Kumeta -Alcantara fault; the north -northeast to south-southwest Messina – Giardini fault which delimits the north coast of Etna; and, the Aeolian-Maltese fault which extends from Vulcano to Malta.
Mount Etna’s History
Mount Etna is a complicated volcanic system; she is thought to have evolved in four stages: 1) tholeiitic basalt; 2) Timpe shield-building; 3) Valle del Bove Central Volcanoes; and 4) Stratovolcanoes.
Tholeiitic Basalt Stage
Earliest activity at Etna has been identified as being the sporadic eruption of tholeiitic pillow lavas from fissures more than 500,000 years ago in the submarine environment of the Gela-Catania foredeep basin at Aci Castello. 300,000 years ago, Na affinity lavas were erupted in fissure eruptions on the alluvial plain of the Simento River, forming a lava plateau.
Timpe Shield Building Stage
220,000 years ago, extension tectonics of the NNW-trending Timpe fault system drove activity. Sub alkaline – Na alkaline were lavas erupted in fissures along the Ionian coast built a 22 km NNW -SSE aligned shield volcano. Volcanic activity also occurred to the south west and south east of the location of the now current edifice. 129,000 to 126,000 years ago, activity shifted to a location at the central portion of the location of the current volcano.
A 15km horseshoe depression in the east flank of the edifice was created during this period. The edifice rested on basement rocks of Miocene argillaceous turbidites in the north and west, but on Pleistocene clay rich marine sediments to the south and the east. The clays were unable to support the weight of the edifice, resulting in slippage and subsidence to the east.
Valle Del Bove Central Volcanoes Stage
During this period magma ascent through the crust became more localised, allowing the building stratovolcanoes. Several monogenetic volcanoes are visible in the Valle del Bove scars. Na-alkaline lavas were erupted.
121,000 years ago, effusive eruptions occurred on the southern edge of the volcano in the N – S aligned Tarderia and Rocce volcanoes in the Valle Del Bove area. Activity at Tarderia and Rocce ended between 106,000 and 102,000 years ago, respectively.
Trifoglietto volcano was also active at this time. While the onset of activity at Trifoglietto is not known (there are no rocks outcropping to date), activity is believed to have ended c. 99,000 years ago with explosive benmoreitic Plinian eruptions.
Activity then shifted to Monte Cerasa, Giannicola, Salifizio and Cuvigghiuni volcanoes. Monte Cerasa volcano is a large composite stratocone in the central part of the present Valle del Bove with explosive eruptions and pyroclastic flows which transitioned to more effusive eruptions. Activity ceased here 93 ka ago. Giannicola volcano is a 300 m neck intruded in the northern flank of Trifoglietto volcano about 85 ka ago followed by alternating pyroclastic deposits and lava flows. The main vent Salifizio volcano was located 1 km east of Trifoglietto. She produced effusive lavas that covered the eastern sides of Trifoglietto and Monte Cerasa. Cuvigghiuni erupted intrusive bodies into the western side of Trifloglietto, followed by lava flows , spatter deposits and pyroclastic flows between c. 80,000 and 65,0000 years ago. The final stage of her activity was effusive lava flows.
The Valle Del Bove, itself, was created during this period. Subsidence of the Trifloglietto volcano to the east led to reduction in magma pressure, successive violent hydro-magmatic eruptions and debris avalanche flows which carved out the Valle.
Stratovolcanoes Stage
In the fourth phase of growth , c. 60,000 years ago, Etna’s magmatic plumbing system had stabilised at its current position. Two overlapping stratovolcanoes were formed, which form the current upper edfice: Ellittico between 60,000 and 15,000 years ago and Mongibello from 15,000 years ago to present. Ellittico erupted trachybasalt, followed by mugearites, benmoreites and trachytes, reaching a height of 3,700m before 4 caldera-forming Plinian eruptions signalled the end of activity at Ellittico.
From 15,000 years ago to present, activity at Mongibello has been a mix of lava flows and a few Plinian to sub-Plinian eruptions of basaltic / picritic magma. Silicic eruptions occurred in 8,460, 7100, 6100, 5000 and 4280 years ago. In 122BC a Plinian eruption formed the Cratere del Piano, the summit caldera. Other eruptions were basaltic, filling the caldera and building the cone.
GVP lists 241 Holocene eruptions for Etna, of which 196 have been confirmed. These include 2 VEI 5, 1 VEI 4, 26 VEI 3, and 167 VEI 2 or less. The VEI 5’s are the 122BC Cratere del Piano and another in 1500 BC.
Subsidence is continuing on the eastern flanks of the edifice, creating a series of rift faults and fault scarps.
Recent Seismicity
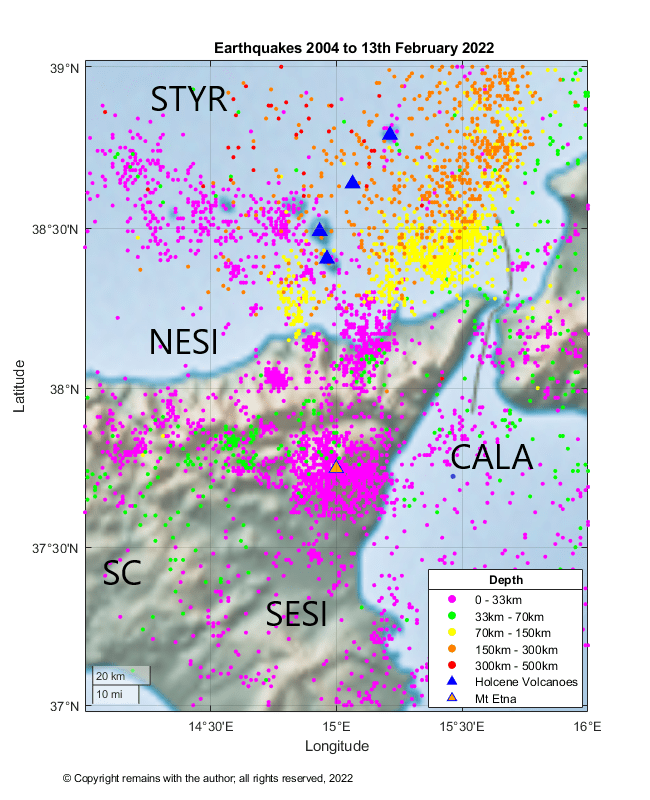
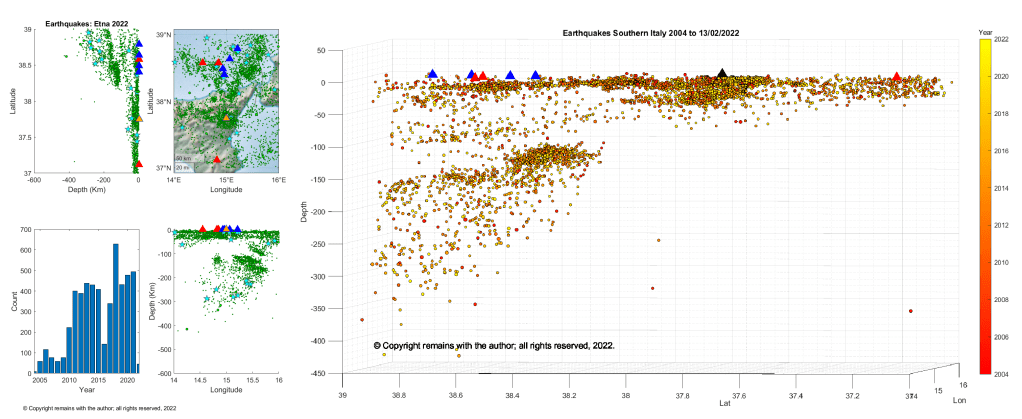
We have plotted earthquakes downloaded from EMSC for the period 1st October 2004 to 13th February 2022 for the area 37°N, 14°E to 39°N, 16°E.
There is little evidence of a Wadati-Benioff zone under Etna, although the area is seismically active. Our plots clearly show the subducted Ionian slab under the South Tyrrhenian Sea.
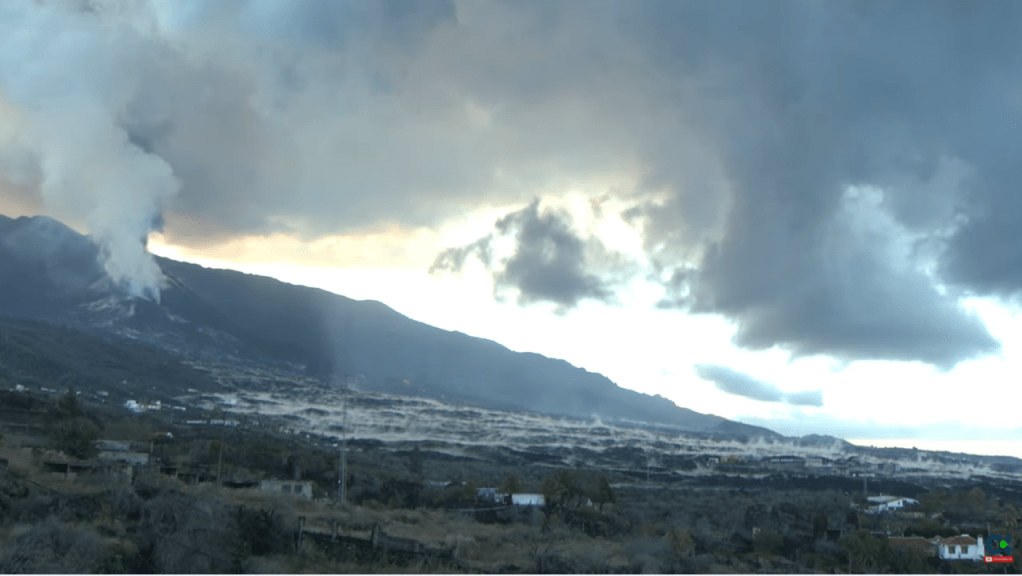
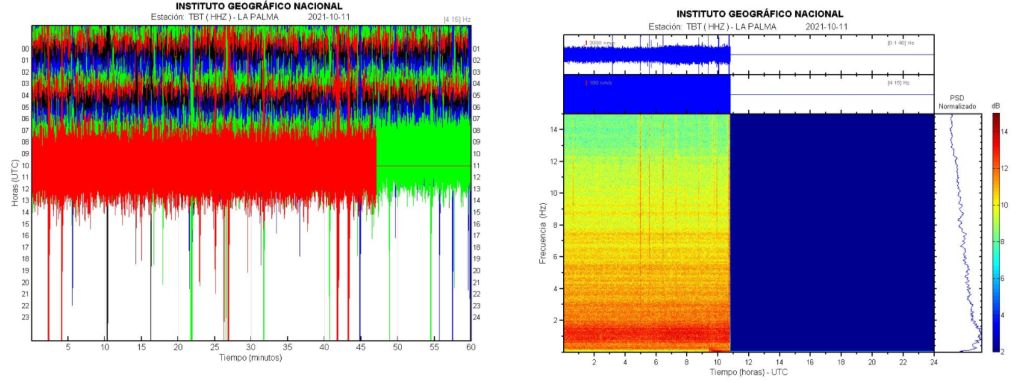
There was some good news for La Palma over the week end; the eruption was declared over on 25 December 2021. The eruption, itself, ended on 13 December 2021 at 22:21. There was a precautionary period of waiting before announcing the end of the eruption.
This is an important milestone in the process to recover and rebuild.
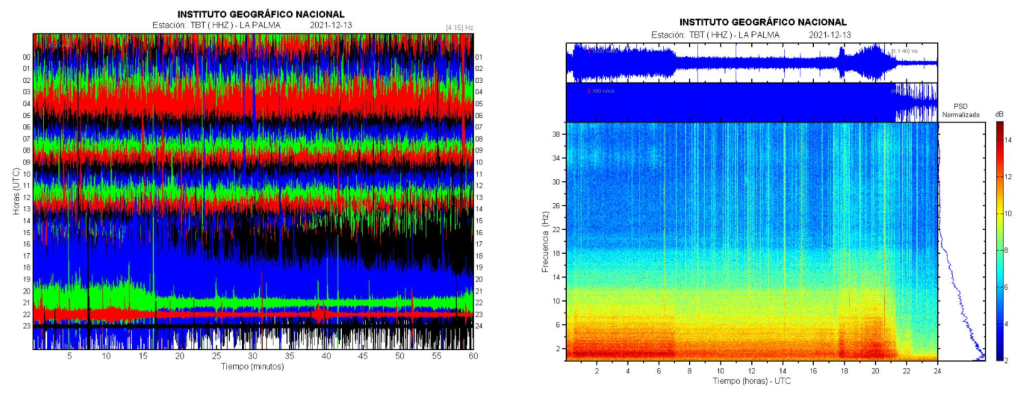
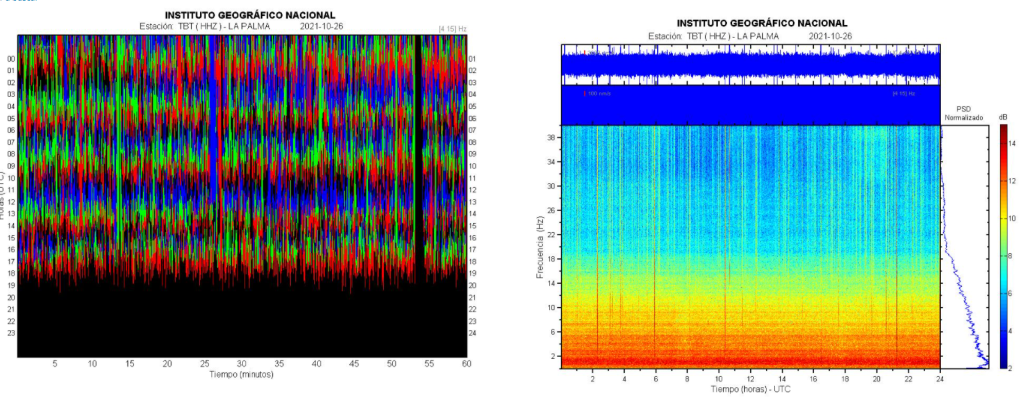
Fig 1: Seismic signal showing the end of the eruption. Source: IGN
Statistics
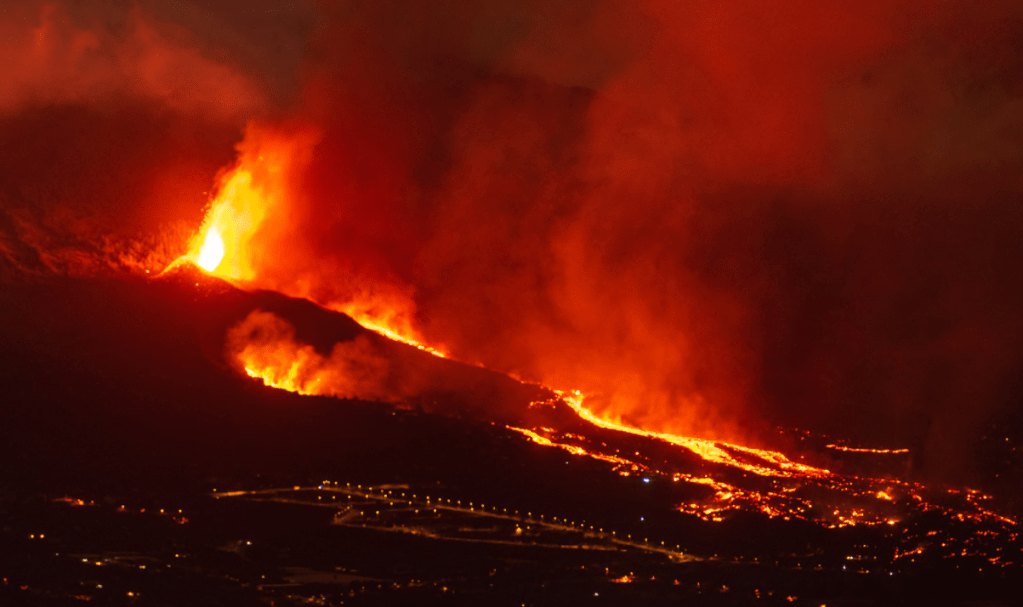
Eruption
The eruption started on 19 September 2021 as a flank eruption on the Cumbre Vieja volcano and ended on 13 December 2021. The duration of the eruption was 85 days and 8 hours – the longest for which there are historic records.
The eruptive style is described as Strombolian fissural with phreatomagmatic pulses.
The average height of the plume was 3.5km and its the maximum height was 8.5 km on 13 December 2021.
Edifice
The cone’s height is now 1,121m.
There are six craters, with diameters ranging between 106m and 172m.
Lava
200 million cubic meters erupted, covering an area of 1,219 hectares with an average thickness of 12m and maximum width of 3,350m.
The maximum temperature was 1,140°C.
Two lava deltas were created covering c. 48 hectares (one c. 43 hectares and the other 5 hectares).
Damage
2,988 buildings were destroyed and 138 damaged, according to satellite data. This is initially analysed by the local authorities as 1,345 residential properties, 180 agricultural, 75 industrial, 44 leisure, 16 public and 16 other; the shortfall is attributed to properties having more than one building within their boundaries.
Infrastructural damage includes: 73.8 km of road have been damaged along with streets and crossings; and, 130km power lines, 85 medium voltage towers, 1500 low voltage poles and 19 distribution centres.
We do not have an up to date analysis of the extent of the damage to crops and livestock.
Around 7,000 people were evacuated.
There was sadly one fatality which is under investigation.
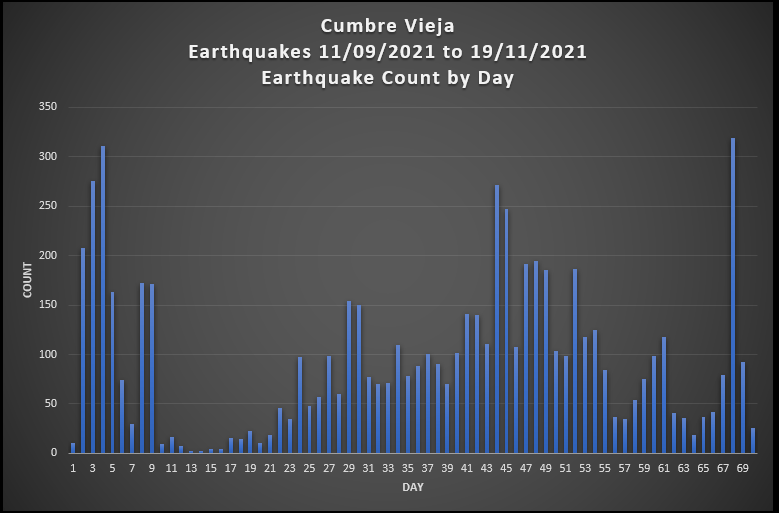
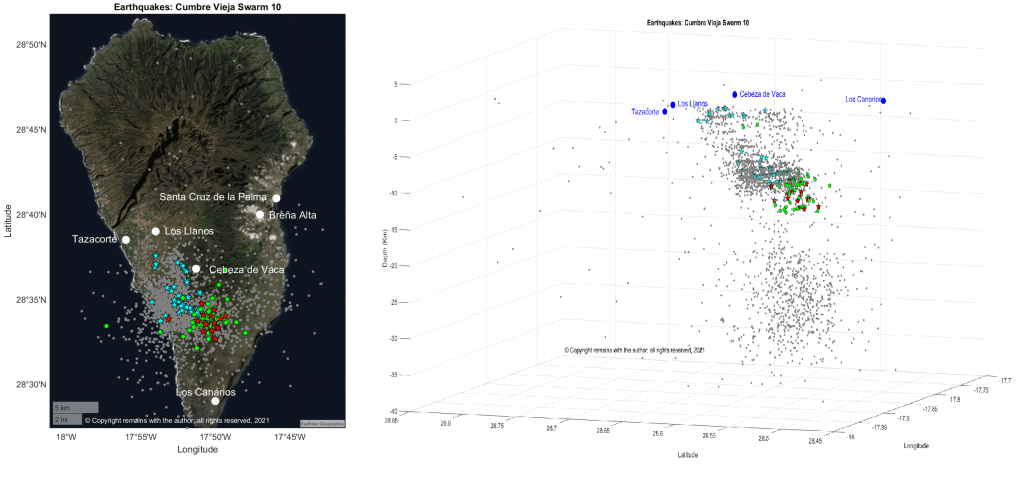
Seismic Activity
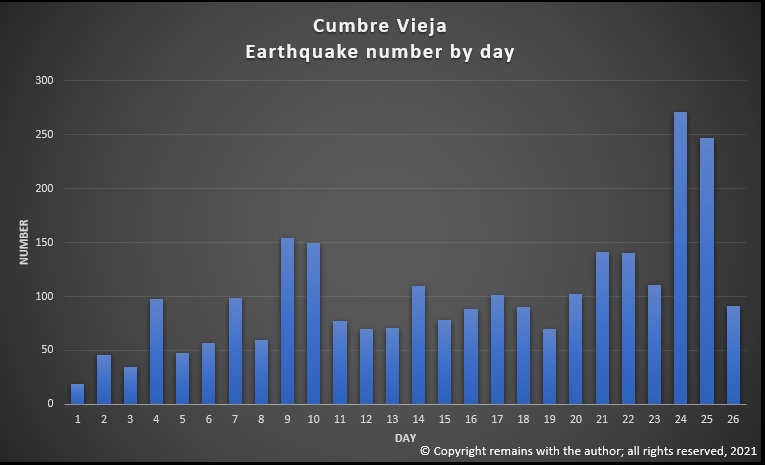
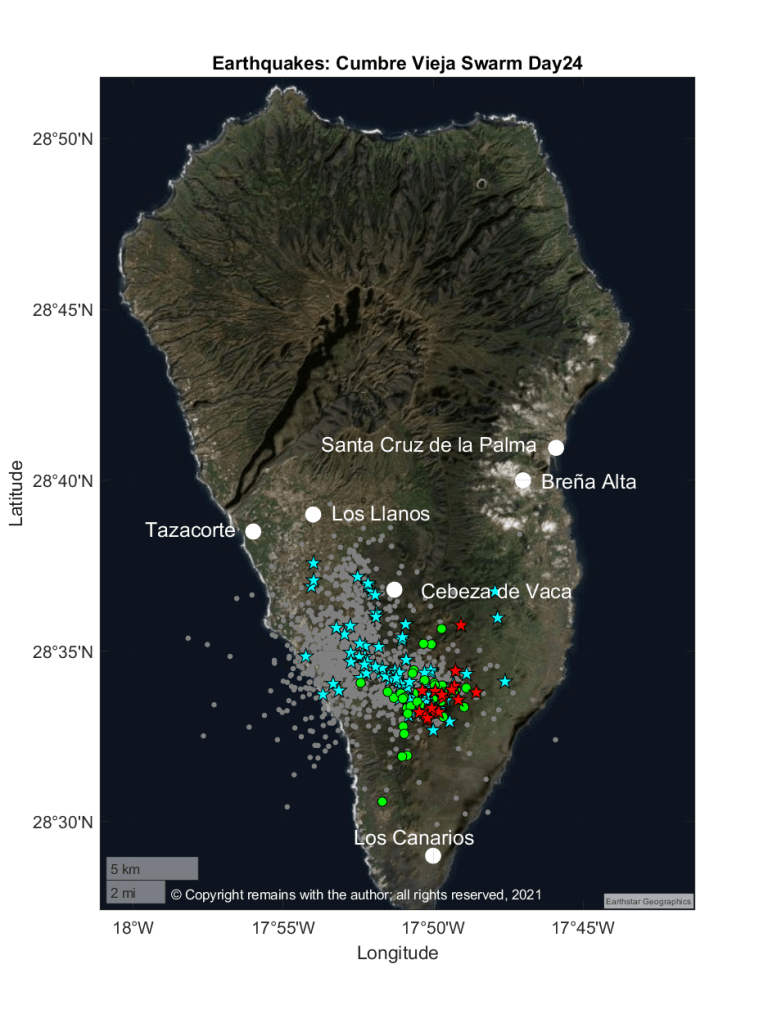
9,135 earthquakes were recorded in the period from 11 September (the onset of the swarm) and today, 27 December 2021. Due to the severity of the volcanic tremor, many smaller quakes were not recorded.
We have plotted the sequence. The results are shown in the video below.
The eruption of Cumbre Vieja continues unabated with Strombolian activity, lava fountains from many vents, lava flows, and ash emissions. . As of 16 November 2021, Copernicus reported that 1,042.1 hectares of land have been covered by lava. Rainfall now adds to the hazards created by volcanic ash. The cone reached a height of 1,130m by 10 November 2021. Sadly, one fatality has occurred; one person who had gone to assist with ash clearance was found dead in his home.
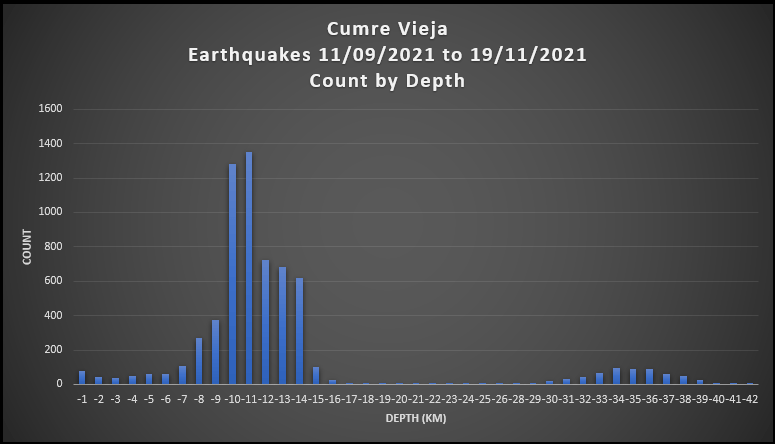
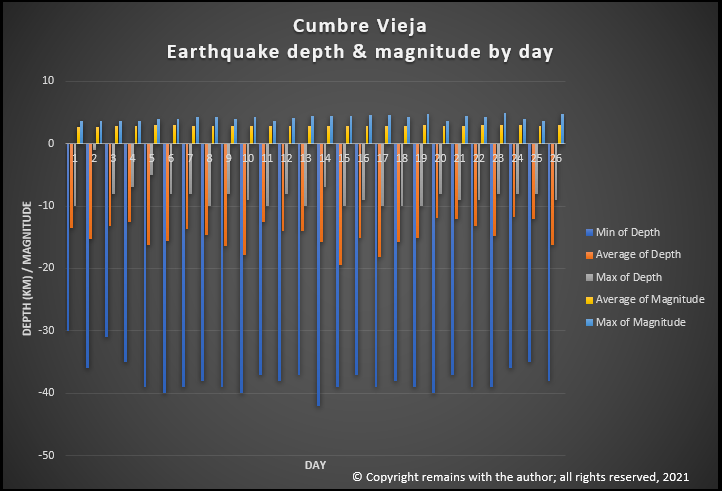
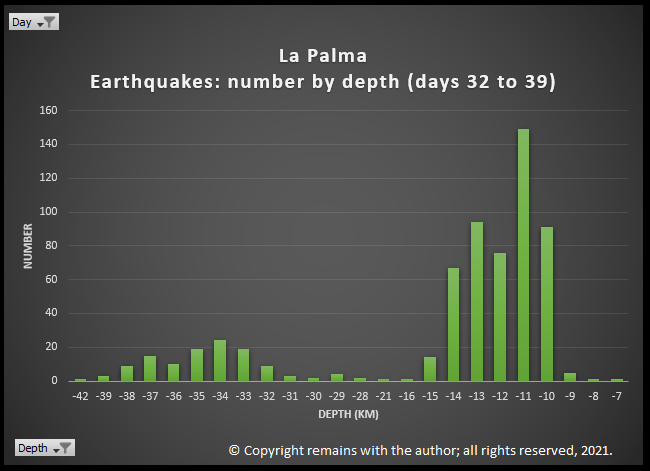
Here are updated earthquake plots. All of the action is centred around two depths: 7 -16 km and 30 -39 km, with a very few earthquakes in between; there are a few earthquakes with depths of more than 39 km.
For the updated video, we have provided the scatter plots for only earthquakes greater than or equal to 3.0 Mag. because the smaller earthquakes obscure the action; all earthquakes are included in the geoscatter plots.
Magma still appears to be stalling at the two depths: 7 -16 km and 30 -39 km prior to ascent (refer to La Palma: Earthquakes and Magma Plumbing for more information). How much of it reaches the surface remains to be seen.
It has been a week since we updated our last earthquake plots for La Palma so time to take another look. The eruption has continued in the meantime, with seismicity and seismic signals increasing. Earthquake activity continues mainly within the two levels 7 -16km and 30 to 42km identified in our previous plots.
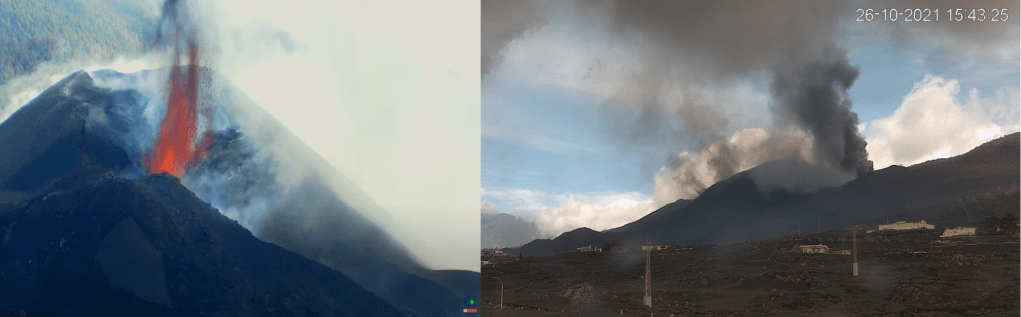
Several partial collapses of the main cone have occurred. The latest was yesterday, releasing a large amount of the lava to the west, which went over existing lava flows.
The latest statistics reported on 26th October 2021 are:
908.2 hectares of land have been affected by lava.
2,162 buildings haven been destroyed by lava, with a further 124 suffering damage.
66.2km of roads have been lost, with a further 3.4km damaged.
6,800 hectares of land have been covered by ashfall (reported 22nd October 2021).
Cost of lost banana plantations c.100m Euros, 150 hectares are under lava and others are in the exclusion zones; other crops, vineyards and livestock farming are also impacted.
SO2 emissions 40,800 tons per day. CO2 emissions up.
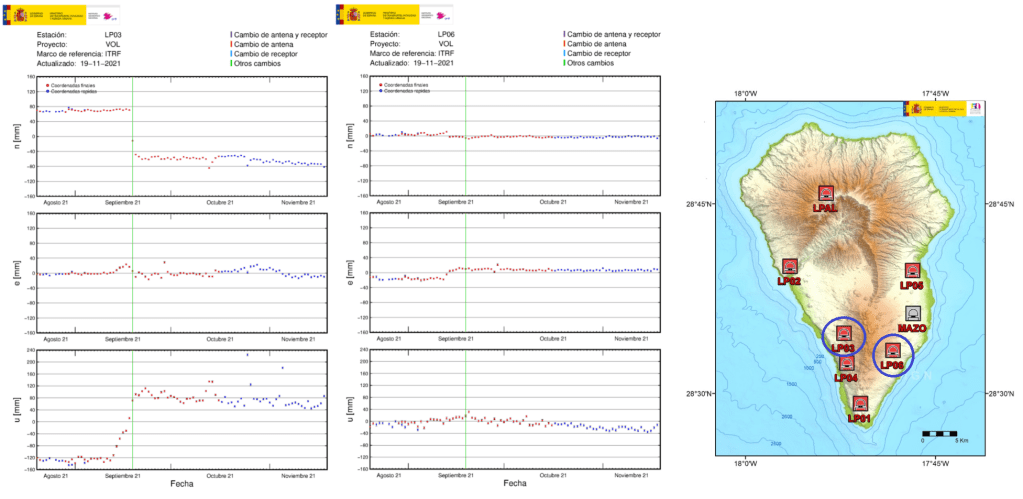
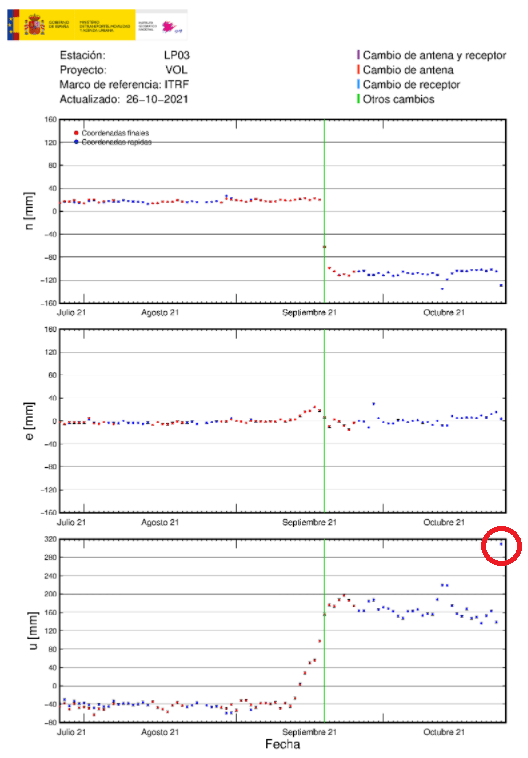
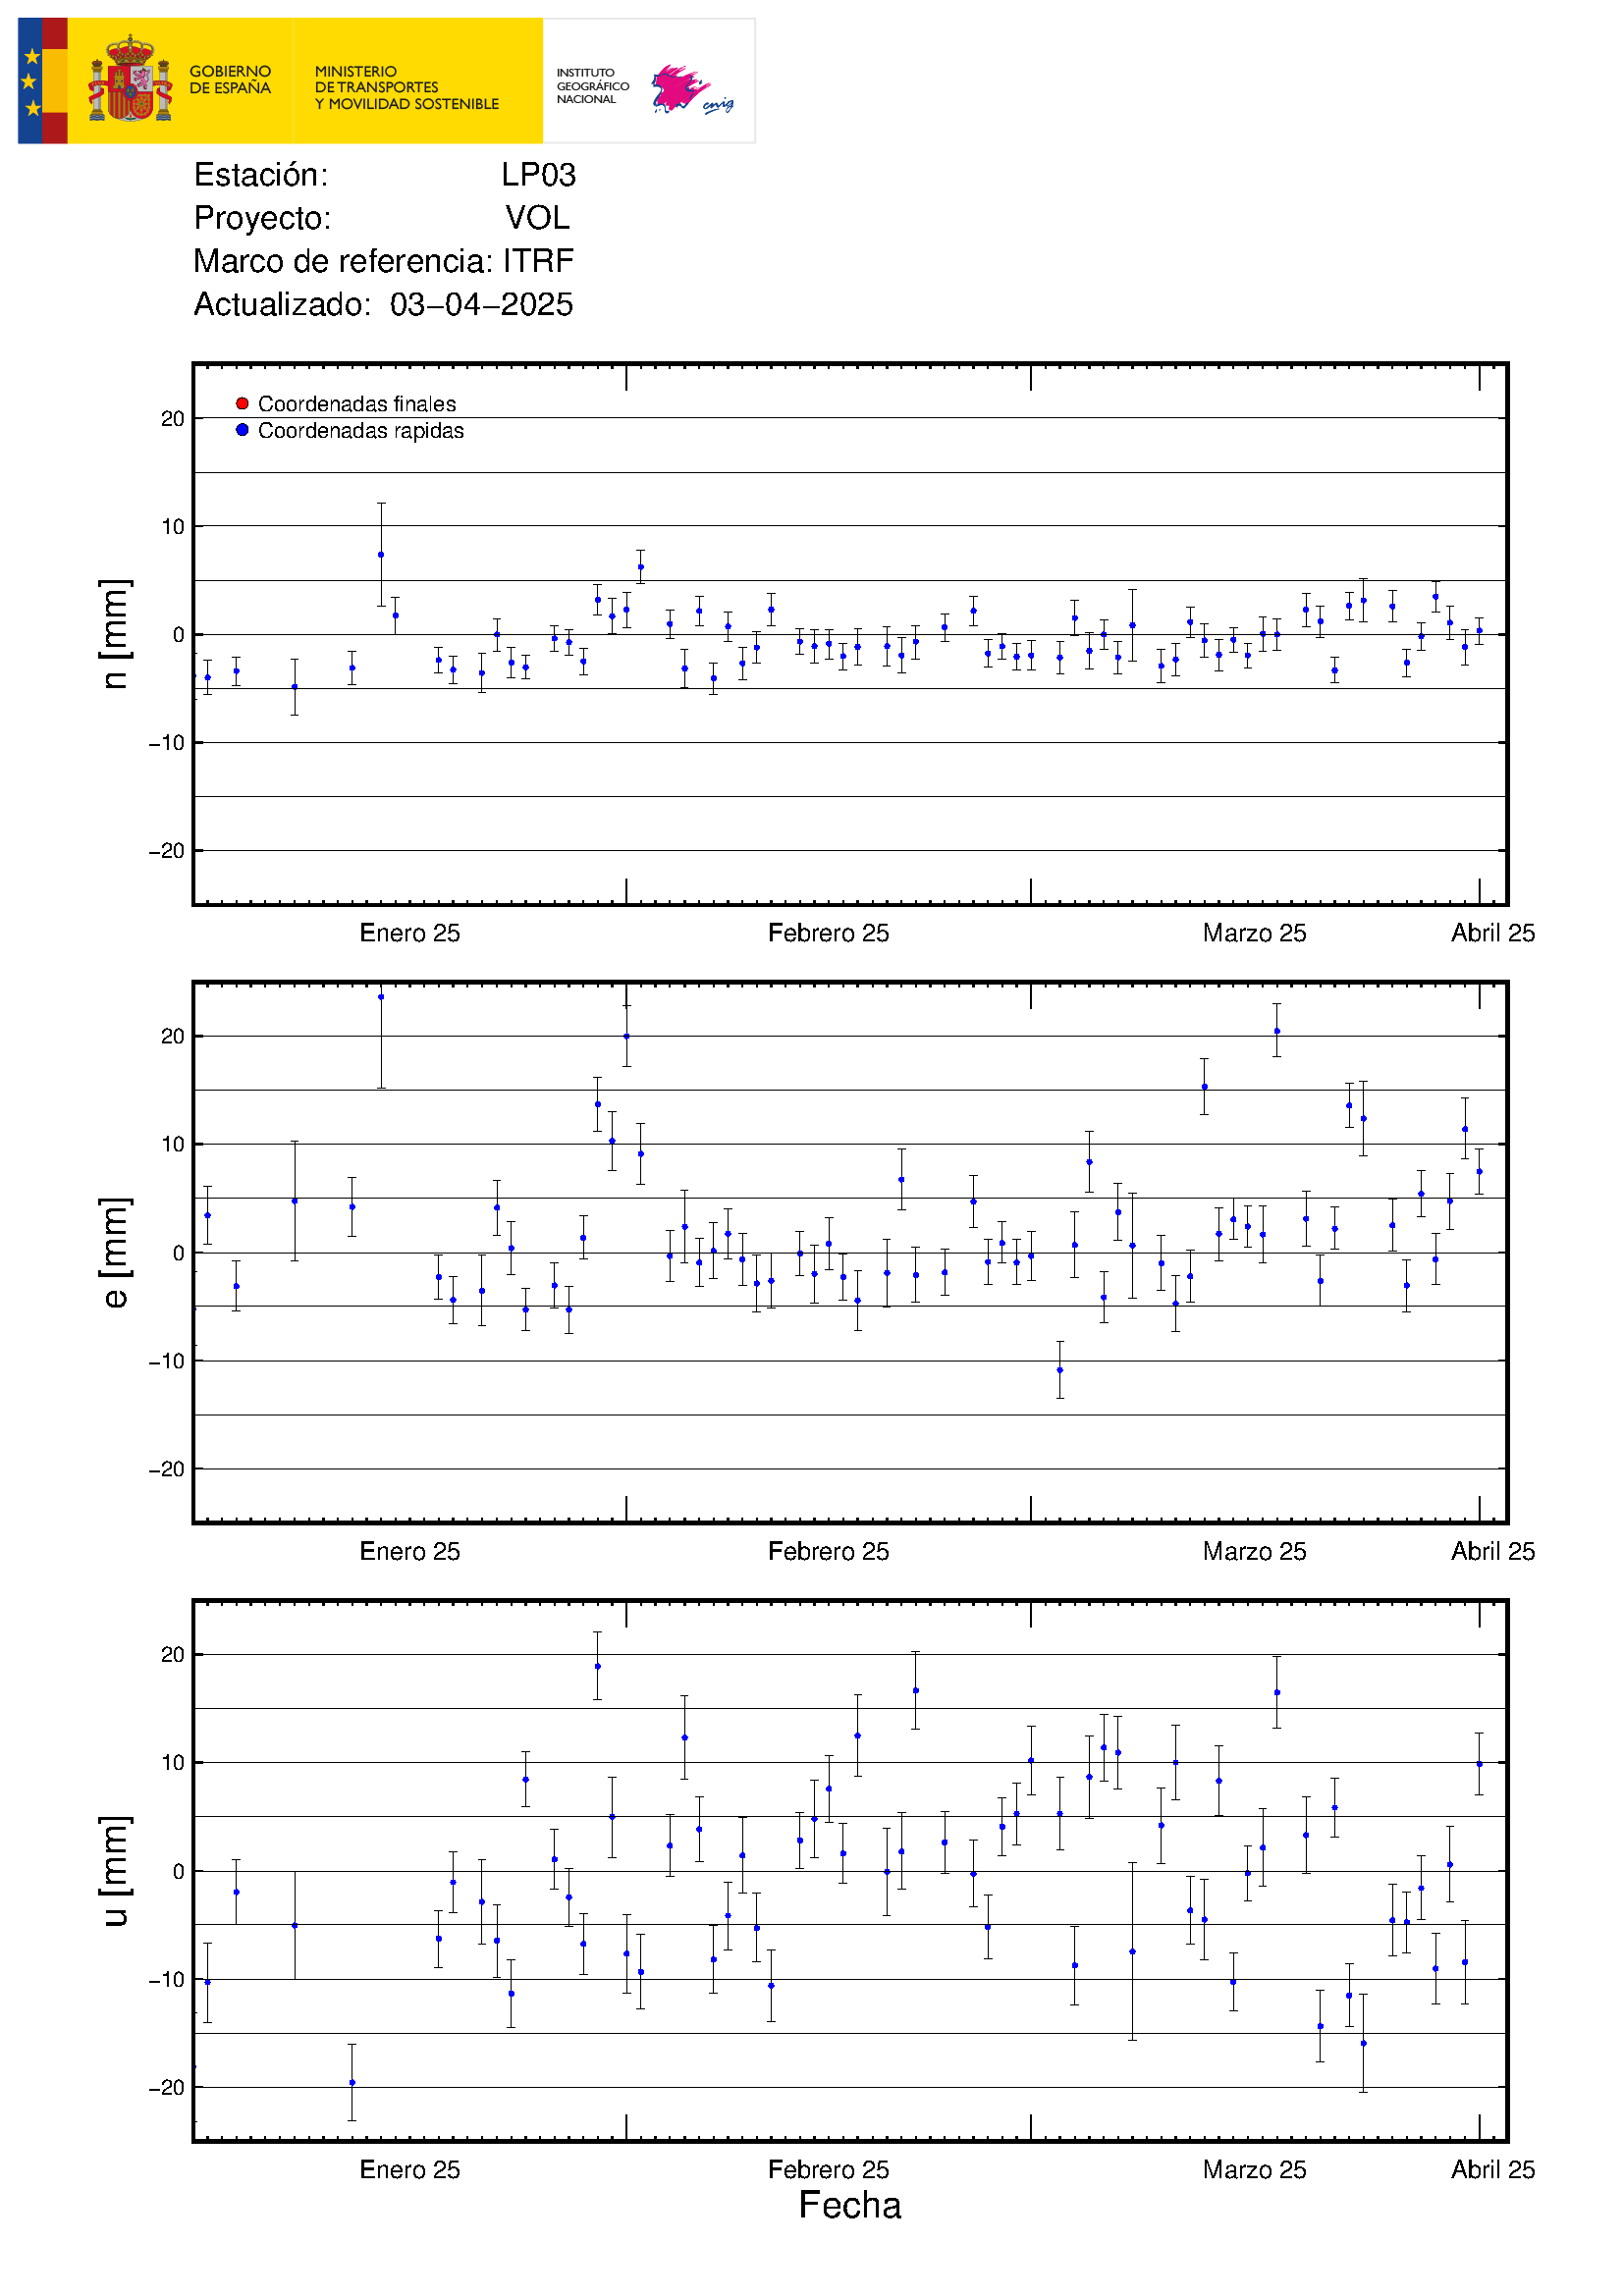
In the last 24 hours ground uplift of 10cm has been recorded at the station on the south of the volcano near the eruption site, which the volcanologists monitoring the eruption think may signal an increase in lava flow or the opening of a new vent.
Fig 2: Ground deformation at the station nearest the eruption site. We have circled the latest data point to make it easier to spot. Green line marks the onset of the eruption (added by IGN). Source: IGN
We have made geoscatter and scatter plots of the swarm from day 21, the onset of the deeper earthquakes. We have also made plots of the earthquakes over 3.0M, as these tend to get lost in the in the middle level swarm (7-16km).
There are now a few earthquakes between the two swarms but little in the way of reported earthquakes heading for the surface; the latter may mean that lava is flowing freely through the existing conduit, or that a new conduit may be in the offing. The hike in ground deformation reported above near the eruption site may indicate that whatever ensues, it is likely to be near the current eruption site – speculation on our part.
The eruption is now in its sixth week, lasting longer than recent previous eruptions, with no sign of waning. Has the initial eruption of magma created the right conditions for new magma to erupt from a greater depth, e.g. by creating a pathway for it and/or removing some of the constraining pressure? Only time, and a lot of research by the experts, will tell.
We have updated our earthquake plots to 19.10.2021 8:41:10. Since our previous update there has been more seismic activity, mainly between depths of 9-15km and 32- 42km. The former is consistent with the initial and subsequent stages of the swarm; the latter is consistent with the deeper earthquakes which started on day 21 (1.10.2021).
We’ve Googled around to see what’s likely to be going on at these depths. The 1585, 1949 and 1971 eruptions may shed some light on this. Researchers have found that the erupted lavas are formed by fractional crystallisation and stored in the upper mantle; during ascent, these lavas stall in the lower crust or near the Moho; there are no long-lived shallow magma reservoirs.
Fractional crystallisation is an indicator of the depths at which magma stalls in reservoirs. Earthquakes tend to occur around magma reservoirs or during the ascent of magma in response to the stresses on rock that changes in magma produce. Hence our interest in them.
The 1585 eruption produced 0.03km3 of lava, which was composed of basanites, tephrites, tephriphonolites and phonolite. The eruption is famous for the extrusion of phonolitic spines, named “Devil’s horns” by eye-witnesses, at the start of the eruption. Examination of the 1585 lavas indicate that the more evolved lavas were the result of fractional crystallisation. Magma differentiated at three levels: in the deeper mantle, c.20km depth, basanite evolved to tephrite 1550 to 1750 years, collecting in more than one reservoir, before the eruption; basanite also stagnated at the base of the crust, c.14km depth, to differentiate to tephrite; and, differentiation also occurred in the edifice. Further evolution of to tephriphonolite / phonolite may have occurred in the lower crust and upper crust. The basanite erupted may have originated from a different batch of magma than the erupted tephrite. 14km is the depth of the Moho under La Palma.
The 1949 eruption started on 24 June 1949 and ended on 30 July 1949. It had been preceded by weak seismic activity from 1936. Seismic activity picked up in February 1949, being felt mostly at the southern tip of the island and accompanied by ground cracking. Stronger seismicity and ground cracking immediately preceded the opening of the first vent. The primary melt was sourced at depths between 80-100km. Fractional crystallisation occurred at 20 to 26km with some possibly at 26-36km. Magma was stored temporarily in the crust before eruption. Magma mixing occurred in the mantle three months prior to eruption, causing a dike to propagate southwards. A 3km long fissure eruption started with the Duraznero crater emitting tephrite for 14 days. This was followed by the Llano Blanco crater opening to erupt tephrite for three days, followed by basanite for three days. The Hoyo Negra crater opened 4 days later to erupt basanite, tephrite and phonotephrite, during which the Llano Blanco crater continued to erupt basanite. The Duraznero crater then erupted basanite. The eruption started on 24 June 1949 and ended on 30 July 1949. The primary melt was sourced at depths between 80-100km. Fractional crystallisation occurred at 15 to 26km with some possibly at 36km. Magma mixing occurred in the mantle three months prior to eruption, causing a dike to propagate southwards. Magma was stored temporarily in the crust between 7-14km before eruption. Later calculations put the depth of fractional crystallisation at 35-45km.
In 1971 Cumbre Vieja erupted again, this time at Teneguía, emitting 135,000 m2 of lava and created a 290,000 m2 lava platform – 40 million m3 of lava in total. This eruption produced basanitic to phonolitic lavas. The eruption was Strombolian and in two phases: initially a 300m fissure opened on 26th October 1971, producing effusive lava flows from vents; and, new vents opened on 8th November 1971, with rhythmic explosions, lapilli, scoria and lava bombs. CO and CO2 were emitted; these gases were thought to be the cause of death for the eruptions two fatalities. Examination of the lavas showed that magma stalled at two depths: clinopyroxene and plagioclase crystallised at depths of 20-45km; and the crystallisation of aluminium augite indicated that magma then ascended to 20-35km. Variations in the samples tested indicates that magma formed in batches over a range of depths in the lithospheric mantle to combine before ascent.
Taburíente, Cumbre Nueva and Bejenado each have zones of clinopyroxene crystallisation between 25-45km. Earlier Cumbre Vieja eruptions had shallower zones of 15-30km, before the deeper zones of the 1949 and 1971 eruptions (35-45km and 25-45km, resp.). In the earlier Cumbre Vieja eruptions magma stalled beneath the Moho and the in the later eruptions magmas depths were more in line with Taburíente, Cumbre Nueva and Bejenado.
How does this Compare to the Current Earthquakes?
To make any conclusions we need to wait until there is a detailed analysis of the erupted lavas. However, we can note that the current earthquakes are at two distinct depth ranges: 7 -16km and 30 to 42km, with not much in between. 7-16km correlates to a possible zone of magma storage beneath the crust and magma migration through the crust. 30 to 42km correlates to part of the lower zone of fractional crystallisation of the 1949 and 1971 magmas.
Time will tell how this eruption will pan out. In the meantime, the eruption is still going strong. Our thoughts continue to be with those affected.
Kursten Galipp, Andreas Klügel, Thor Hansteen, “Changing depths of magma fractionation and stagnation during the evolution of an oceanic island volcano: La Palma (Canary Islands)”, Journal of Volcanology and Geothermal Research Volume 155, Issues 3–4, 15 July 2006, Pages 285-306. Link: Source
T. S. Johansen F. Hauff K. Hoernle , A. Klügel, T.F. Kokfelt, “Basanite to phonolite differentiation within 1550–1750 yr: U-Th-Ra isotopic evidence from the A.D. 1585 eruption on La Palma, Canary Islands”, Geology; November 2005; v. 33; no. 11; p. 897–900. Link: Source
Andreas Klügel , Kaj A. Hoernle, Hans-Ulrich Schminck , James D. L. White, “The chemically zoned 1949 eruption on La Palma (Canary Islands): Petrologic evolution and magma supply dynamics of a rift zone eruption”, Journal of Geophysical Research, Vol 105, No. B3, Pages 5997-6016. Link: Source
Abigail K. Barker, Valentin R. Troll, Juan Carlos Carracedo, Peter A. Nicholls, “The magma plumbing system for the 1971 Teneguía eruption on La Palma, Canary Islands”, Contributions to Mineralogy and Petrology 170, Article number: 54 (2015). Link: Source
The eruption at La Palma is continuing unabated, sadly with more evacuations for areas in the path of the lava.
Let’s take a moment to look at her fellow island, El Hierro. La Palma and El Hierro occupy the same N-S line at the western end of the Canary Island archipelago: La Palma to the north and El Hierro to the south. El Hierro experienced a N-S aligned fissure eruption between October 2011 and March 2012.
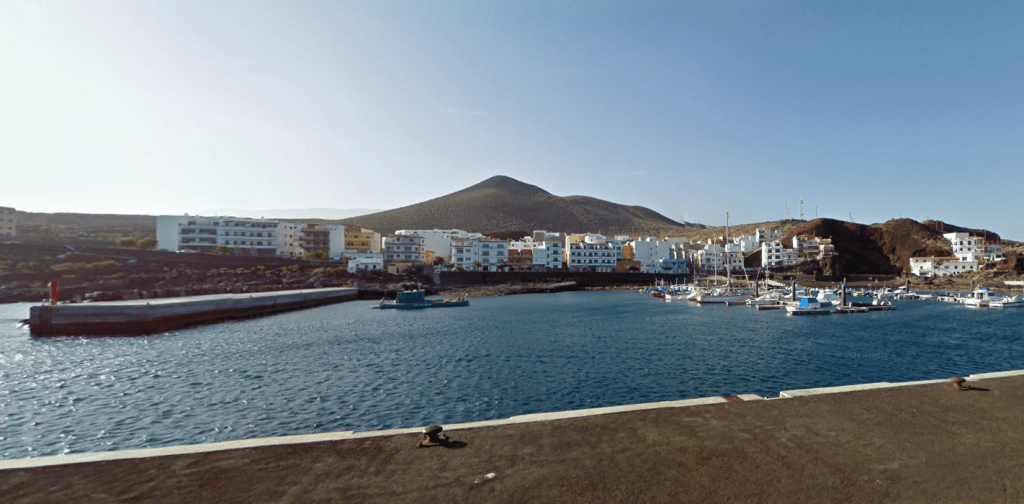
Fig 1: La Restinga as seen from the harbour wall. Image captured from Google Maps, 2021.
Background
El Hierro is a shield volcanic island which formed around 1.2 million years ago. It is made up of three volcanoes, Tiñor, El Golfo, and, later rift volcanism.
The island has a population of c. 10,000. The capital is Valverde, located near the eastern end of the island. The earliest known inhabitants were the Bimbaches, thought to be descendants of the Guanches who had migrated from Tenerife. Sadly, many of the Bimbaches were sold as slaves by the son of the first Spanish conquistador. The island was then populated by both the Spanish and Normans. Some the slaves were later returned to the island having won their freedom.
The island’s climate is influenced by the Trade Winds. Warm moist air is deposited on the northern side of the island. The climate varies from warm-summer Mediterranean climate in the centre of the island, to mild semi-arid and to a tropical mild, desert climate on the coasts.
The island, home to endemic species such as the endangered El Hierro giant lizard, has been designated as a Biosphere by UNESCO to preserve its natural and cultural diversity.
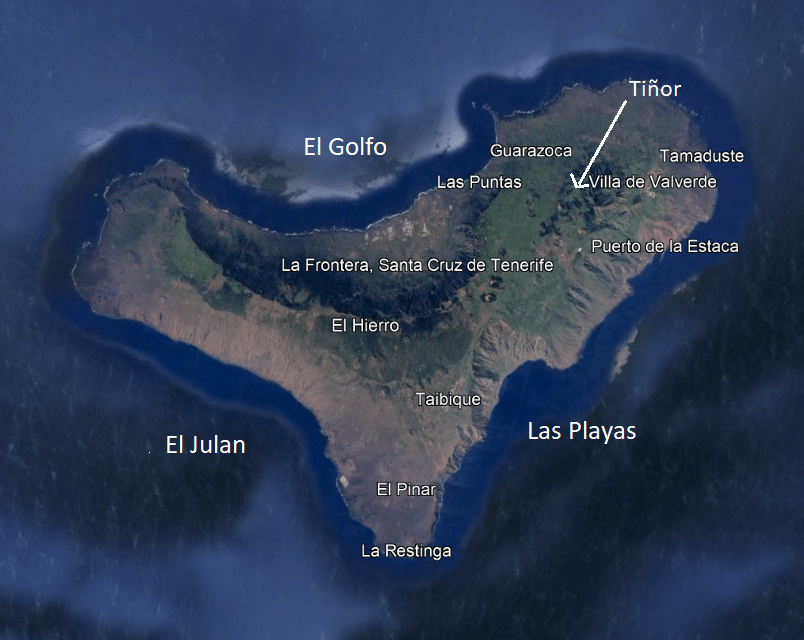
Fig 2: The island of El Hierro. Image captured from Google Maps, 2021. El Golfo, El Julan, Las Playas and Tiñor added by the author. The embayment of El Golfo can be seen as the cliffs encircling La Frontera.
Tiñor was the first subaerial volcano to emerge, comprising primitive basalts to trachybasalts and tephrites. It is dated between 1.2 – 0.88 million years old, having developed rapidly in the Lower and Middle Pleistocene. It has three units: the lowest unit with steep sides and thin steep-dipping lava flows; a middle unit of thicker lavas; and, an uppermost unit, the Ventejis Group, with craters After the emergence of the Ventejis Group, the north western flank of Tiñor suffered a large gravitational collapse which may have taken out more than half of the Tiñor edifice.
The El Golfo volcano emerged c. 545,000 years ago, located near the current town of Frontera. This volcano has two identifiable layers: a lower unit made up of basalt Strombolian and Surtseyan pyroclasts with dykes implying the presence a triple rift system; and, the upper unit made of lava flows, overlain with trachybasalts and trachyte lava flows and block-ash deposits. The youngest lavas are the trachyte, aged at c. 176,000 years. Gravitational collapse of the southwestern flank of the volcano occurred at El Julan.
The San Andrés fault system on the north east rift developed between 545,000 -176,000 years ago. The presence of cataclasites and pseudotachylytes, rocks typically found in the early stages of volcanic collapse indicate that there was incipient gravitational collapse that did not develop further. Cataclasites are formed through faulting or fracturing in the upper crust. Pseudotachylytes may be formed by frictional melting of the wall rocks during rapid fault movement during an earthquake.
The impressive El Golfo embayment resulted from gravitational collapse of the El Golfo volcano. This may have occurred in a single or multiple events. One possible is scenarios is that an initial subaerial lateral collapse of the volcanic edifice occurred 130,000 years ago and a second one occurred 17,000 – 9,000 years ago affecting the submarine lava platform.
Rift volcanism, defined as when the three arms of the rift were active at the same time without a central vent, occurs along the three arms of the island, with vents occur along the ridges of the rifts. Before the 2011-2012 eruption, rift volcanism had been dated to between 134,000 years ago to 500BC. GVP lists 6 eruptions prior to the 2011-2012 eruption: 3 confirmed in 550BC, 950BC and 4790 BC; and, 3 unconfirmed in 1793, 1692 and 1677. The associated lavas are alkaline picro-basalts, basanites and tephrites.
2011 -2012 Submarine Eruption
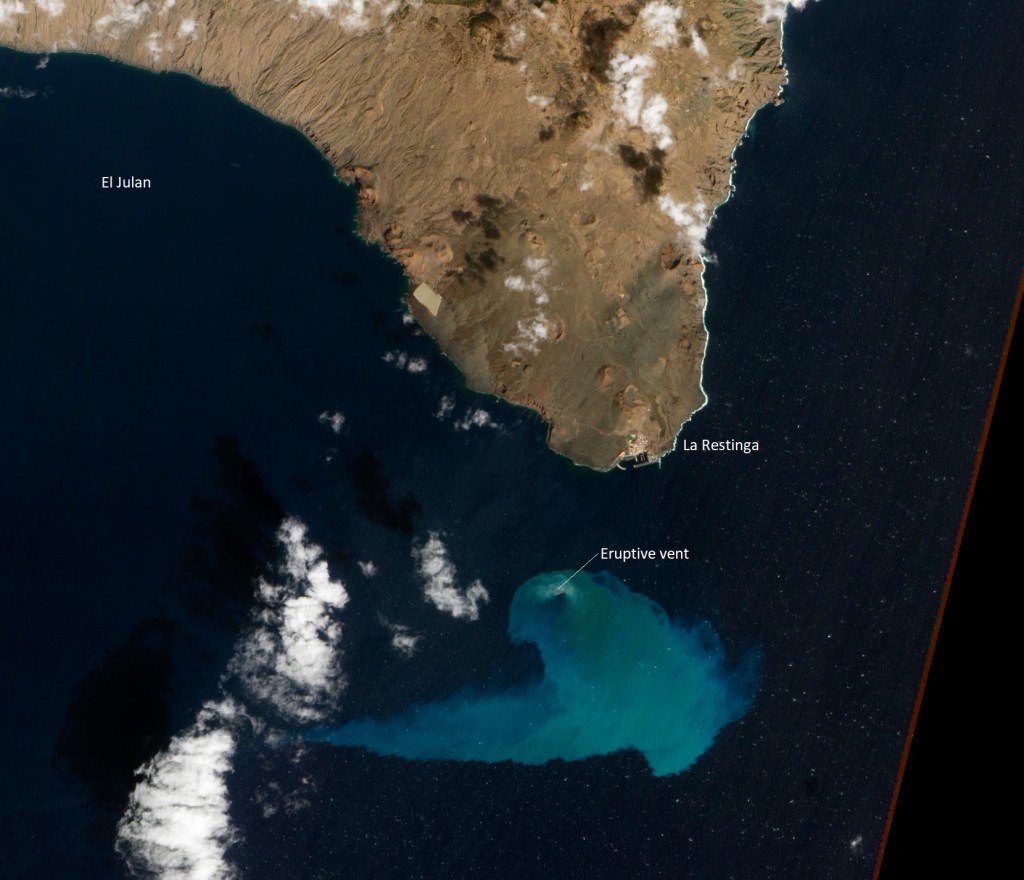
Fig 3: Stain from the submarine eruption south of the island. Image cropped from NASA Earth Observatory EOSDIS on 10 February 2012. Source: El Hierro Submarine Eruption (nasa.gov). “El Julan” and the “Eruptive vent” added by the autho
In 2011 a submarine flank eruption commenced, preceded by an intense seismic swarm. The submarine cone has been named Tagoro, from the Guanche language for meeting place or circular enclosure of stones.
Build up to the eruption
Before the eruption, El Hierro had been quiet since a seismic episode in 1793, which may or may not have been connected to an eruption. In the absence of eye-witness accounts then, it has been suggested that there was an eruption of Lomo Negro volcano, a submarine eruption or a magma intrusion.
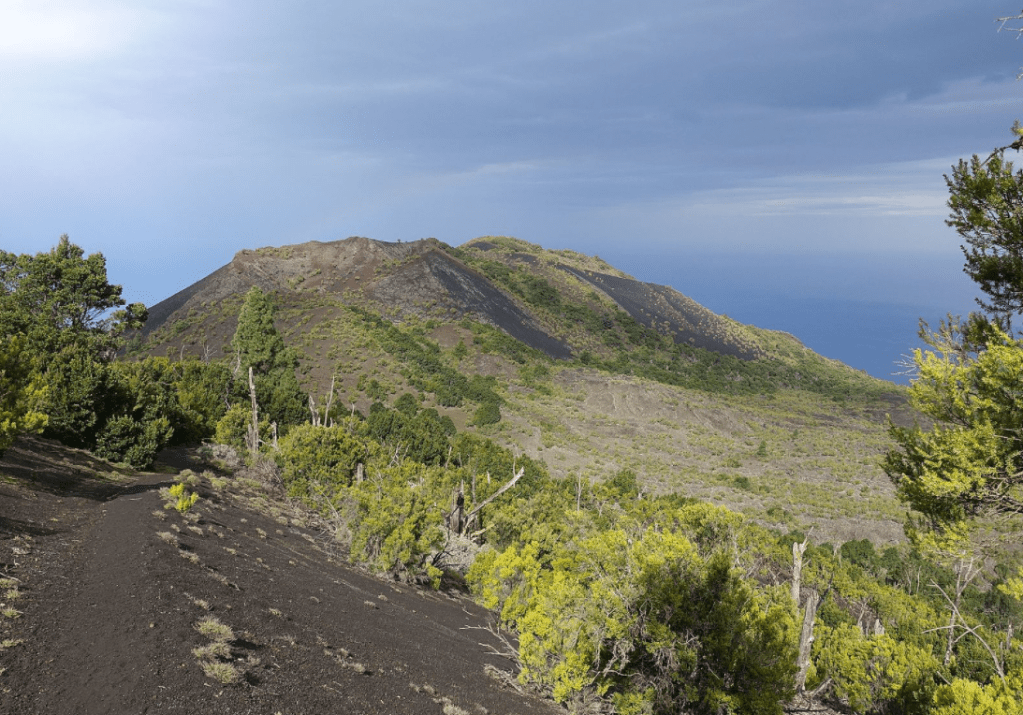
Fig 4: Crater of Tanganasoga. Image cropped from one by Areuland, 5th January 2017. published under CC BY-SA 4.0. Source: Wikipedia
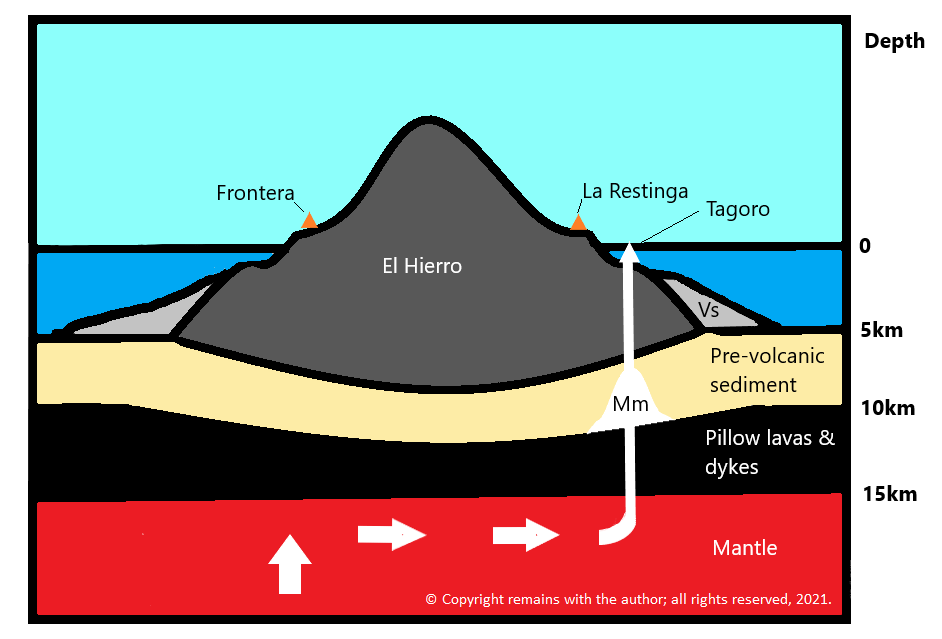
In July 2011, a seismic swarm started under El Golfo at a depth of 20-25km. Seismicity then ascended to 11±3km and headed southward across the island, after which it ascended to 3km between 8-9 October prior to the eruption on 10 October 2011. A 4.4M earthquake at a depth of 10km 1.5km south of La Restinga preceded the eruption. Magma had risen under Tanganasoga, the main volcano on El Hierro, to migrate south towards La Restinga.
Basanite fractionation and magma replenishment may have occurred during these seismic swarms while magma was being injected into the lower crust.
The eruption
The eruption occurred in phases.The lavas in the first phase were evolved basanites. The second phase was more primitive lava with 8-9 wt% MgO.
A harmonic tremor started on 10 October 2011 between 04:15 and 04:20 and is thought to indicate the start of the eruption. Magma had risen from the base of the ocean crust to the vent in c. 30 hours. Areas of discoloured, sulphurous-smelling water and dead fish were seen off the coast of La Restinga. Vigorous bubbling in the sea resembling a jacuzzi was observed above the vent, caused by gas emissions and heat from the vent; bubbling reached several metres high on occasion.
On 15 October 2011, lava bombs were observed. These comprised white to grey pumice encased in black basanite lava. Basanites are typical of the western Canary Islands. A small amount of U-depleted rhyolite was found in the lava bombs, though to have originated from differentiated trachyte incorporating quartz-rich sediment during melting when mobilised by the basanite. The boundary between old oceanic crust, continental crust and volcanic island may act as a magma trap where sediments can be assimilated. A few days later basanite lava balloons were emitted.
The second phase of the eruption started in November 2011 with seismicity at depths of 10-15km and a decrease in tremor intensity. This correlated with the eruption of more primitive lavas.
During November 2011, the eruption was confirmed as Surtseyan. Several plumes of material aligned N-S were visible from the air, confirming a fissure eruption. Tanganasoga experienced rapid inflation and released CO2. On 24th November a sulphur smell was reported in El Golfo. On 4th December 2011, vigorous phreatic bubbling (“the jacuzzi”) was observed. In December 2011, there was a temporary lull: the harmonic tremor and seismicity decreased.
The eruption picked up again in January 2012 with increased seismicity, a larger area of eruption and pumice clasts. In late February 2012, seismic activity, deformation and gas emissions decreased. The eruption was declared over in March 2012.
Tagoro’s cone was found to be 85m below sea level in April 2012. The eruption has been classified as a VEI 2.
Post eruption
Magma movements were detected from seismic swarms. In June 2012,accompanied by rapid inflation, magma moved south-westward towards El Julan-La Dehesa, northwest of the submarine vent. Earthquakes picked up again in September 2012 indicating magma movement under Tanganasoga.
The last reported seismicity was in March 2013 when another swarm occurred near the NW tip of the island, initially at 20km depth, migrating westward at a depth of 12-15km. The swarm was accompanied by inflation and CO2 emissions.
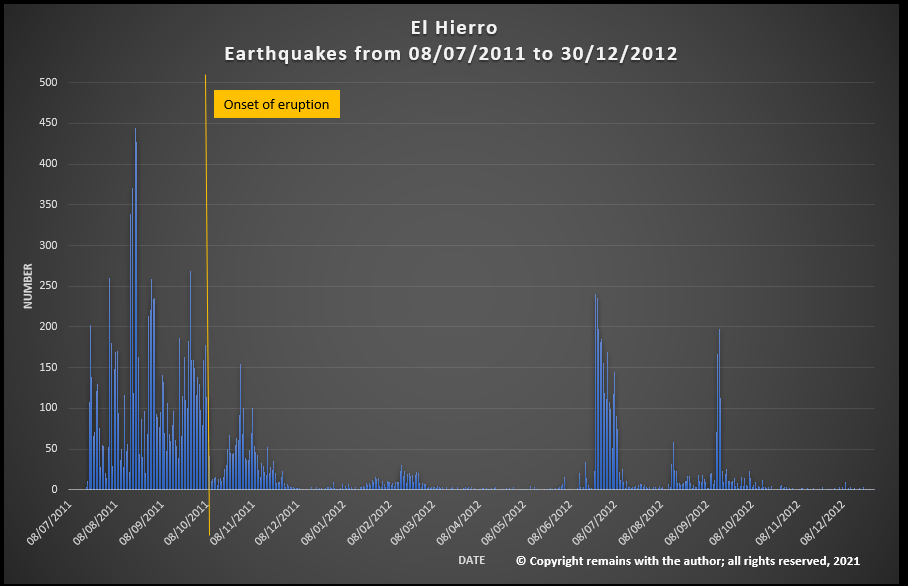
Plotting Seismicity
We have downloaded the earthquake data from IGN’s publicly available database and plotted the earthquake swarms for the period July 2011 to December 2012. The results are shown in the video below.
Only time, and a lot of work by the various scientists studying the eruption on La Palma, will tell how many similarities are shared between the two eruptions.
We are no longer updating this post; future updates will be included in new posts.
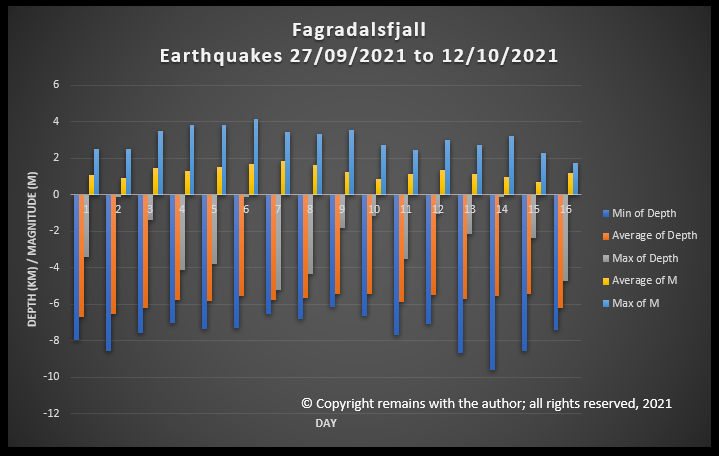
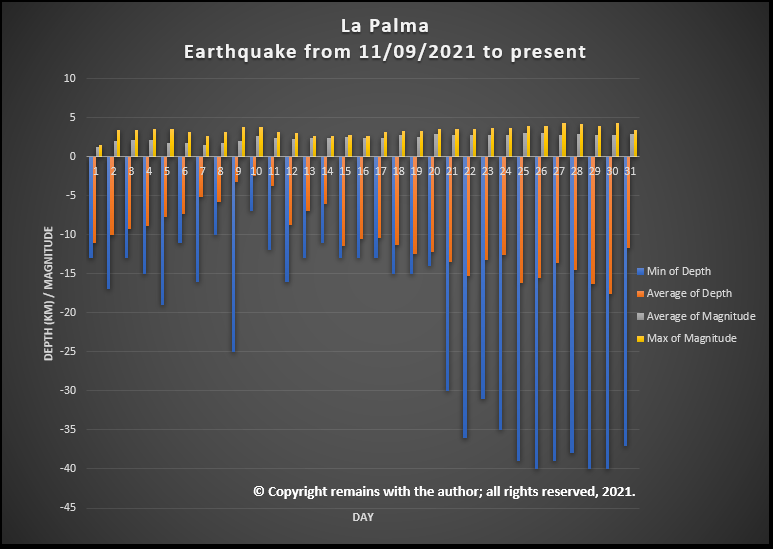
Update 2 12.10.2021: Plots of the Earthquake Swarm SSW of Mount Kelir, 27/09/2021 to Date
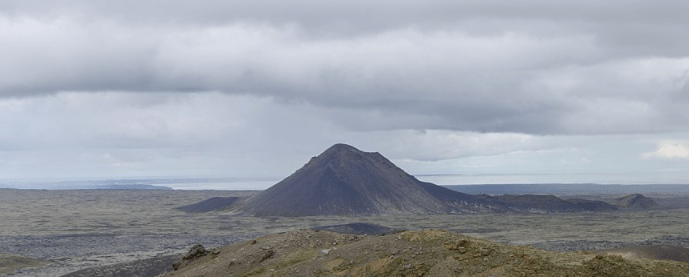
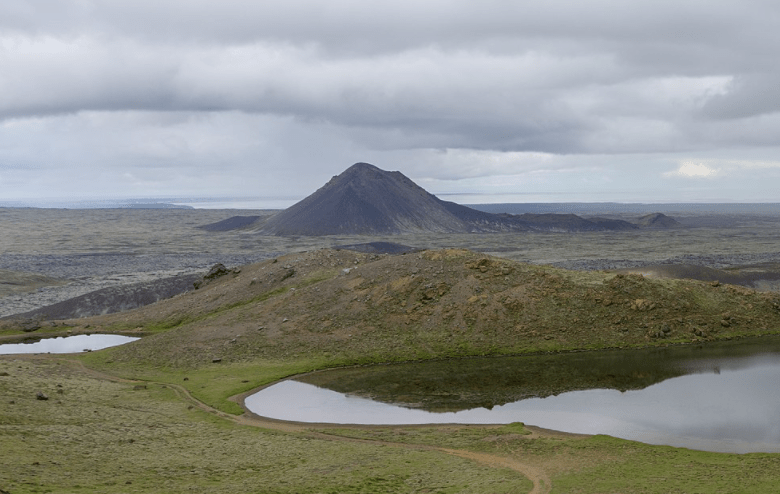
Fig 16: Mount Kelir, cropped from an image by Michal Klajban, published under CC BY-SA 4.0. Source: Wikimedia Commons
Mount Kelir is at the northern end of the earthquake swarm which started on 22 February 2021. In that swarm, earthquakes started near Mount Kelir and migrated towards and beyond Fagradalsfjall prior to the eruption at Geldingadalir on 19 March 2021.
The current swarm which started on 27 September 2021 near Mount Kelir is ongoing at the time of writing. Over 10,000 earthquakes have been recorded, of which IMO have confirmed c. 1,245. It is thought that an eruption may ensue near Mount Kelir.
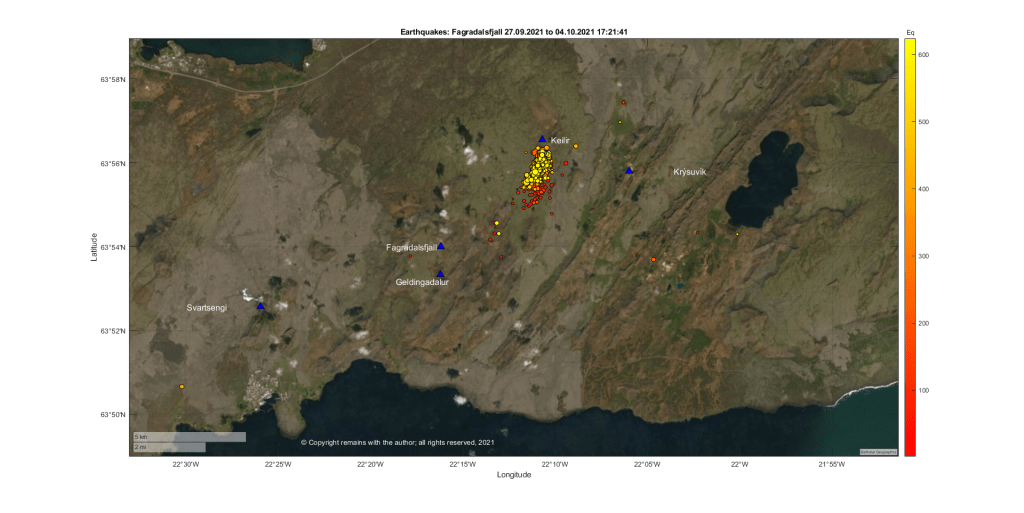
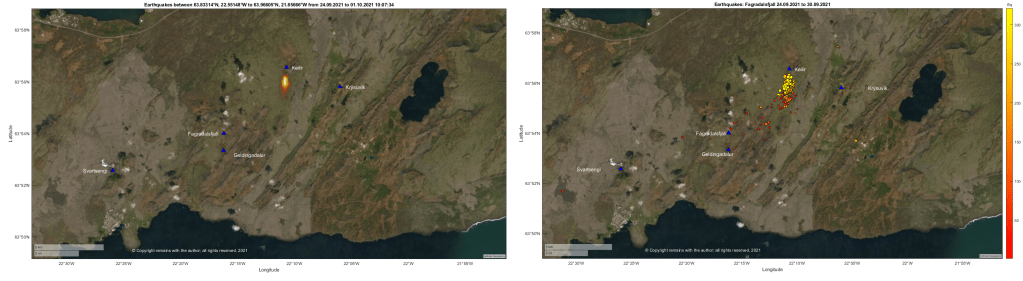
We have plotted the earthquakes and made a video of the geoscatter and scatter plots.
Whether or not a new eruptive site emerges, magma migrates to the existing site at Fagradalsfjall, or, it all quietens down, only time will tell. At the moment the swarm is migrating SSW.
Source for raw earthquake data: Icelandic Met Office: IMO
12.10.2021 1: Update on La Palma Seismicity
Good Morning!
Let’s take look at status of the eruption and seismicity at La Palma.
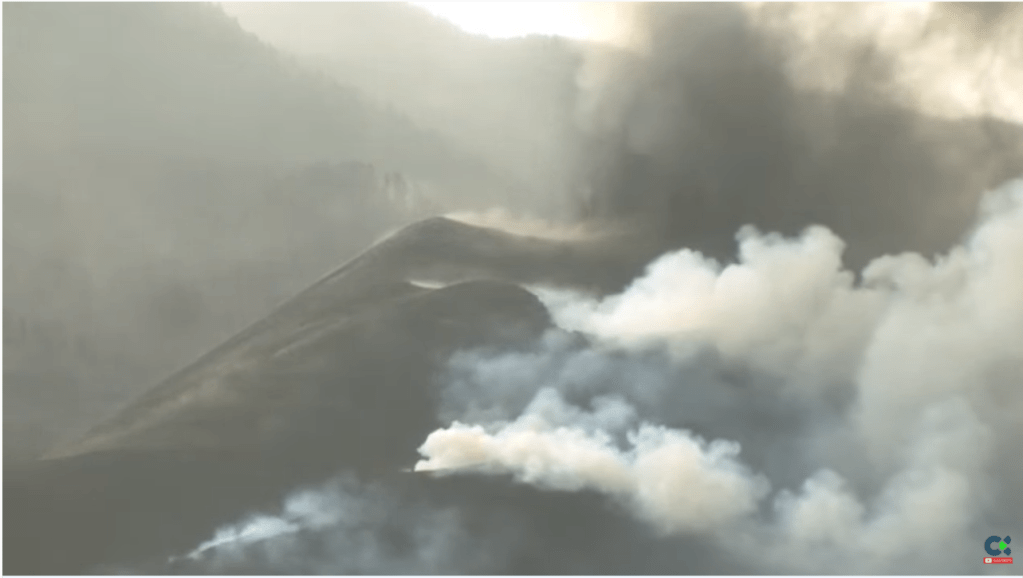
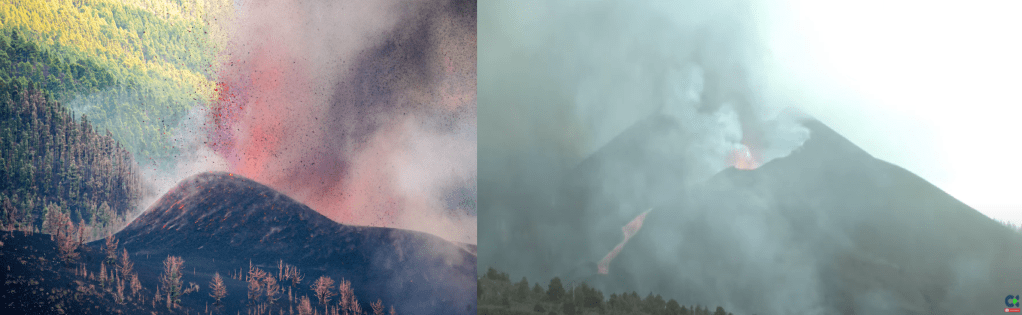
The eruption is still going strong. The cone has grown substantially, despite partial collapses.
Fig 11: Cone growth. On the left, the new cone on 20 September, 2021, cropped from an image by Eduardo Robaina, published under CC BY-SA 3.0; on the right, screen shot earlier today from RTVC
The following was reported earlier today:
The lava reached the cement works, Callejón de la Gata, today. Local residents were confined to their homes due to the risk of toxic fumes from burning chemicals.
A large volume of lava was emitted after the wall of the lava lake [cone?] was destroyed.
The northern arm of the lava flow is now 300 metres from the sea and expected to make a new lava delta near the beach of Perdido.
591.1 hectares have been affected by lava. This includes 132 hectares of crops , of which 70 hectares were banana crops; 33 hectares vineyards; and, 8 hectares avocado crops.
The maximum width of the lava flow is 1,520 metres.
1,281 buildings have been impacted, of which 1,186 have been destroyed.
The lava delta is now 34 hectares.
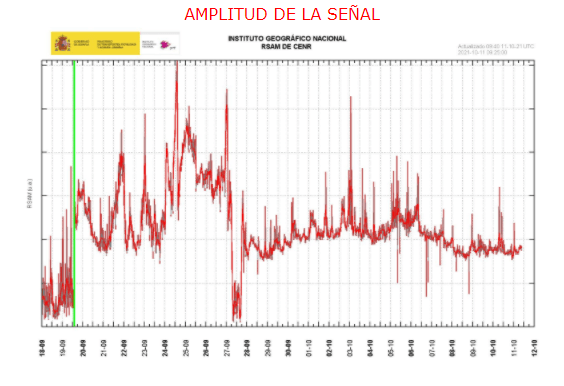
Seismicity remains high. To date, over 35,000 earthquakes have been recorded. The most recent earthquakes remain below 10km, with depths reaching more than 20km.
The high level of seismicity is thought to indicate rising magma because there have been spasmodic tremors and a strong volcanic tremor at 18 Hz; the latter may be from depressurisation of magma at a depth of c. 10km. In the absence of increased ground deformation, it is not known when or how magma may reach the surface. If it reaches the surface, it may follow the current conduit or emerge at new fissures.
Fig 12: Amplitude of seismic signal, source: IGN. Green line denotes onset of the eruption.
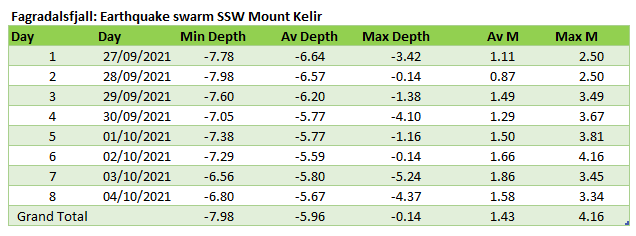
04.10.2021: Update Fagradalsfjall Seismic Swarm near Kelir
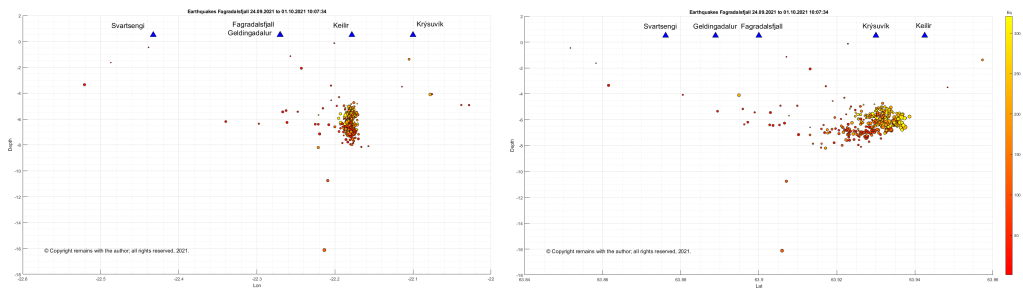
The swarm near Mount Kelir is ongoing. IMO report that 6.200 earthquakes have occurred in the swarm, although c.624 have been confirmed at the time of writing (Sources: IMO_Earthquakes and Skjálfta-Lísa (vedur.is)).
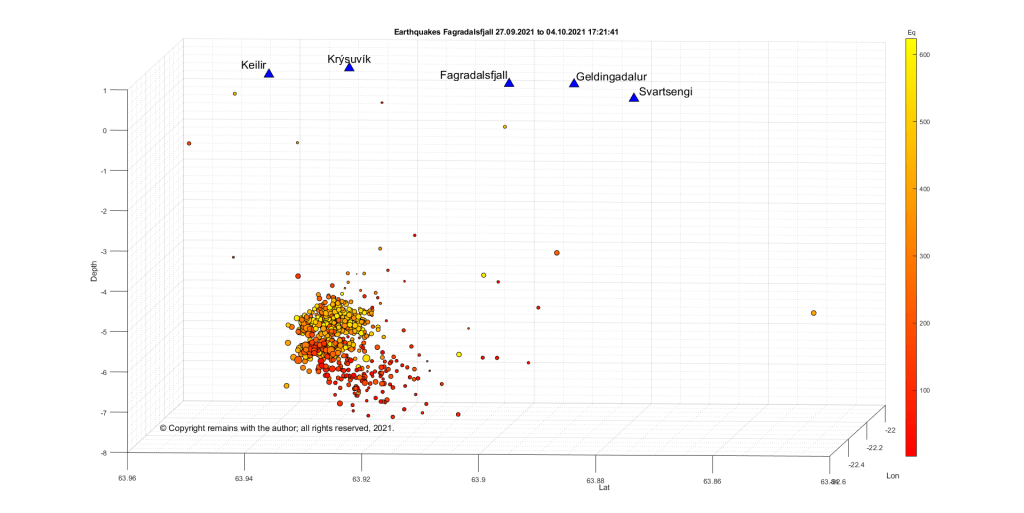
We have analysed and plotted the swarm. It would appear that the swarm is ascending but still in the crust. The largest earthquake with a magnitude of 4.16 had a depth of 5.669 km.
Good Morning! Today we provide an update on Fagradalsfjall, Cumbre Vieja (with video of earthquake swarms) and Askja.
Fagradalsfjall, Iceland
Fig 1: Mount Kelir, cropped from an image by Michal Klajban, published under CC BY-SA 4.0. Source: Wikimedia Commons
Fagradalsfjall celebrated the six-month anniversary of the start of the eruption, which occurred on 19 March 2021, by taking a break. Low level activity has been observed since 18 September 2021.
An earthquake swarm stared on 27 September 2021 south of Mount Kelir. This is located near the northern end of the earthquake swarms earlier this year which preceded the eruption at Geldingadalir.
We have plotted the swarm to see what is going on.
While it is not clear what the cause of the swarm is (new magma or the crust adjusting to changes in tension), people are advised to avoid the area for the time being. If an eruption does occur near Kelir, it is expected to be similar to that at Fagradalsfjall. The aviation code is still orange.
Cumbre Vieja, Canary Islands
Fig 3: Cumbre Vieja eruption on 20/09/2021, cropped from an image by Eduardo Robaina, published under CC BY-SA 3.0. Source:Wikimedia Commons
The eruption is still going strong. The vents have produced ash columns, jetting lava and effusive lava flows.
Lava reached the sea, following the opening of a new vent earlier this week, which emitted more effusive lava. The lava travelled at 300 m/hr, crossing the coastal road and cascading over 100m high cliffs at Los Guirres. The lava is forming a delta, which has reached an impressive size 21 hectares.
There are now four eruptive vents: a new effusive vent opened 400m north of the main vent on Thursday; and, two more opened on Friday 15 metres apart and 600m north west of the main cone. Lava from Thursday’s new vent also made it to the sea via a flow parallel to the original one. A fumarolic field has developed on the north side of the main vent.
Over 80 million cubic metres of lava have been erupted. Sadly, this has damaged 1,005 buildings, of which 870 have been destroyed. 30.2km of road has been impacted, of which 27.7km have been destroyed. Ash now covers 3,172.9 hectares of land.
SO2 levels are higher but not considered a risk for the population at the moment.
Earthquakes are occurring near the area start of the swarm which preceded the eruption. They are deeper than the earlier swarm leading to concern that lava may be fed from a deeper reservoir. We have plotted the current swarm and previous swarms from 2017 to date.


_julesvernex2.jpg)
.svg)