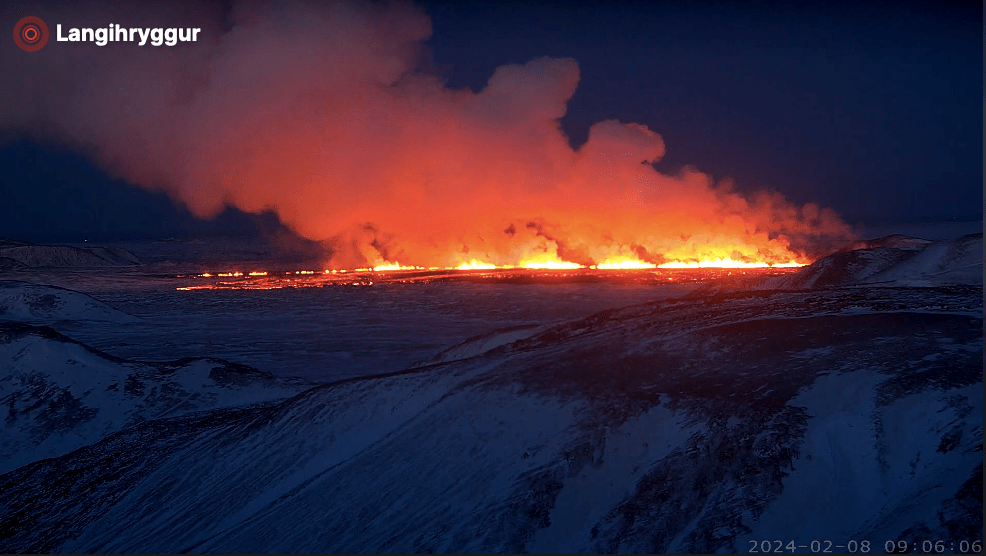
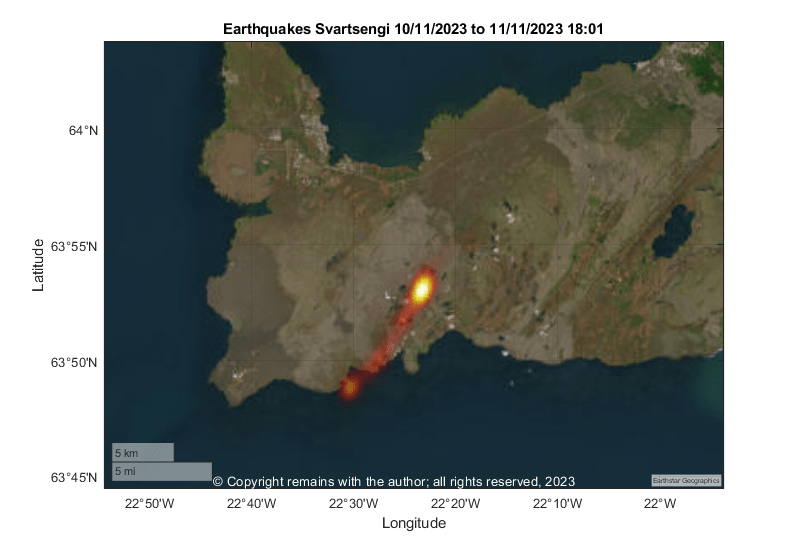
The eruption start early this morning at 6am with a 3km long fissure near to the location of the 18th December 2023 eruption. Lava is flowing westwards.
At the time of writing there is no immediate threat to Grindavík the Blue Lagoon or Svartsengi Power Plant. No-one is thought to have been in Grindavík when the eruption started; the Blue Lagoon was evacuated successfully. It will be some time before lava may reach the protective walls round Grindavík.
The eruption started with little notice. The precursors were an earthquake swarm which started 30 minutes before at 5:30 am and around ten minutes later pressure changes in bore holes at the power plant were noted.
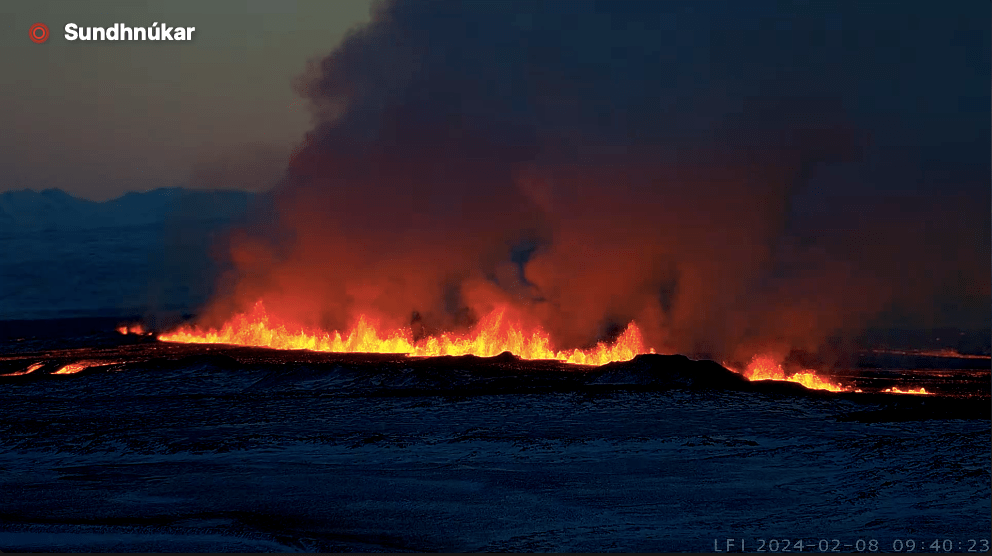
The eruptive mechanism is similar to the two previous eruptions. Magma flows into the channel and then erupts with jets of lava. Lava fountains are currently reaching 80m height and the plume rises to 3km.
Inflation has been continuous at Svarsengi since the December 18th eruption. It is too soon to see what effect thus eruption has had on local ground deformation.
The earthquake swarm is continuing as we write, although he magnitude of earthquakes has reduced. As the uncertainty continues, our thoughts are with those required to evacuate Grindavík, those supporting them, the Department of Civil Defence, and the scientists and others monitoring the activity.
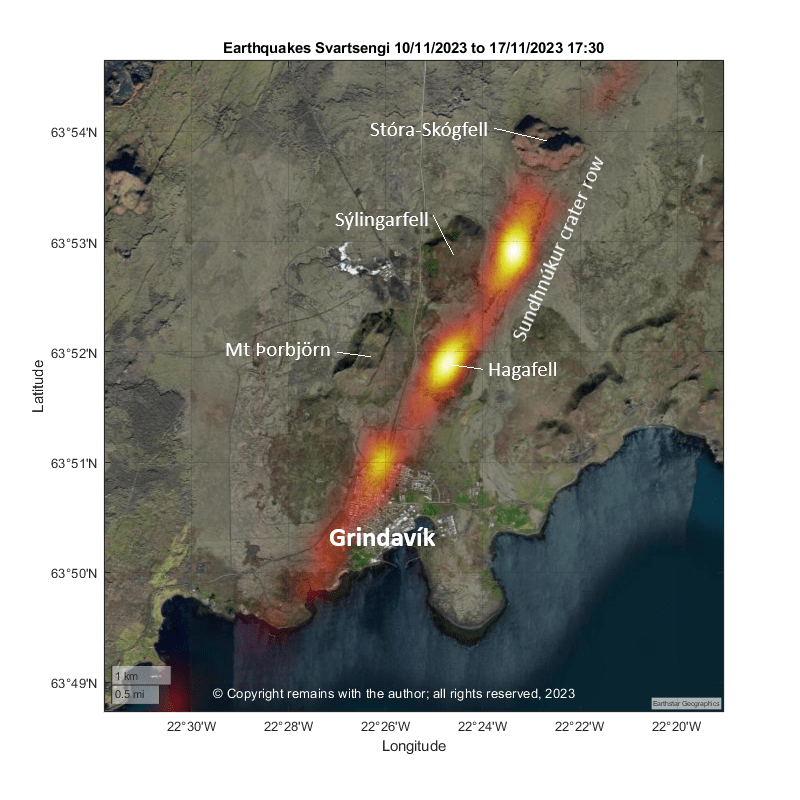
According to IMO, ground deformation is continuing at a slower rate. It is thought that if an eruption occurs, it is most likely to be in the region of Hagafell. Yesterday, sulphur dioxide was detected in a borehole at Svartsengi located north of Mt Þorbjörn. The borehole extends eastwards towards the Sundhnúkur crater row, close to the where the magma intrusion is. This is considered evidence of magma north of Hagafell. The possibility of an eruption is still considered high.
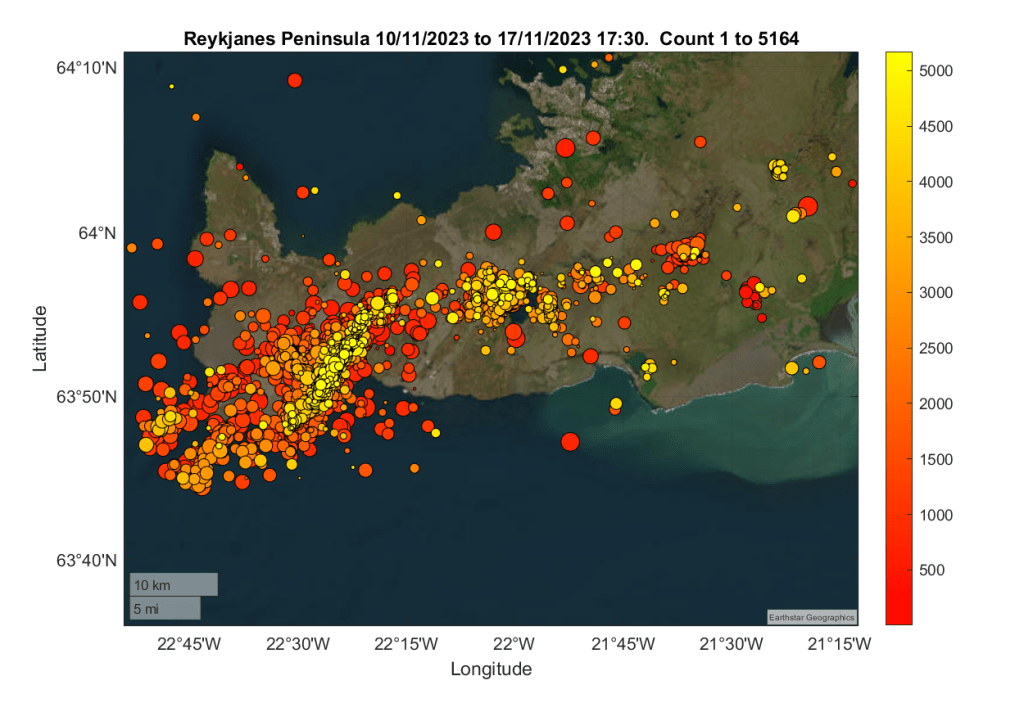
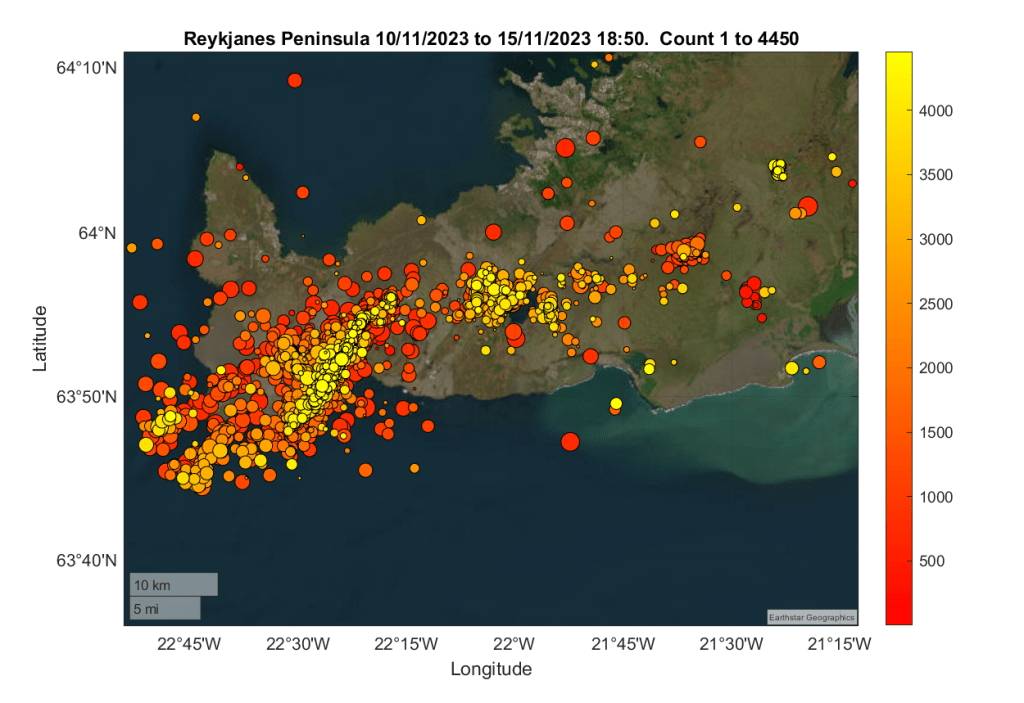
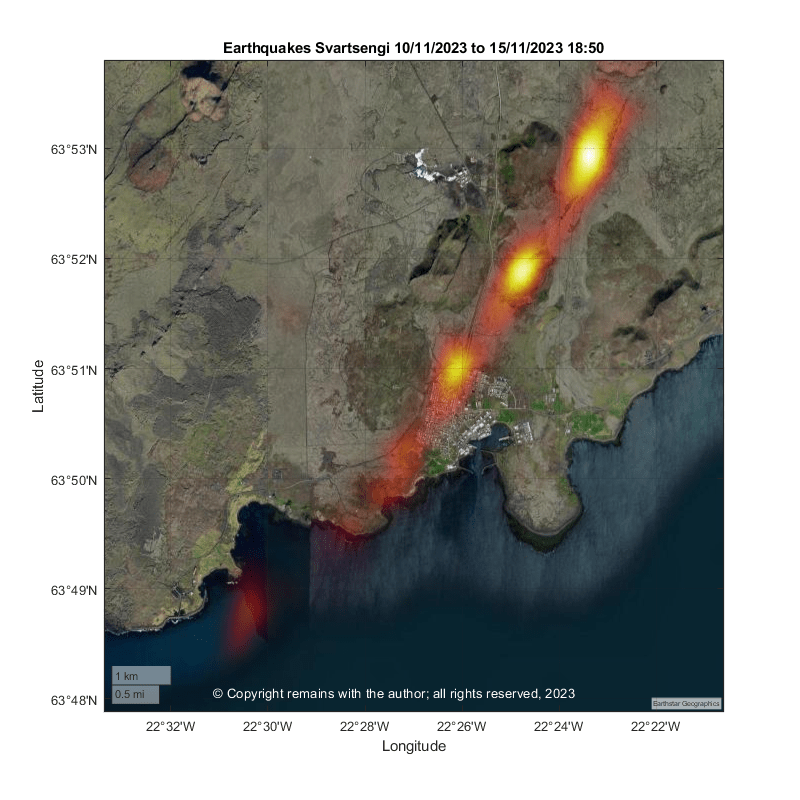
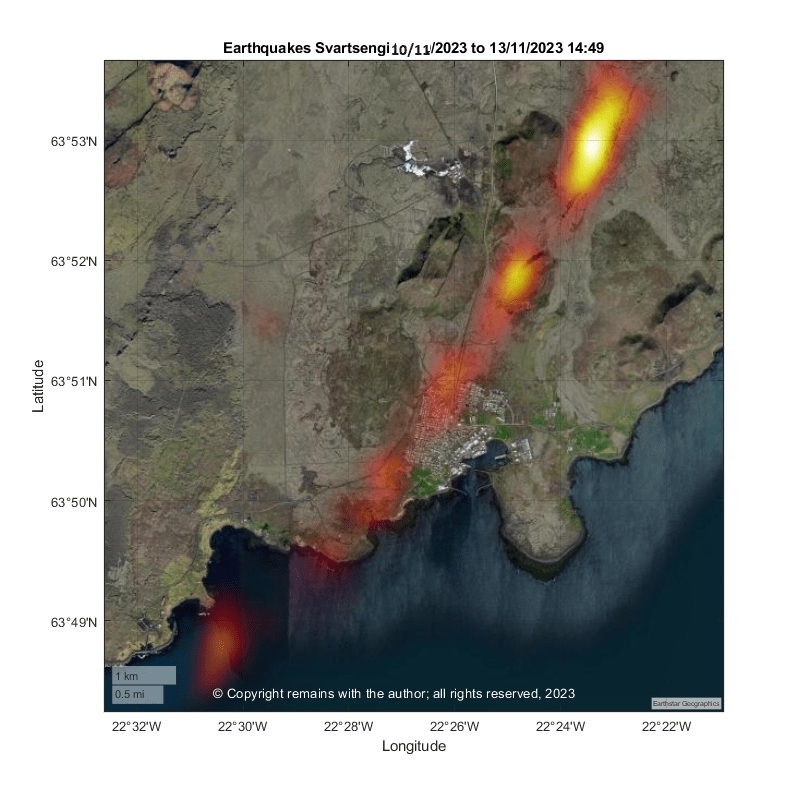
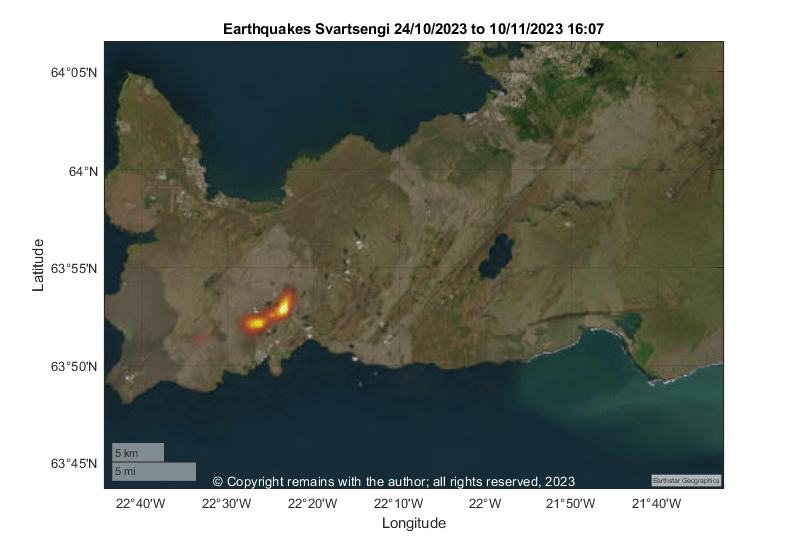
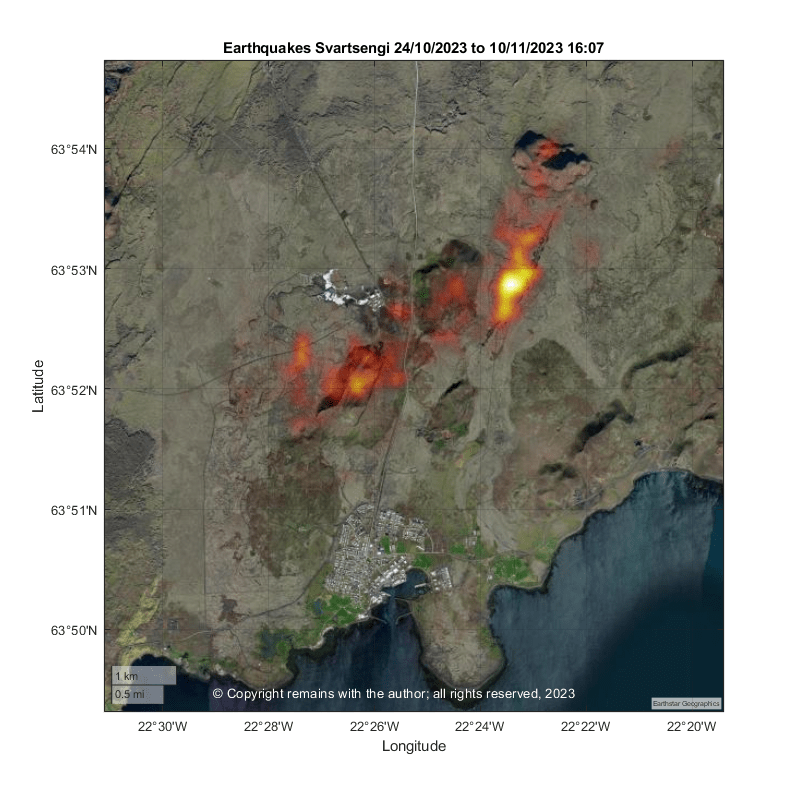
If we ccompare the locations to our geodensity plots (ref. Fig 31 below), the areas of most seismic activity are located at the Sundhnúkur crater row, Hagafell and northwest Grindavík. The geodensity plots are often good predictors of where an eruption will occur. However, with three current seismic hot spots, the situation is not clear at the moment. If an eruption occurs, the precise location(s) will depend on where weak spots allow magma through.
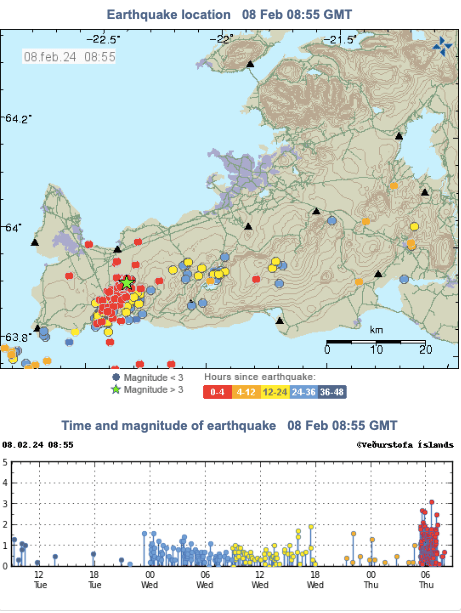
Our updated earthquake plots are below. The data source is as below.
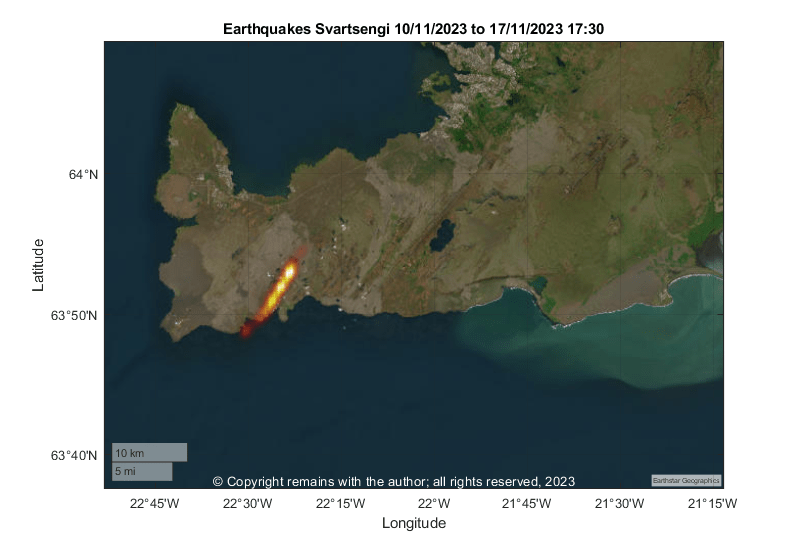
Seismic activity is occurring along the dike and also at Krýsuvík.
The earthquake swarm continues as we write. The intensity has lessened, and the size of the earthquakes decreased. The probability of an eruption is still considered high.
According to IMO, most monitoring is focussing on the dike formation and Grindavík. Ground deformation is consistent with magma flowing into the dike. Part of the magma may be solidifying at the edges of the dike. Magma inflow is thought to be near Sundhnúk. SO2 measurements show fluctuating degassing associated with the dike. Magma may have come within 500m of the surface. The sink hole which opened in Grindavík continues to widen.
We have updated our earthquake plots to 18:50 today.
The most recent earthquakes occur along the dike, and at Krýsuvík. We do not understand the relationship between Fagradalsfjall and activity further west, other we have observed than activity at Krýsuvík usually precedes activity west of it. Frustrating not to be a geologist!
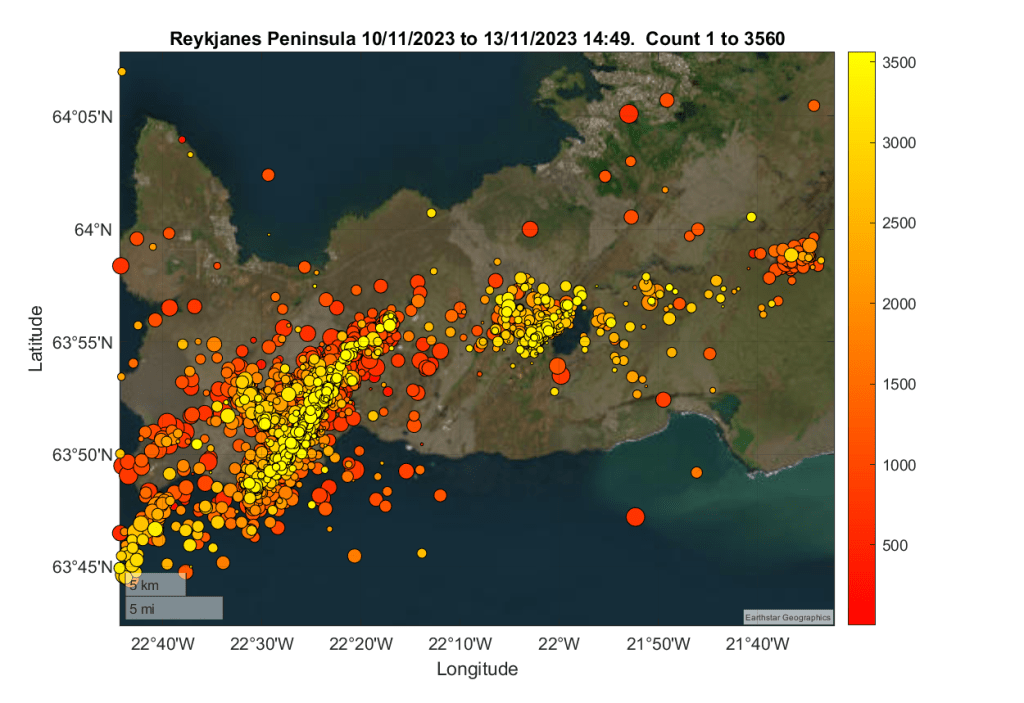
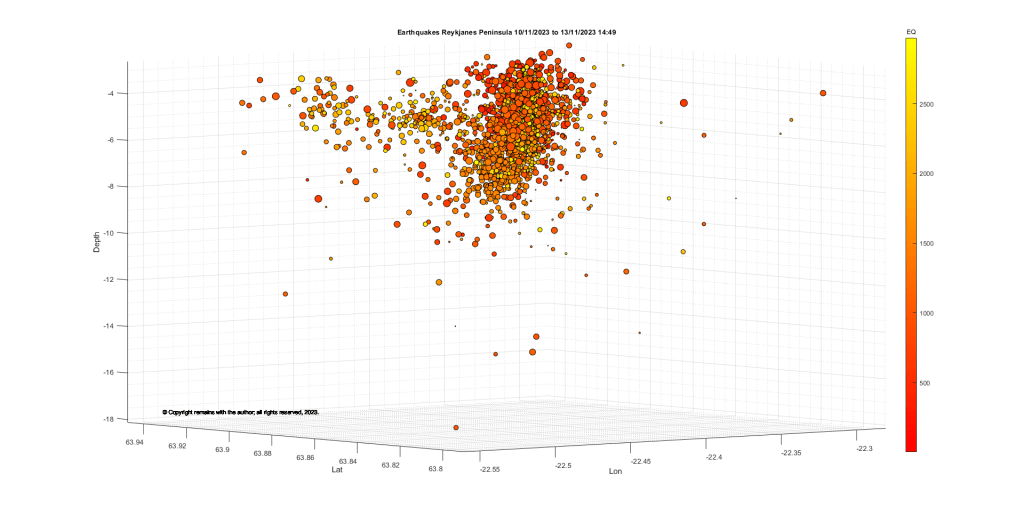
Correction: Fig 20 is for the period 10th November to 13th November (Error was in the image title, not the caption. The plot, itself, is unchanged). Apologies for any inconvenience.
The earthquake swarm continues as we write. The intensity has lessened, and the size of the earthquakes decreased, most probably reflecting the fact that magma has reached less brittle rock layers nearer the surface. Scientists have said the magma inflow has lessened, seismic activity is between depths of 2km and 5km but there is no change in the assessment of the likelihood of an eruption.
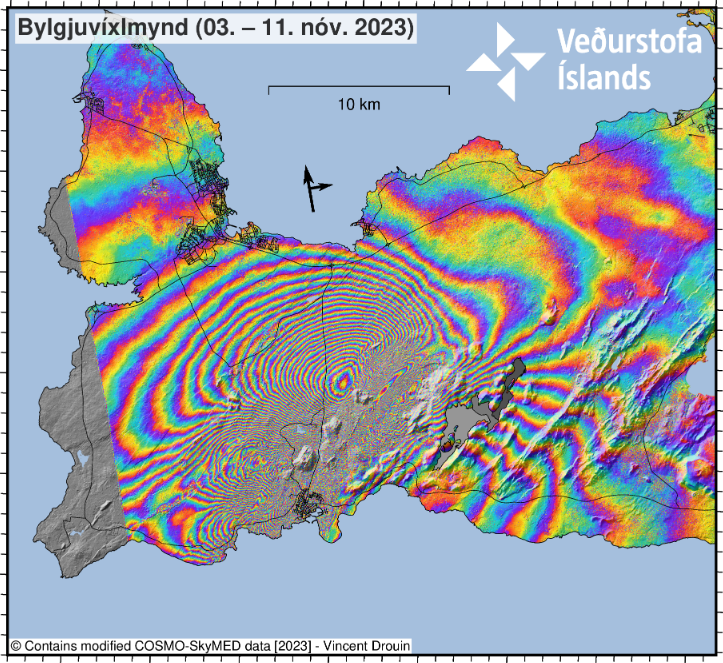
The InSAR image showing the formation of the possible graben running through part of Grindavík has been published on IMO’s site today. The sudden formation of the graben on Friday night led to the evacuation of Grindavík. Local news sources have images of the damage done to roads and property.
Fig 15: InSAR image showing ground displacement caused by seismic activity between 3rd November 2023 and 11th November 2023. Source: IMO
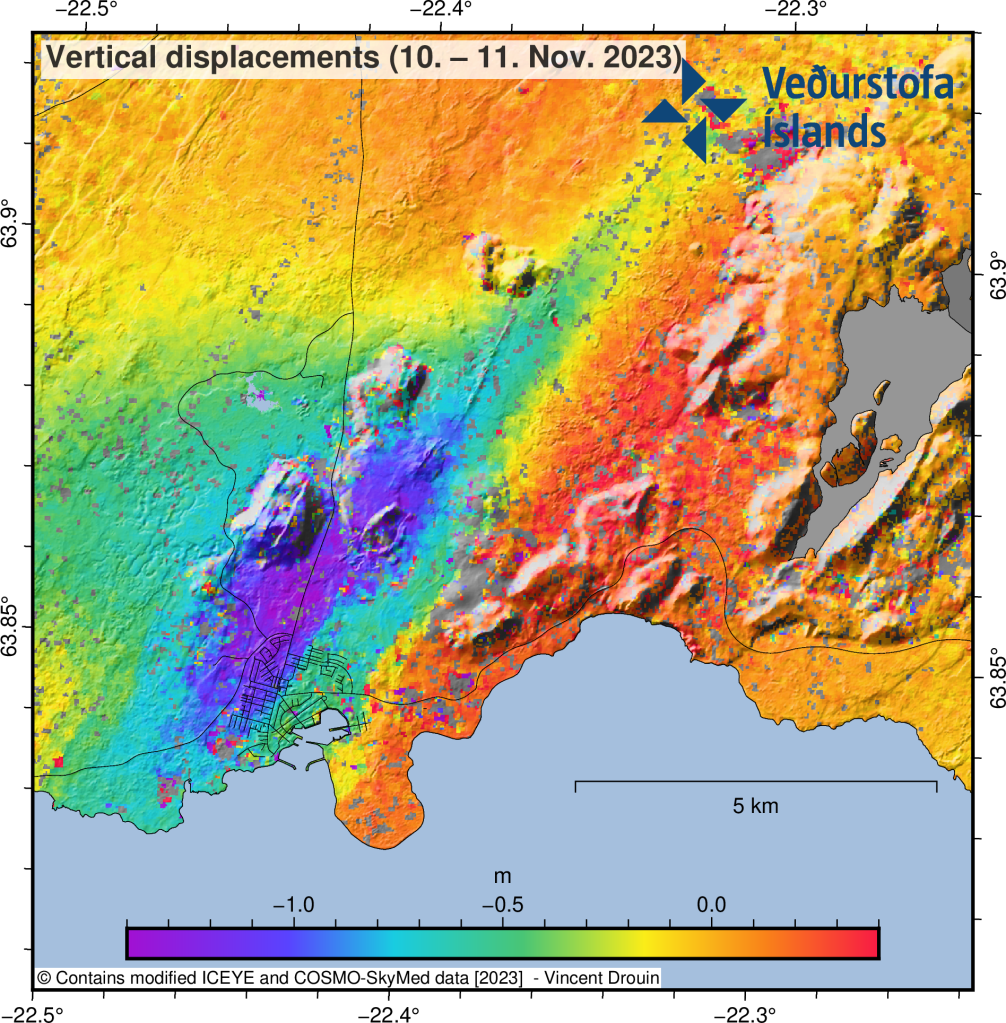
Fig 16: Estimate of the vertical displacements caused by the dike during its initial propagation from Friday afternoon to Saturday morning. The displacements were estimated by combining ICEYE and COSMO-SkyMed pixel offset tracking results. Source: IMO.
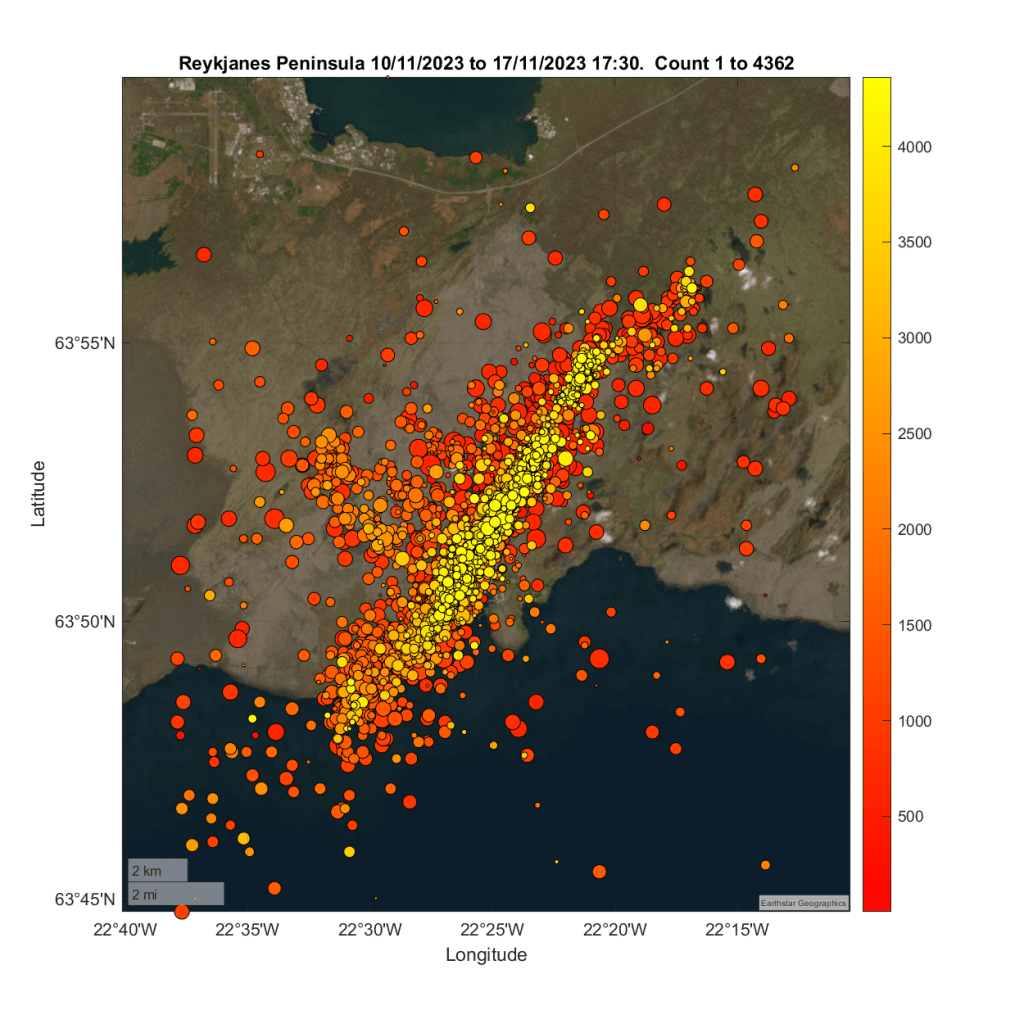
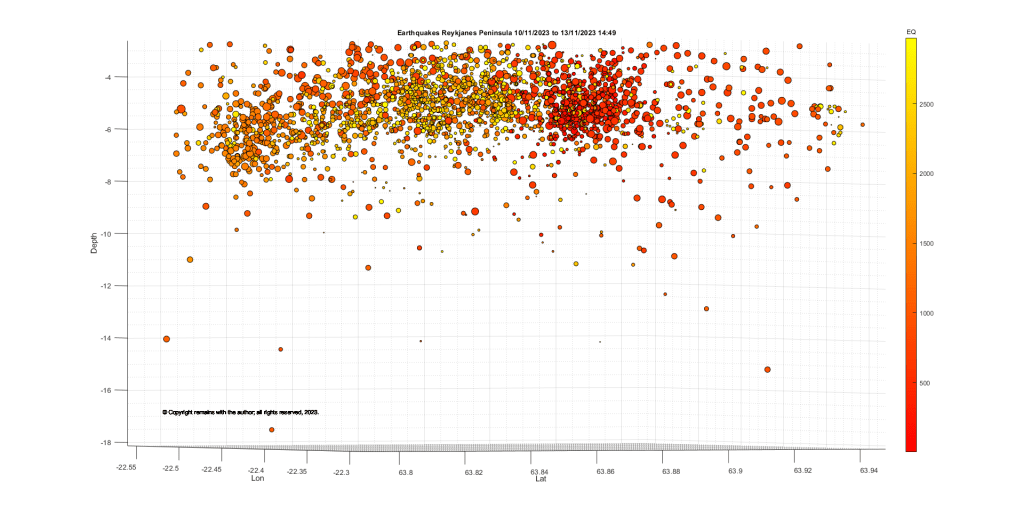
We have updated our earthquake plots for the swarm from 10th November 2023 to 13th November 2023 14:49. We used the earthquakes published on Whole Country (vedur.is) for the Reykjanes Peninsula with a quality of over 90%., a total of 3,560 earthquakes. We may have picked up some ghosts and other errors (confirmed earthquakes have a quality of 99%) but we believe that this will give a rough idea of what is going on.
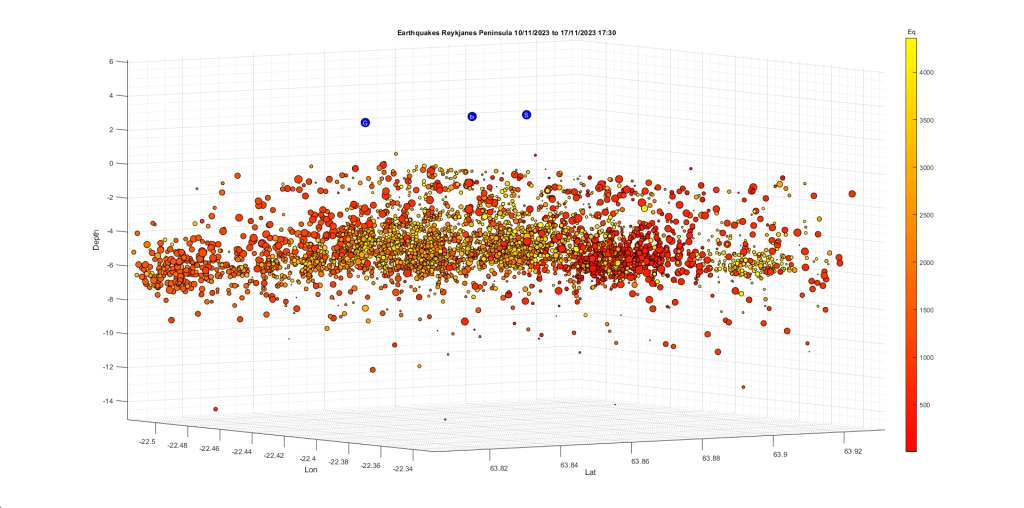
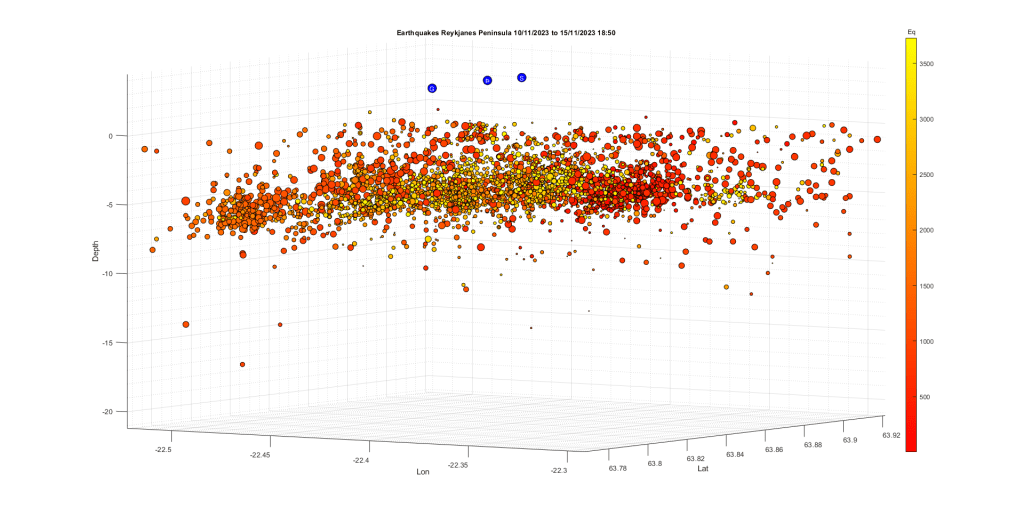
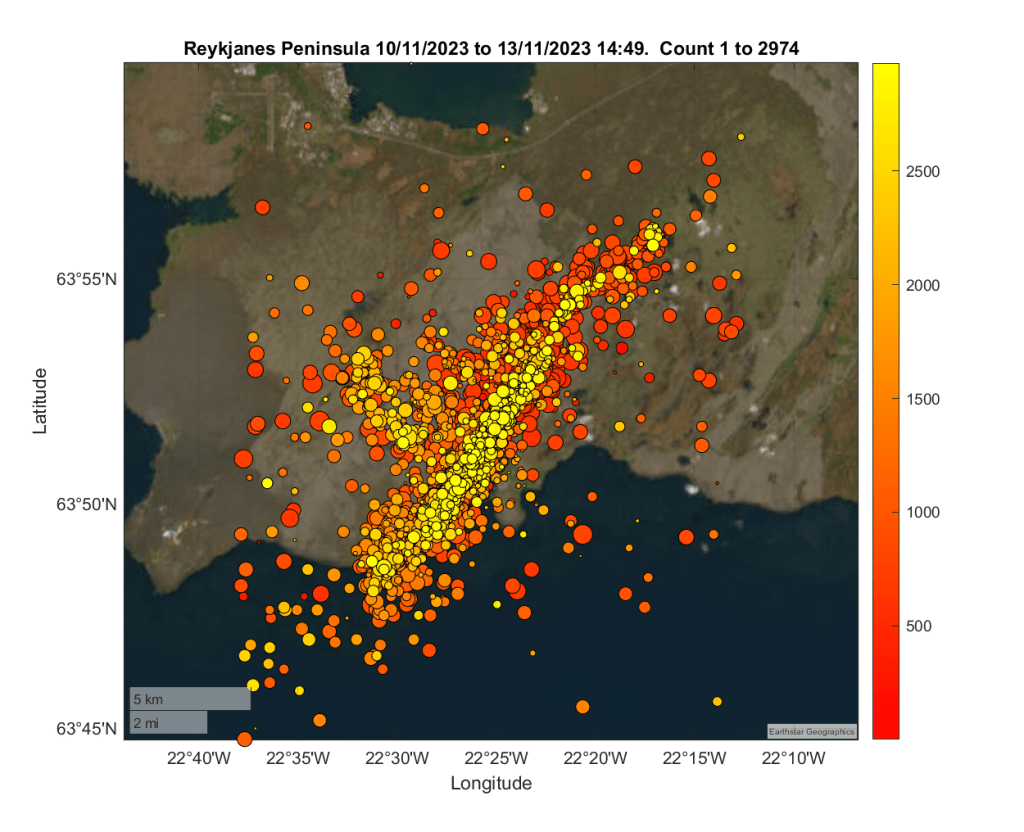
Our 3D scatter plots for the above seismic activity covered too big an area to look at the formation. We extracted earthquakes between 63.746°N, 22.211°W and 63.996°N, 22.631°W, a total of 2,974 earthquakes. For the 3D scatter plots only we removed a small earthquake with a depth of more than 40 km from the data set as it distorted the scale of the plots too much.
IMO reported this evening that there is a significant likelihood of a volcanic eruption in the coming days.
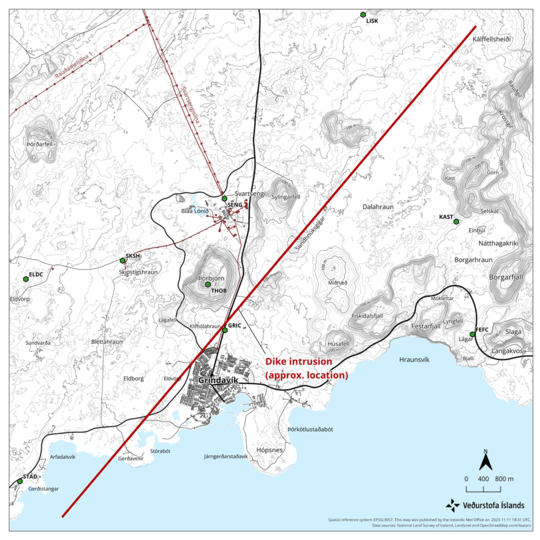
Modelling based on ground deformation and seismicity by scientists at IMO and the University of Iceland shows that there is a 15km long magma intrusion located northwest of Grindavík. The intrusion stretches from Kálffellsheiði, northeast of Grindavík, to offshore southwest of Grindavík.
Magma has ascended to 800m below the surface. Where and when an eruption will occur cannot be predicted now – other than to say that it would most likely be in the vicinity of the intrusion, if it occurs.
Fig 12 Map showing the location of the dike intrusion based on combined satellite radar imagery, GPS measurements, and geophysical modelling. Source: IMO
Since our original post below, events have moved on. The town of Grindavík was evacuated overnight when it became apparent that a dike could be forming under the town. The Svartsengi Power Plant will be operated remotely.
The swarm has continued relentlessly since yesterday.
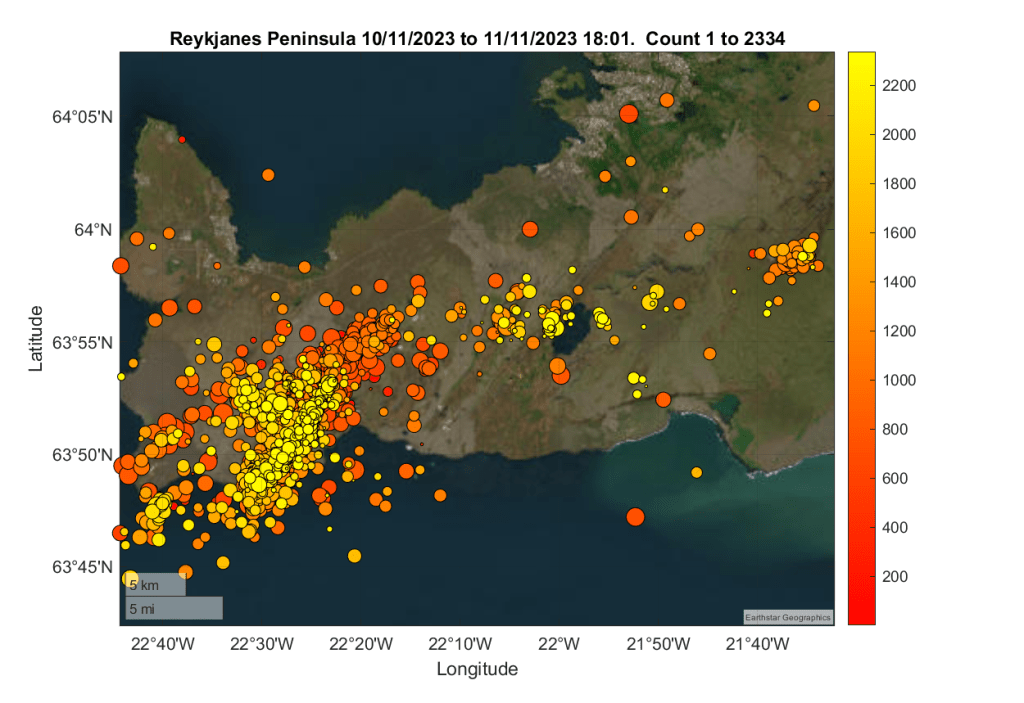
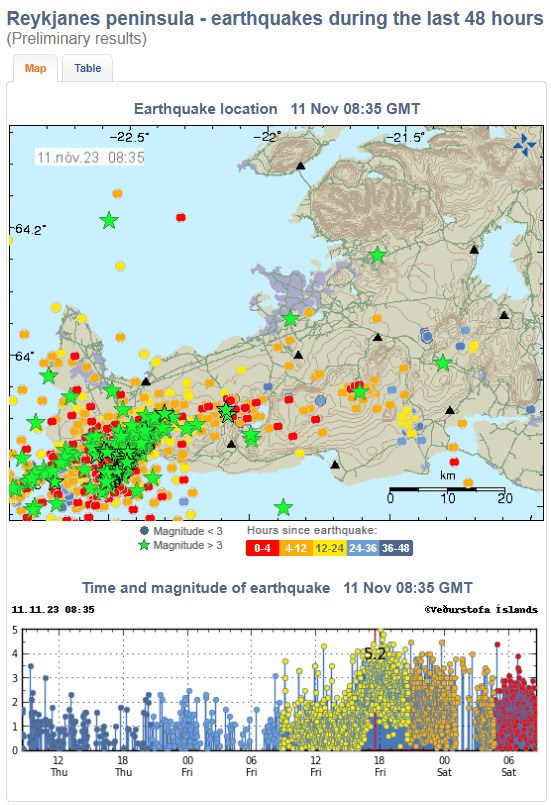
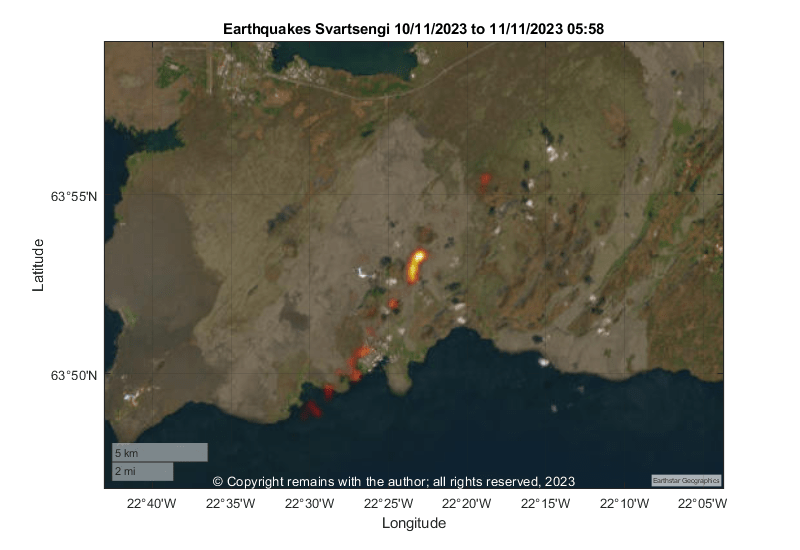
Fig 8: Earthquakes on the Reykjanes Peninsula. Note the activity is concentrated near Mount Þorbjörn; most of the outliers are ghost in the auto system. Source: IMO.
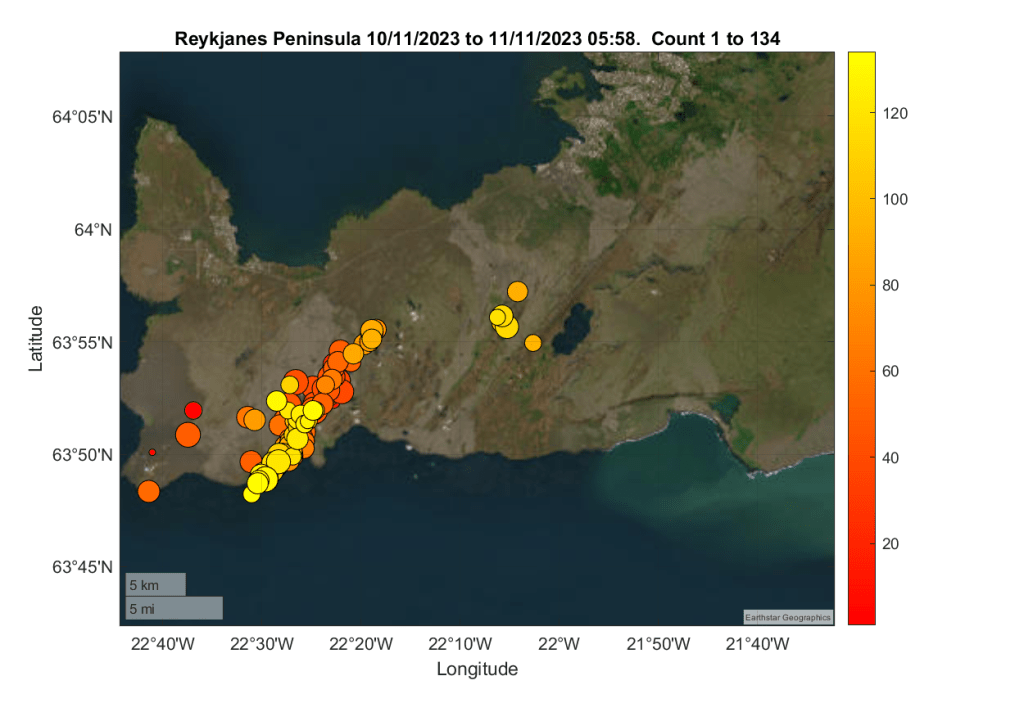
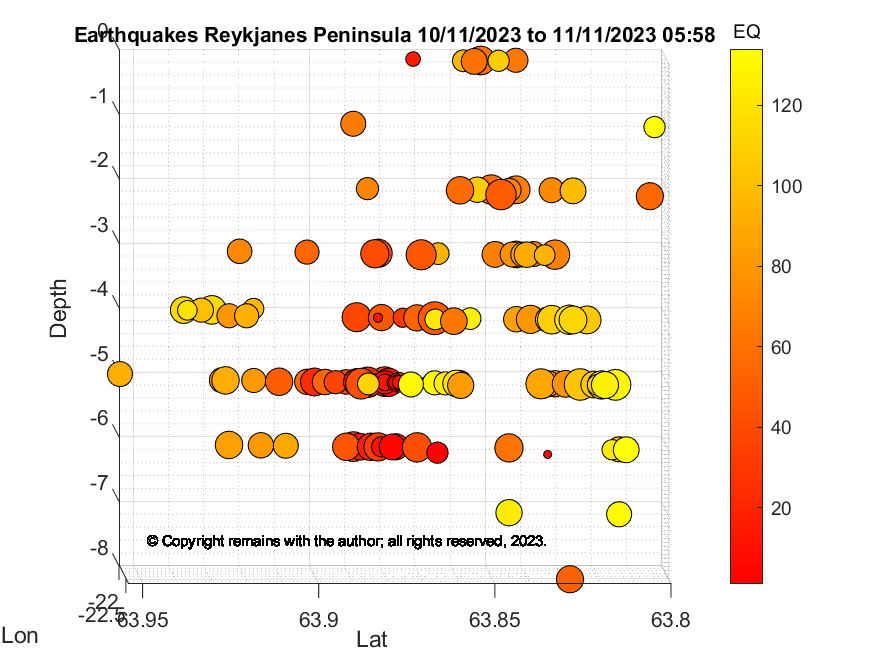
We have plotted the activity from 10th November 2023 to 11th November 2023 05:58 using the confirmed earthquakes reported on Skjálfta-Lísa (vedur.is), a total of 134 earthquakes. Our plots show the possible dike formation.
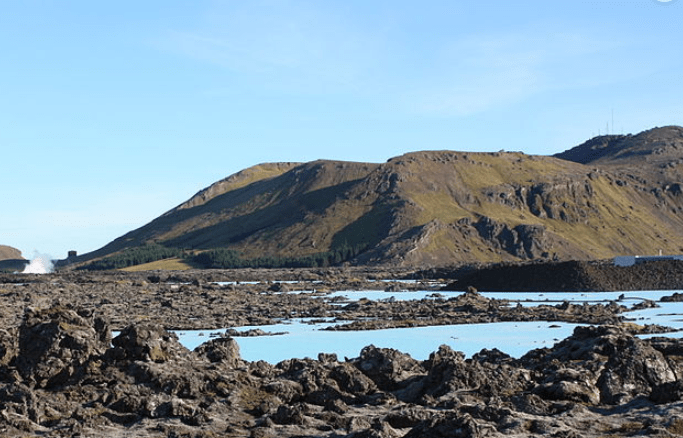
Fig 1: Image cropped from one by Arian Zwegers of the Blue Lagoon with Mt Þorbjörn. Published under CC BY 2.0
A large earthquake swarm started north of Grindavík, Iceland, on 24th October 2023 in the vicinity of the Svartsengi Geothermal Plant and Mount Þorbjörn. This is the fifth time such a swarm has occurred during the volcano-tectonic episode which started on the Reykjanes Peninsula in December 2019, including the three eruptions of Fagradalsfjall. Earlier today (10th November 2023), the swarm intensified. The aviation code for the Reykjanes – Svartsengi system has been raised to orange.
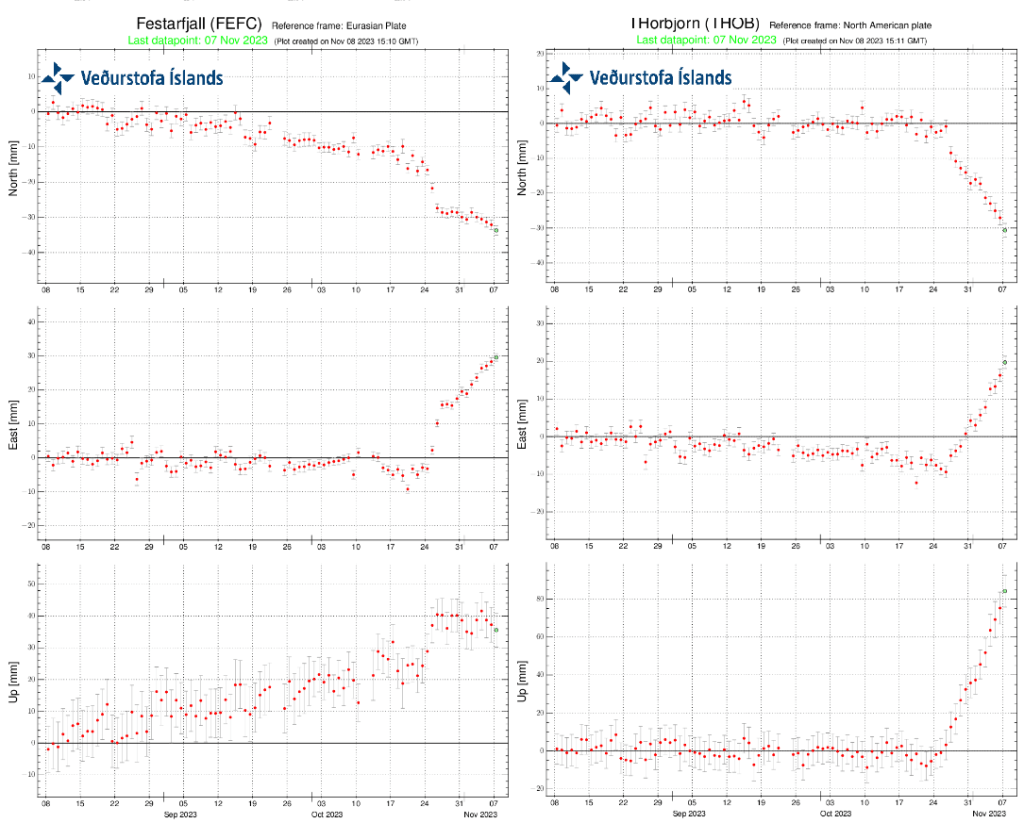
Because this activity started near Fagradalsfjall, it was initially thought that the swarm was caused by magma movement associated with Fagradalsfjall and the earthquakes to the west were triggered earthquakes (faults moving to accommodate the magma). This was born out by initial ground deformation showing at station FEFC, southwest of Fagradalsfjall. However, this has been followed by consistent uplift at the stations near Mt Þorbjörn, raising concerns that there is magmatic activity there. It is believed that magma is accumulating in a sill at a depth of 5km. Since then, there have been seven earthquakes with a magnitude greater than 4.0M in the area (as of 9th November 2023).
Fig 3: Time series for GPS stations FEFC and Thorbjörn to 9th November 2023. Source: IMO.
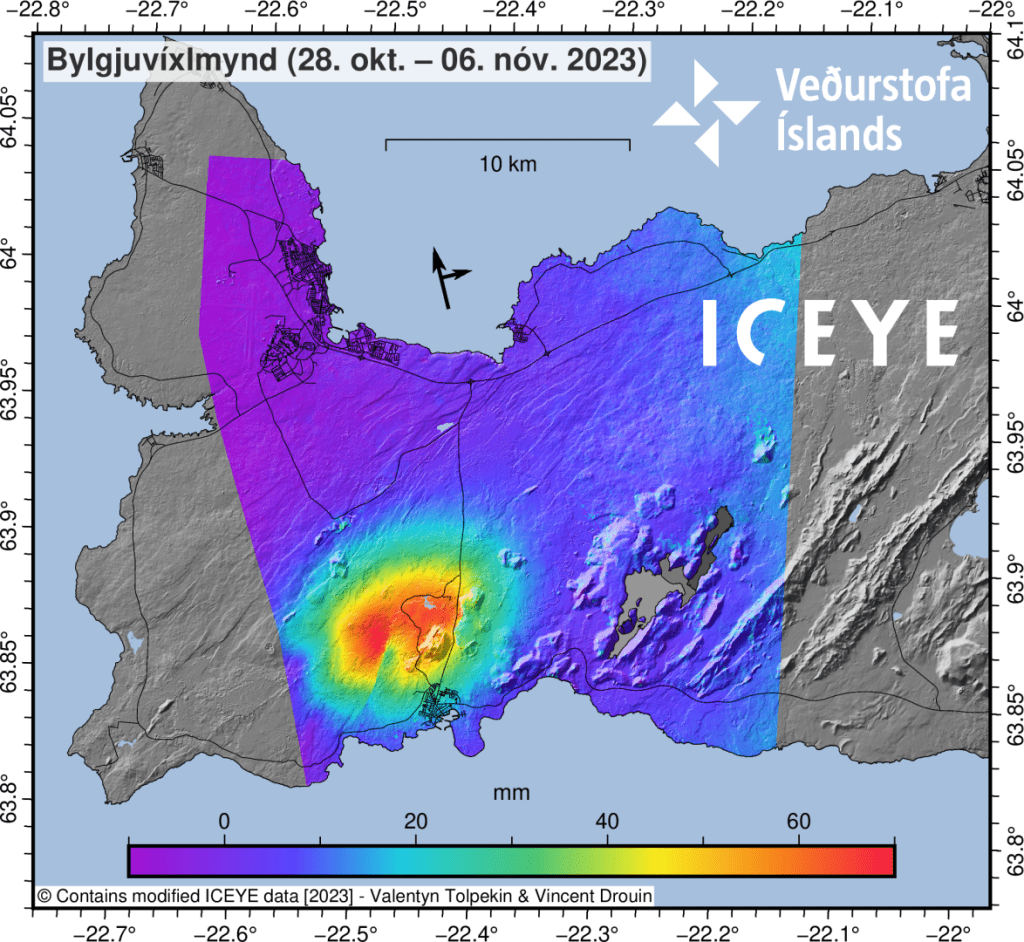
Fig 4: Interferogram (InSAR) for the period 28th of October – 6th of November showing around 7cm ground deformation. The green indent SW of Mt. Þorbjörn is an offset in the deformation signal caused by fault movements by earthquakes. Source: IMO
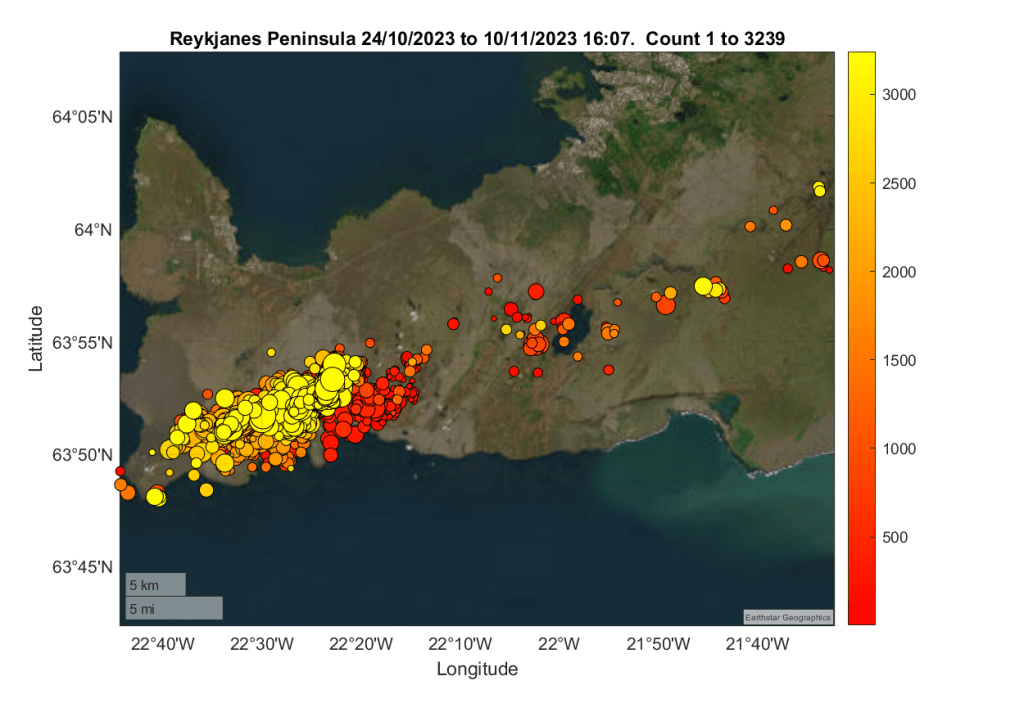
We have plotted the earthquakes reported on Skjálfta-Lísa (vedur.is) for the Reykjanes Peninsula for the period 24th October 2023 to 10th November 2023 (16:07) to see what is going on. 3,239 earthquakes have been recorded, although many more have occurred.
The geoscatter plot shows the initial seismic activity southwest of Fagradalsfjall, followed by its migration westward.
Time will tell whether an eruption ensues. But as a precautionary measure the Blue Lagoon is now closed to visitors and the residents of Grindavík have been advised of evacuation plans.
Our plot do not include the larger recent earthquakes, including the 5M. When we get more data, we will update our plots.
As this blog is about volcanic and seismic activity, a word or two on what a volcano is might be helpful.
A volcano is defined by the Oxford English Dictionary as mountain or hill with a crater or vent through which rocks, rock fragments, lava, hot vapour and / or gases are or have been erupted through the Earth’s crust. However, said mountain or hill may be quite small, even just a depression or a rupture in the Earth’s surface.
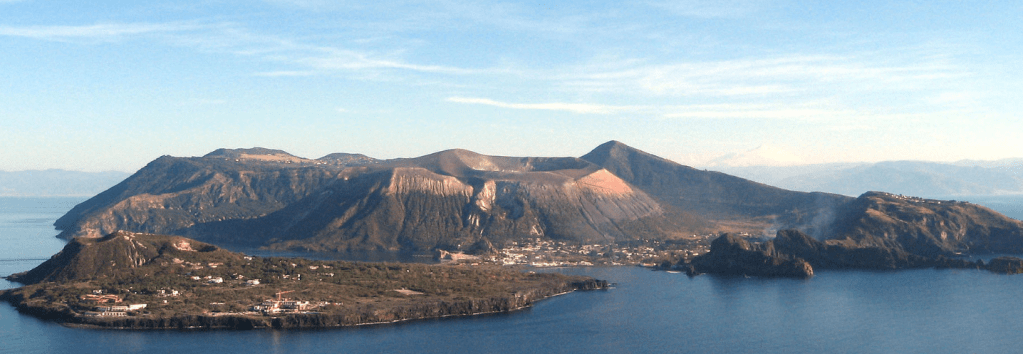
The island of Vulcano is the source of the term, volcano, itself. Vulcano Island is located in the Tyrrhenian Sea, north of Sicily, made up of several active volcanoes, including calderas.
Fig 1: Vulcano Island by Brisk g. in the public domain. Source
So what causes the lava and other matter to be erupted? What is the Earth’s crust? These are questions some of the questions we will look at in this blog.
Heat generated at the Earth’s core drives the geological processes which result in volcanic activity. For starters, we will look at the basics of the earth’s composition, magma and the source of the energy to enable eruptions to occur.
Basics of the Earth’s Composition
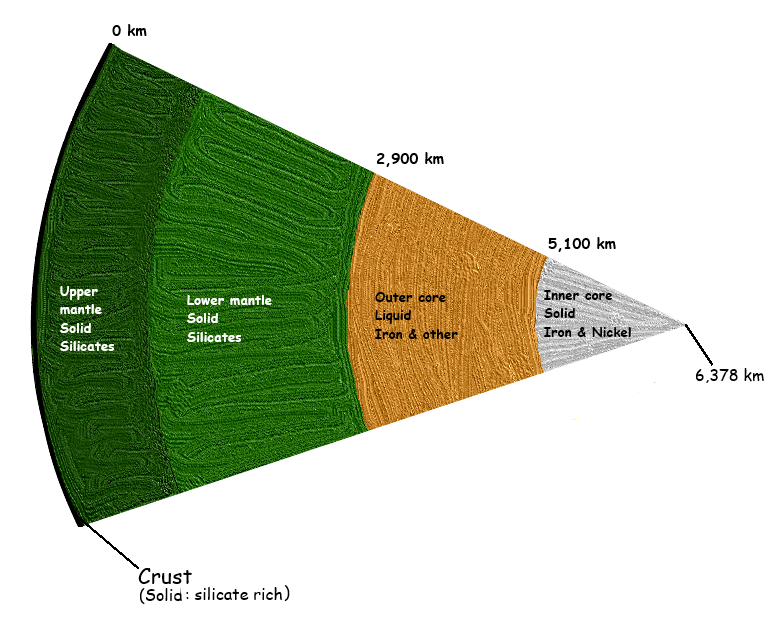
This is a very basic description of the Earth’s composition. The Earth is made up of three main parts: the core, the mantle and the crust. The core is very hot and temperatures decrease towards the Earth’s surface. Most of the Earth is solid, only the outer core is liquid. Evidence for this structure has been gleaned from seismic studies, notably how the different wave types generated by an earthquake pass through the Earth, geophysics and the study of rocks.
The radius of the Earth is around 6,378 km, in other words the centre of the Earth’s core can be found 6,738 km down. The core makes up around one third of the Earth’s mass. It is made up of an outer core which starts at around 2,900 km down and an inner core which starts at around 5,100 km down.
Material in the core is too dense to make its way to the surface, so there is some uncertainty over its composition. What we do know is inferred from geophysical studies of the Earth and the chemical analysis of meteorites. During the Earth’s formation, as rocks and fragments combined to form the planet, denser matter sunk towards the core under gravitational and other forces. Iron is the chief component of the core, with nickel at the inner core and a lighter element in the outer core (possibly, oxygen, sulphur, carbon, hydrogen or potassium). The iron in the core and the electrical currents in the molten outer core are the source of the Earth’s magnetic field.
Seismic studies have shown that the outer core is impermeable to earthquake shear waves (S waves) so acts like a liquid. Whether or not a layer is liquid or solid is down to the balance between temperature, pressure and chemical composition: while the inner core is around 4,700°C, immense pressure keeps the rock solid.
The Mantle
The mantle is composed of solid rocky materials that are less dense that the outer core; it makes up two thirds of the Earth’s mass. Density differences mean that the mantle is a distinct layer from the outer core. The most abundant elements in the mantle are silicon and oxygen, that form silicates. The mantle is made up of around 45% silica. Magnesium and iron are the third and fourth most abundant elements. Many other elements are to be found in the mantle, but these tend to be depleted near the boundary with the crust.
The composition of the mantle is inferred from xenoliths (small fragments of rock) contained in some basalt magmas and kimberlites. Whether or not these are representative of the mantle as a whole or just the fragments that have been erupted is open for debate.
The upper mantle is joined to the crust; the combined layer is referred to as the lithosphere. Below the lithosphere, also in the upper mantle, is the asthenosphere. The asthenosphere, being weaker than the lithosphere, enables lithospheric slabs to move around (plate tectonics). The asthenosphere moves at the rate of a few centimetres a year from a process called solid-state convection; hot mantle rises, transfers heat to the lithosphere and the resulting cooled mantle sinks. The heat in the lithosphere is dissipated through conduction or via rising magma.
The lithosphere is around 120 km thick. It’s boundary with the asthenosphere is defined by the temperature at which rocks become ductile, around 1,350°C.
The Crust
The crust is a silicate rich brittle layer covering the mantle; it comprises less than 0.5% of the Earth’s mass. There are two types of crust: oceanic crust, c. 6 km to 11 km thick, mostly basalt, which makes up ocean floors; and, continental crust, c. 25 km to 90 km thick, composed of igneous rocks (granite and andesite), sedimentary rocks and metamorphic rocks, which, as the name suggests, make up the continents and the continental shelves. Igneous rocks are those resulting from volcanic processes. Sedimentary rocks are those made up of fragments produced by erosion or decay of rocks on the surface. Metamorphic rocks are sedimentary or igneous rocks altered by changes in temperature and / or pressure.
Magma
Magma is the molten rock from either the mantle or the crust, itself, that makes its way through the crust to where it may be erupted as lava at a volcano or volcanic fissure. Magma and lava are the same rock: it is magma until it is erupted; and, lava is the erupted matter.
The composition of the magma and how it is generated determine the eruptive style of the volcano: e.g. effusive or explosive.
Heat
The energy required for matter to be erupted is heat from the Earth’s core. The Earth’s core is made up of radioactive materials; their radioactive decay generates heat. Most heat today is generated from four long-lived radioactive isotopes: two uranium isotopes,235U and 238U; one thorium, 232Th; and, one potassium, 40K. Additional heat came from the decay of the shorter-lived aluminium isotope, 26Al earlier in the planet’s formation. Asteroid bombardment has also added kinetic energy.
So we know have the Earth’s crust, magma and heat. What happens next? Watch this space.
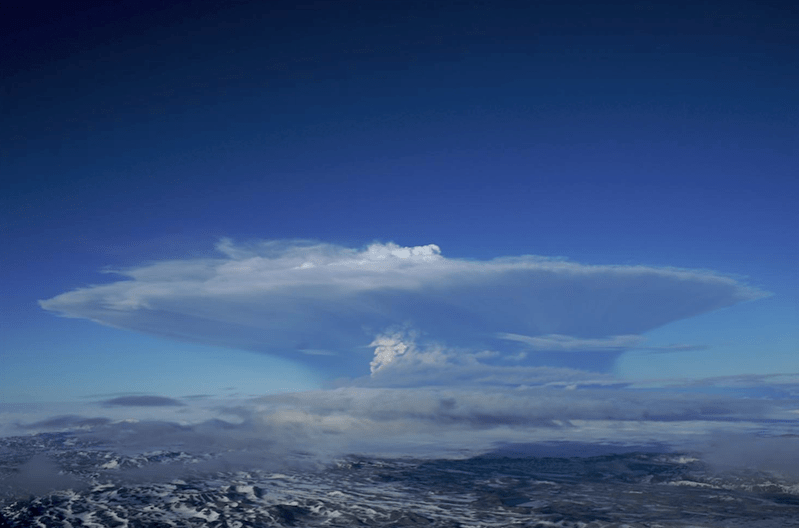
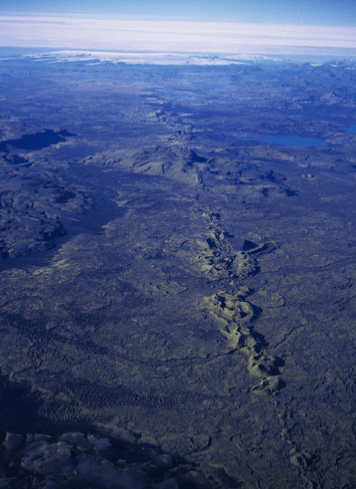
While browsing IMO’s website a few days ago, I saw that signs have been detected that Grímsvötn is getting ready for another eruption, IMO ; a team of scientists noted large sulphur dioxide emissions near the south west caldera rim, indicating that magma is close to the surface. At the time of writing, the alert level for Grímsvötn remains at green.
Grímsvötn is Iceland’s most active volcano, erupting every 10 years and last erupting in 2011 with a VEI 4.
Fig 1 Grimsvotn 2011 eruption. Photographer: Sigurjónsson,O. Grímsvötn (GRV): photo 2 of 14. Retrieved from Icelandic Volcanoes: http://icelandicvolcanos.is/?volcano=GRV
Geological Setting
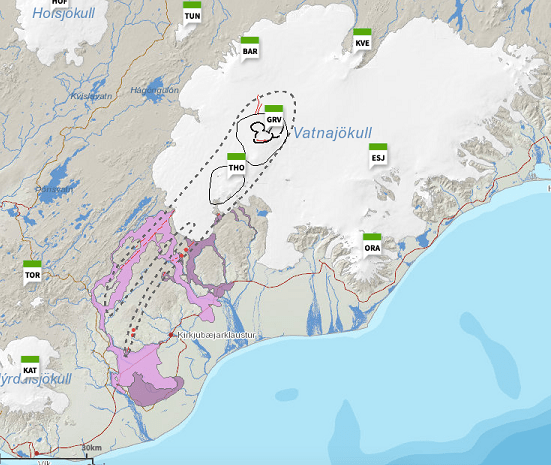
Grímsvötn is one of six active volcanoes under the Vatnajökull ice cap: Bárðarbunga, Kverkfjöll, Grímsvötn, Esufjöll, Þórðarhyrna, Öræfajökull. Apart from Þórðarhyrna (THO in the map below), the other volcanoes are different volcanic systems.
The Vatnajökull volcanoes are part of the Eastern Volcanic Zone in Iceland. Volcanism here is caused by rifting and extension from the separation of the North American and Eurasian Plates. As noted in an earlier post, the Eastern Volcanic Zone accommodates 40 to 100% of the separation.
Our description of the Grímsvötn volcanic system is largely based on Magnús T. Guðmundsson and Guðrún Larsen’s description in Icelandic Volcanoes (ref. Sources below for the full accreditation).
The Grímsvötn volcanic system
The Grímsvötn volcanic system, itself, is made up of two central volcanos and fissure swarms. It is partly covered by ice.
Fig 2 The Grímsvötn volcanic system showing craters, central volcanoes and fissure swarms. Retrieved from Icelandic Volcanoes (see Sources below for full accreditation).
The Central Volcanoes
The Grímsvötn central volcano is a 1722m high, 15-16km diameter caldera complex covered by the Vatnajökull ice-cap, with ice depths of 100m to 700m; she has an 8km by 10km ice-filled caldera. Grímsfall (GFUM) is the highest point on the caldera rim. There is a subglacial lake in the caldera under a 200 – 300m ice shelf with an associated geothermal area. The lake has been the source of many jökulhlaups.
The Þórðarhyrna central volcano, also subglacial, is a 1650 high with a 15 km diameter, connected to Grímsvötn by a subglacial ridge. The volcano, itself, has a small intrusive complex but does not appear to have a large magma reservoir. There is a geothermal area near Pálsfjall.
Ice cover has restricted study of the volcanoes. However, Grímsvötn has been around for long enough to develop a caldera – possibly more than 100,000 years.
Grímsvötn’s lava types are tholeiitic basalt with basaltic andesite and dacite / rhyolitic outcrops in the Þórðarhyrna central volcano. The presence of a shallow magma reservoir is inferred from the geothermal field in the caldera. The 2011 eruption of Grímsvötn produced 0.8km3 basaltic tephra.
Þórðarhyrna is less active than her neighbour; the last eruption occurred in 1903 with a VEI 4. It is possible that she had a second eruption in 1753, resulting in jökulhlaups. Again, ice cover has limited geological study. There is little seismic activity near Þórðarhyrna.
The Fissure Swarms
The fissure swarm is about 100 km long and 18 km wide. Rifting is believed to occur along the entire swarm. The northern end of the fissure swarm is covered by the Vatnajökull ice-cap; the southern 80km is ice-free. Subglacial ridges characterise the northern end of the fissure, but not the ice-free southern end where crater rows delineate the fissure, including the Laki.
Three known subglacial eruptions have occurred since 1867 at Gjálp 10km to 15km north of Grímsvötn, itself. The eruptive products include subglacial ridges and some airborne tephra. The 1996 eruption produced basaltic andesite.
Four effusive eruptions have been identified in the ice-free section of the fissure swarm southwest of Grímsvötn in the last 8,000 years; lava volumes have been between 1 km3 to 14 km3 with up to 0.7km3 of tephra. The largest fissure eruption was the Laki eruption in 1783 to 1784. No eruptions have been identified for the ice-covered section of the fissure swarm.
The Laki Fissure Eruption 1783 -1784
This eruption was well documented at the time; the Reverend Jón Steingrímsson’s 1788 account in “A complete description of the Síða Fires” gives a detailed eye-witness account.
The 1783 eruption occurred on 27km long fissure and lasted from 8 June 1783 to 7 February 1784. The early phase consisted of a series of ten or more explosive tephra events, each followed by effusive lava flows. Grímsvötn, itself, erupted in July 1783 to May 1785 causing ash fall and jökulhlaups.
The Laki eruption was pre-empted by earthquakes of increasing intensity from mid-May to 8 June 1783 when a large ash cloud and ash fall appeared, followed by lava columns over 1km high from new fissure to the north. Volcanic gases filtered out sunlight, making the Sun appear red. Accompanying rainfall was acidic, irritating people’s eyes and skin. Lava flows filled river gorges, overflowing to cover surrounding farmland. During the eruption, Mount Laki was destroyed; I am not sure how big she was and how much her destruction contributed to the vast tephra output.
The eruption is rated a VEI4, having produced 0.7km3 of tephra which covered more than 8,000 km2, and 14 km3 of lava. Volcanic gases, including fluorine, killed more than half of the livestock and the “Haze Famine” killed 20% of the Icelandic population. Further afield, 100 million tonnes of sulphur dioxide, having reached the jet stream, spread acidic sulphate aerosols round the Northern Hemisphere, damaged vegetation and crops in Europe and Alaska, caused severe winters and annual cooling of around 1.3°C that lasted for two to three years.
Fig 3: Laki Crater Row: Photographer: Sigurðsson, O. Grímsvötn (GRV): photo 1 of 14. Retrieved from Retrieved from Icelandic Volcanoes: http://icelandicvolcanos.is/?volcano=GRV
According to GVP, the Grímsvötn volcanic system has had 86 Holocene eruptions ranging from VEI 0 to VEI 6. The VEI 6 occurred around 10200 BP and is the thought to be the source of the Saksunarvatn Tephra, a basaltic tephra which covered an area of 2 million km2 around the North Atlantic. The Saksunarvatn Tephra, like the Vedde Ash from Hekla, is a geological time marker, although radiocarbon dating of the Saksunarvatn Tephra shows that it may have come from seven eruptive events over a 500 year period from 10400 BP to 9900 BP
Grímsvötn’s most recent eruptions from 1996 to 2011 range from VEI 3 to VEI 4. They were preceded by a small increase in seismicity and small earthquake swarms, except for the 1996 Gjálp eruption. The 1996 eruption was preceded by a 5.4 earthquake on Barðabunga’s northern caldera rim, swarms over a two day period at Barðarbunga’s north and northwest caldera rims and at Grimsvotn’s southern caldera rim, followed by a swarm from the north Bardarbunga caldera rim that migrated to Gjálp.
Recent Seismicity
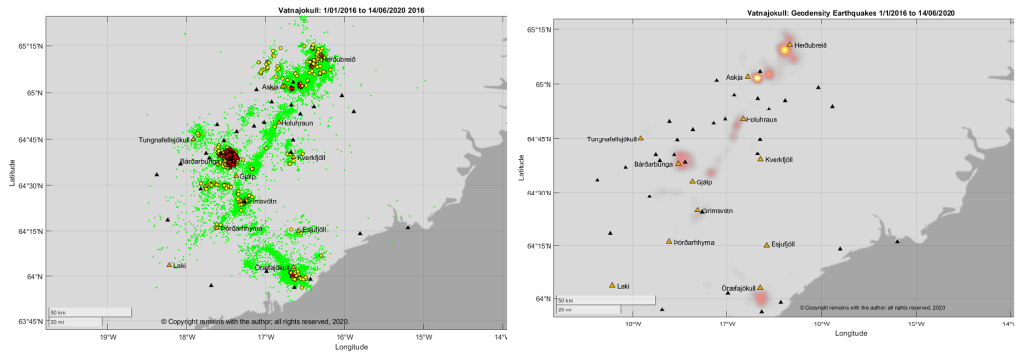
So, what does our earthquake data set tell us about the likelihood of an eruption at Grímsvötn? The answer is a disappointing “not a lot”. We can see that Grímsvötn has a fairly steady stream of earthquakes but no obvious swarms. However, given the proximity of Grímsvötn to other volcanoes, we may have attributed some of Grímsvötn’s activity to another volcano in error. Plots are shown below, including one for Vatnajökull which shows the problem.
The earthquake plots of the Vatnajökull region show the SW-NE trending fissure swarms and also a SE-NW trending line of earthquakes. The head of the mantle plume is considered to be under the Vatnajökull ice-cap; perhaps we are seeing its influence on the plate junction? We can also see the proximity of Grímsvötn to Bárðarbunga.
The Grímsvötn system, with 3,326 earthquakes, is not the most seismically active volcano; activity is overshadowed by seismic activity at Bárðarbunga (5,464 earthquakes), Askja and Herðubreið (a combined 15,645 earthquakes) and Öræfajökull (4,770 earthquakes). The 2014 eruption of Holuhraun was both preceded and accompanied by intense seismic activity at Bárðarbunga, notably near the edges of the caldera, and deflation at Bárðarbunga. Since the eruption, Bárðarbunga has started to re-inflate. Our data set starts a year or more after the end of that eruption.
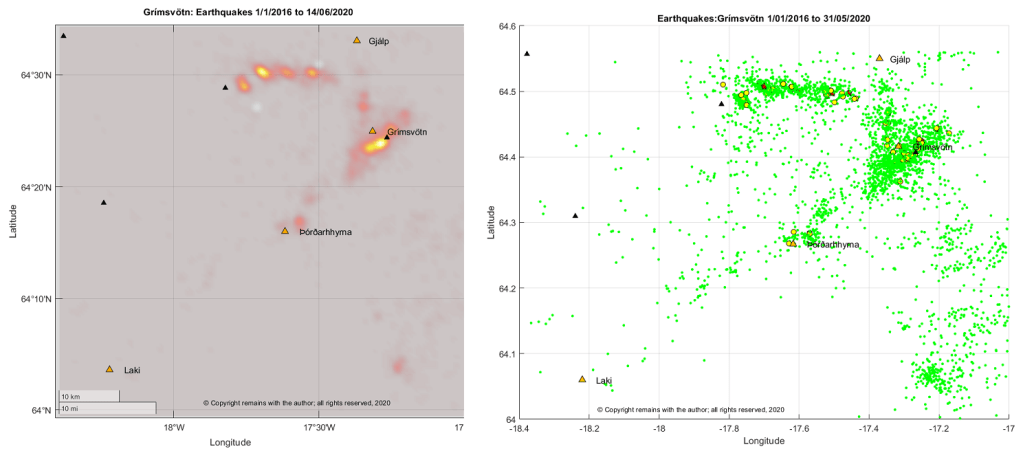
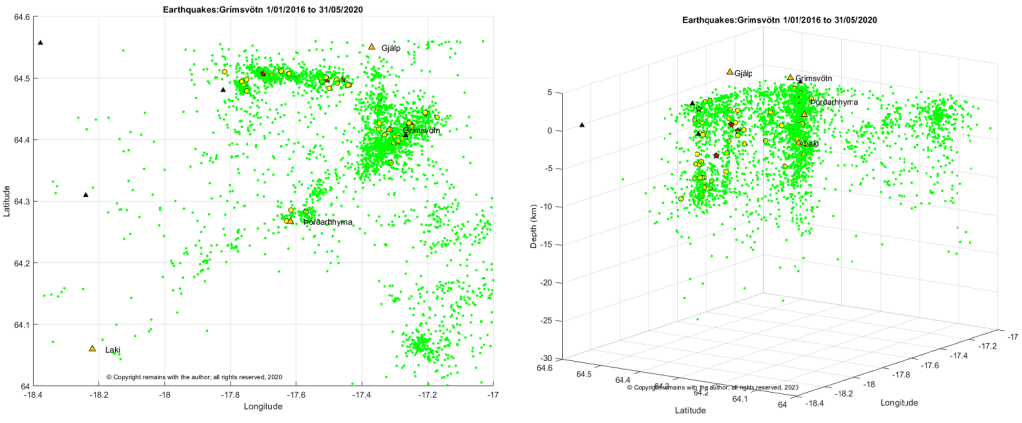
Looking more closely at Grímsvötn we see that earthquake activity is focused on the south east of the caldera and at an E-W trending fissure to the north east of the volcano. The E-W fissure is parallel to similar lines of activity further north at Bárðarbunga’s caldera. We also picked up some activity at Þórðarhyrna.
The earthquakes are telling only part of the story. Grímsvötn has had a steady stream of earthquake activity during the period, but without the SO2 measurements from scientists, we would not be certain that magma, itself, was near the surface.
For updates on Grímsvötn, please visit IMO’s website (details below).
The Armchair Volcanologist
22 June 2020
Sources and Further Reading
“Grímsvötn”, Magnús T. Guðmundsson and Guðrún Larsen (Institute of Earth Sciences – Nordvulk, University of Iceland) In: Oladottir, B., Larsen, G. & Guðmundsson, M.T., Catalogue of Icelandic Volcanoes. IMO, UI and CPD-NCIP. Retrieved from Icelandic Volcanoes: http://icelandicvolcanos.is/?volcano=GRV
“Þórðarhyrna”, Magnús T. Guðmundsson and Guðrún Larsen (Institute of Earth Sciences – Nordvulk, University of Iceland) In: Oladottir, B., Larsen, G. & Guðmundsson, M.T., Catalogue of Icelandic Volcanoes. IMO, UI and CPD-NCIP. Retrieved from Icelandic Volcanoes: http://icelandicvolcanos.is/?volcano=THO
Fig 2: Map: After Guðmundsson and Miller (1997), Guðmundsson et al (2013a), Jóhannesson and Sæmundsson (1998a), Jóhannesson et al (1990). Base data, Iceland Geo Survey, IMO, NLSI | Base map: IMO. In: Oladottir, B., Larsen, G. & Guðmundsson, M.T., Catalogue of Icelandic Volcanoes. IMO, UI and CPD-NCIP. Retrieved from Icelandic Volcanoes: http://icelandicvolcanos.is/?volcano=GRV
Smithsonian Institution Natural History Museum Global Volcanism Program (GVP): https://volcano.si.edu
Having visited Katla, let’s go further north to the Eastern Volcanic Zone and take a look at Hekla.
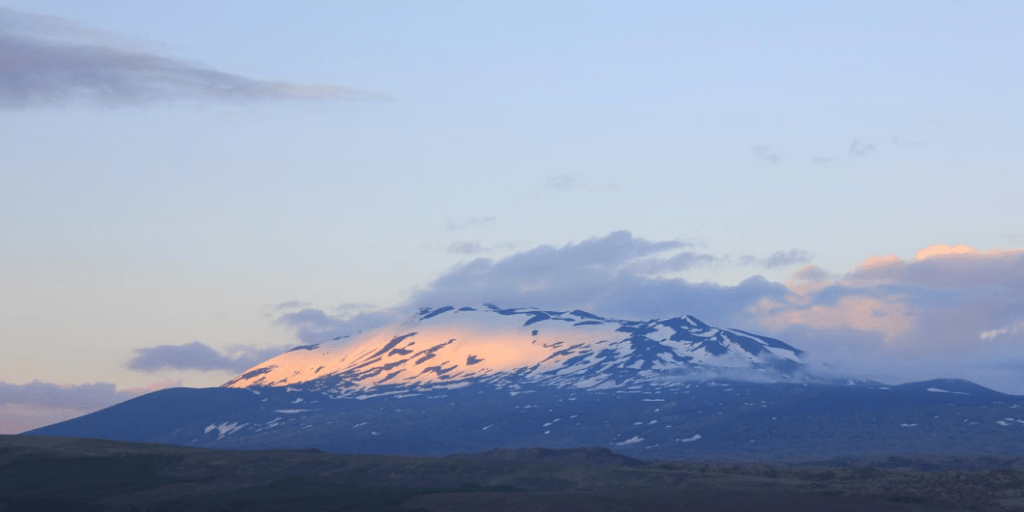
Hekla is an active snow-covered elongated stratovolcano, lying at the southern end of the Eastern Volcanic Zone in Iceland in a rift transform junction. Following the 1104 AD eruption, Hekla was called “The Gateway to Hell” – a name that stuck until the 19th century.
Fig 1: Hekla 22 June 2014; photo by Evgenia Ilynskya (see below for source).
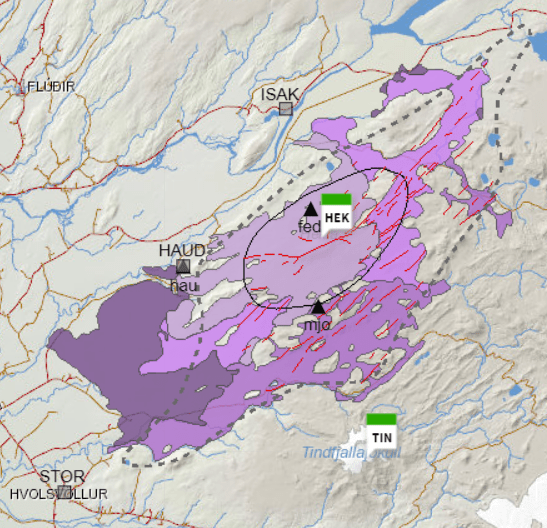
The Hekla volcanic system comprises a 1490m high central volcano and a 60 km fissure swarm. The Heklugjá fissure, 5.5 km long cutting across the central volcano, is the site of many eruptions and gives Hekla its elongated shape. The Vatnafjöll fissure system, 40 km long and 9 km wide is considered part of the Hekla volcanic system. Hekla may have a small magma reservoir 4 km below the surface. She has permanent snow cover but no large glacier.
Fig 2: Hekla’s central volcano, fissure system and some lava flows. Retrieved from Icelandic Volcanoes (see Sources below). GPS and seismic stations are included so we can identify earthquake locations in later plots.
Hekla’s lavas differ from the rift zone volcanoes; her lavas are andesite, basaltic andesite, basalt / picro basalt, rhyolite and dacite. She erupts tephra and silicic to intermediate lavas from the central volcano. Eruptions tend to be a short plinian / subplinian phase followed by lava flows. Larger explosive silicic eruptions have produced enough tephra for the deposits to act as time markers in dating other eruptive activity in Iceland. She is a large fluorine producer which is hazardous to livestock. The hazards listed are tephra fallout, fluorine gas, pyroclastic flows and lava flows; the absence of a large glacier means that jökulhlaups are not a major hazard for Hekla.
The fissure system produces basaltic lavas and a small amount of tephra; its hazards are listed as lava flows and volcanic gas pollution.
Eruptive History
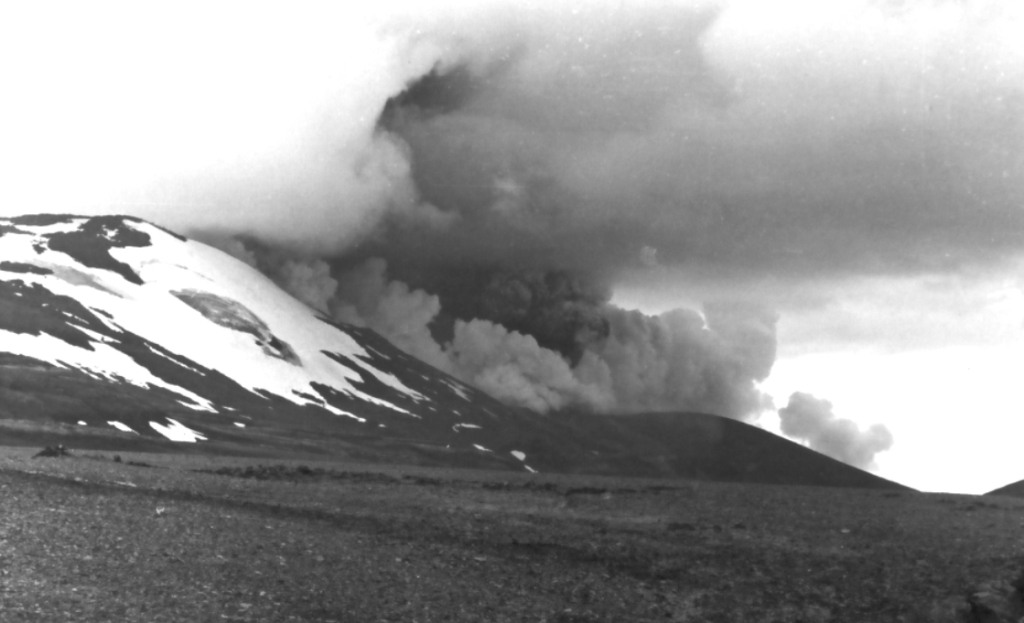
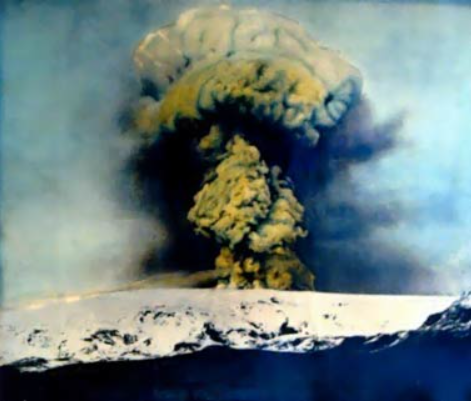
Fig 3: 1980 Eruption of Hekla by oxonhutch at English Wikipedia: Hekla,shared under CC-BY-2.5
According to GVP, Hekla has had 65 Holocene eruptions ranging from VEI 1 to 5. Larsen and Thordarson state that there have been 100 eruptions in the past 9000 years, 23 of which occurred in the last millennium with VEIs ranging from 0 to 5. The central volcano produces eruptions of VEI 2 to 6, VEI 3 to 4 being the most frequent; the longer the repose time between eruptions, the larger the ensuing eruption. The fissure system produces less explosive eruptions (VEI 1 to 2). Hekla’s largest known eruption, a VEI 6, occurred between 3000 to 4300 years ago. Traces of ash from Hekla have been found in Scandinavia, Germany, Ireland and the UK.
Hekla’s eruptive style has changed over time: from effusive basalt 9000 to 7000 years ago; to large explosive silicic eruptions between 7000 to 3000 years ago; and, then smaller more frequent mixed silicic and basaltic eruptions from 3000 years ago to the present day.
The most recent eruption was in 2000, with a VEI 2 to 3, 0.01km3 of airborne tephra 0.01km3 and 0.12km3 of lava; it thought that magma rose through a conduit from a depth of more than 10km to 1km below before heading towards a fissure on the Hekla ridge.
Hekla has an unusually low level of seismic activity. Her largest earthquakes are in the order of 2M when dormant and 3M during an eruption. She does not give much warning of an eruption: known precursors are earthquakes 25 to 90 minutes beforehand. Monitoring has increased since the last eruption so there should be more information about any precursors to future eruptions.
Recent Seismic Activity
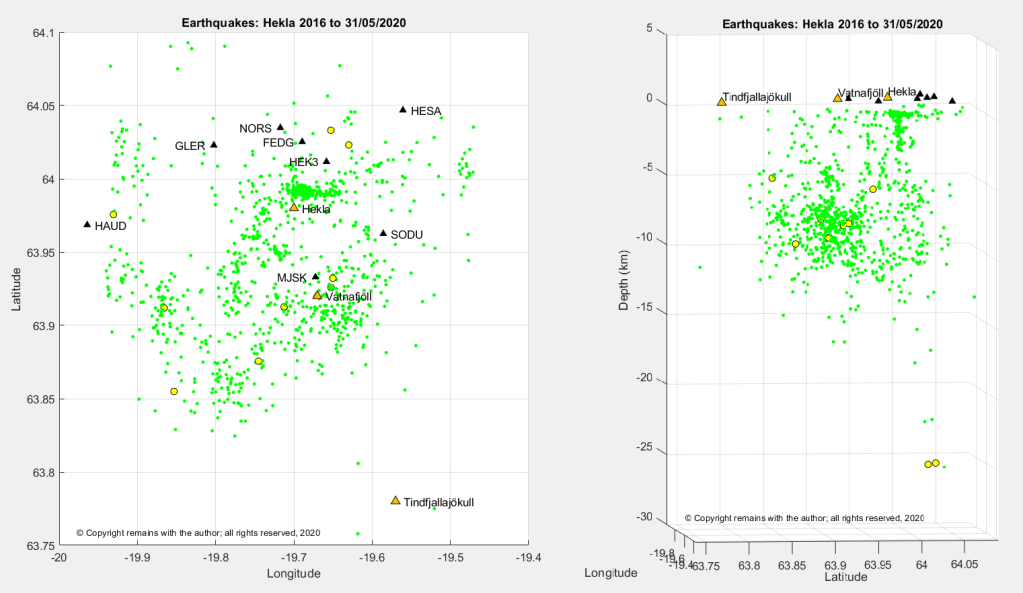
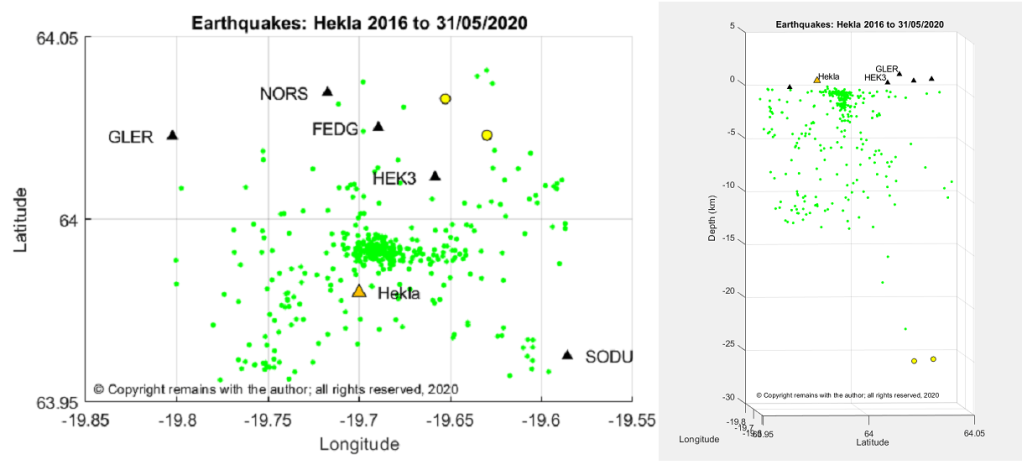
From the data set of earthquakes downloaded from IMO’s site for period 1 January 2016 to 31 May 2020, we extracted those for the Hekla – Vatnafjöll area: 63.7578°N, 19.4687°W to 64.0952°N, 19.9399°W. We found 1,018 earthquakes, compared to Katla’s 6,505 for the same period. The largest quake was 2.62 and the deepest 25.11km.
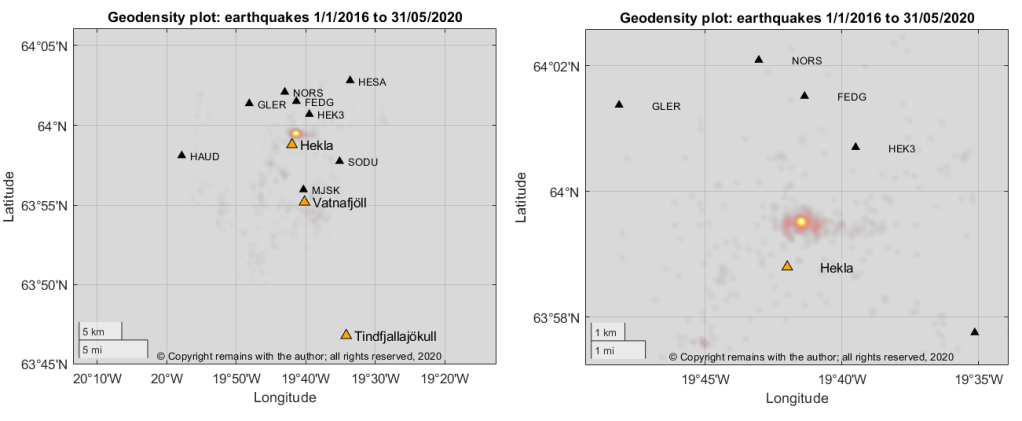
In our latitude v longitude scatter plot we can see that most earthquake activity is scattered along the fissure systems, with an E-W “cluster” to the south of GPS station HEK3, north of Hekla. The latitude v depth plot shows the activity near Vatnafjöll is occurring in the lithosphere, whereas there appears to be a conduit under Hekla. A close up of the cluster confirms this impression.
We looked for swarms in the data set to see if these account for the hot spot but did not find any large ones; the hot spot appears to be an accumulation of activity over the period. Hekla seems to have a slow magma feed.
“Hekla”, Guðrún Larsen (Institute of Earth Sciences – Nordvulk, University of Iceland) and Thor Thordarson (Faculty of Earth Sciences, University of Iceland). In: Oladottir, B., Larsen, G. & Guðmundsson, M.T., Catalogue of Icelandic Volcanoes. IMO, UI and CPD-NCIP. Retrieved from Icelandic Volcanoes: http://icelandicvolcanos.is/?volcano=HEK
Fig 2: Map: After Jóhannesson and Einarsson (1992), Jóhannesson and Saemundsson (1998a), Larsen et al (2013a), Base data, Iceland Geo Survey, IMO, NLSI | Base map: IMO. In: Oladottir, B., Larsen, G. & Guðmundsson, M.T., Catalogue of Icelandic Volcanoes. IMO, UI and CPD-NCIP. Retrieved from Icelandic Volcanoes: http://icelandicvolcanos.is/?volcano=HEK
Smithsonian Institution Natural History Museum Global Volcanism Program (GVP): https://volcano.si.edu
Continuing our theme of seismicity in Iceland, we have now reached the Mýrdalsjökull Region and are heading towards the Fire Districts in the Eastern Volcanic Zone.
We took a slight detour to set up a Glossary to explain some of the terms used here to help out. You can find it on the Menu bar.
Mýrdalsjökull lies at the southern end of the Eastern Volcanic Zone, near its junction with the South Iceland Seismic Zone. The South Iceland Seismic Zone is a transform fault system that links the West and East Volcanic Zones. The Eastern Volcanic Zone accommodates 40 to 100% of the spreading between the North American and the Eurasian Plates; the Western Volcanic Zone takes up the remainder. Active rifting on the Eastern Volcanic Zone terminates at Torfajökull volcano at the rift’s southern end. Katla, Eyjafjallajökull and more southerly volcanoes are on the Eurasian Plate.
Fig 1: Katla 1918 eruption. Image by RicHard-59 Public Domain
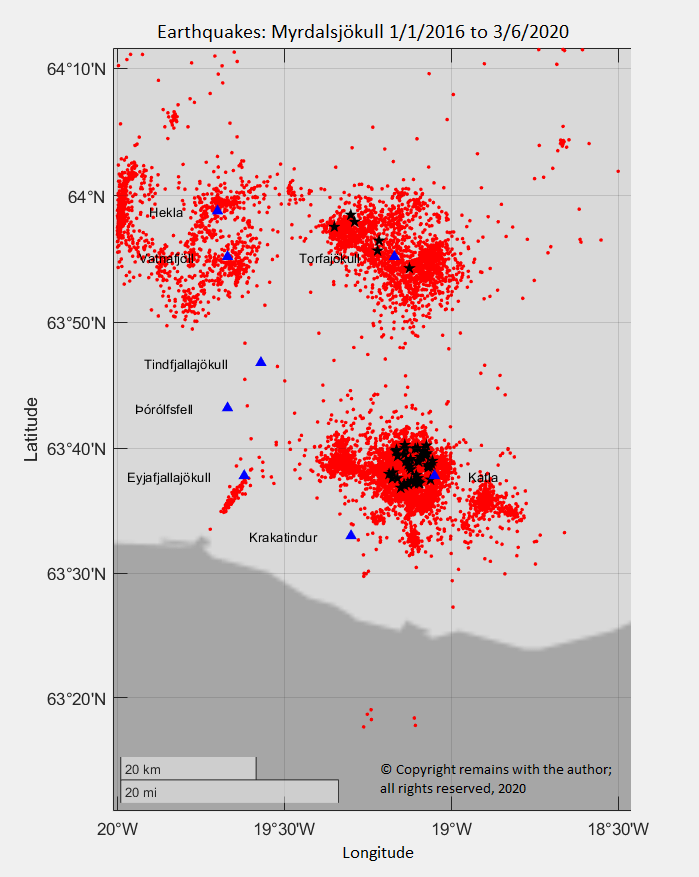
We updated our earthquake dataset so we are now looking at the period from 1 January 2016 to 31 May 2020. Apart from the continued swarm on the Reykjanes Peninsula, there has not been any unusual activity (to the untrained eye, at least). We used IMO’s latest earthquake map for Mýrdalsjökull as an indicator for the coordinates to extract the data for the region. This picked up five seismically active volcanic systems (Eyjafjallajökull, Hekla, Katla, Torfajökull and Vatnafjöll) and three inactive areas (Krakatindur, Þórólfsfell and Tindfjallajökull).
Let’s start by taking a closer look at Katla; the other volcanic centres will be covered in later posts.
The Katla Volcanic System
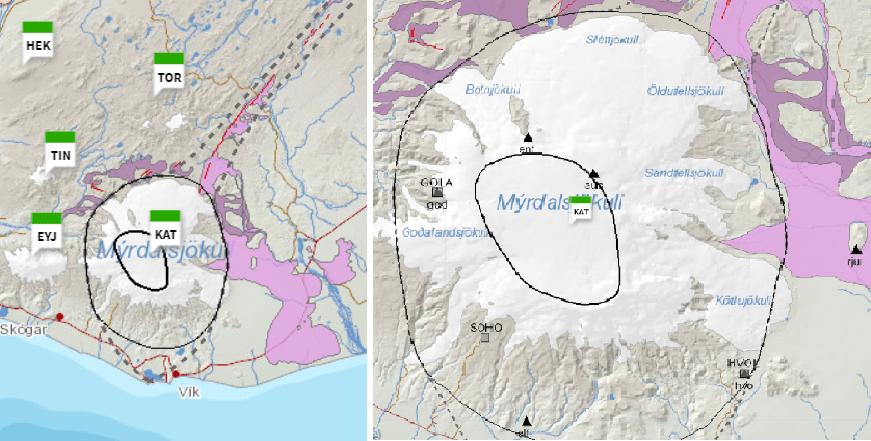
Katla is one of Iceland’s most active volcanoes. The volcanic system is 80 km long, made up of a 30 km wide central volcano and fissure systems. The central volcano has a 10km by 14km wide, 600m to 750m deep caldera with a 5km wide magma reservoir at a depth of 1.5 km. The Katla fissure, Kötlugjá, is located in the caldera. At the north west of the system is the Hólmsá fissure and to the north east, the Eldgjá fissure. There are also inactive fissures to the south. The Mýrdalsjökull ice cap covers most of the central volcano.
Fig 3: Images of the Katla Volcanic System retrieved from the CatalogueofIcelandicVolcanoes (see Sources below) showing the caldera rim, the outline of the central volcano and the north east fissure system. EYJ, TIN, HEK and TOR are other volcanic centres which may be covered in later posts.
Katla’s lavas are basalt/picro basalt, rhyolite and dacite, with a few intermediate hybrids, andesite and basaltic andesite. The basaltic eruptions are the most voluminous , sourced from the mantle via a spreading rift. She has also had many dacite eruptions. Lavas from the Eldgjá fissure are basaltic.
Eruptive History
Volcanism at Mýrdalsjökull began over 800,000 years ago and at Katla, 200,000 years ago. Studies of tephra have identified 200 basaltic and 14 silicic eruptions in the last 8,500 years; unfortunately, no more is known about what happened before the end of the last ice age.
Katla’s largest known eruption was a rhyolitic VEI 6 in 10600 BC which produced more than 10 km3 of rhyolite in pyroclastic flows and airborne tephra that reached 1,300 km from the volcano. The Sólheimar ignimbrite formed from the pyroclastic flows; and the tephra is referred to as the Skógar tephra (Iceland) or Vedde Ash (Norway, after the place where it was discovered).
GVP notes 132 Holocene eruptions for Katla, which range from VEI 3 to VEI 5. All Holocene eruptions occurred in the caldera, except for the 934 AD to 940 AD eruption of the Eldgjá fissure to the north east and the Hólmsá Fires in 6600 BC. Her recent eruptive style tends to be explosive basaltic eruptions from the caldera with tephra volumes up to 2km3, accompanied by jökulhlaups (glacial outburst floods). Water from melting ice cap contributes to the explosivity of the eruptions.
The last eruption to break the ice-cap was a VEI 4 in 1918 which produced an ash column up to 14 km in height, 0.7 km3 of airborne tephra, 1 km3 of debris from jökulhlaups and a small volcanic fissure; no lava emission was reported. The 1625 and 1755 eruptions, both VEI 5s, produced more tephra which reached further than 1,000 km from the central volcano.
The average time between eruptions has been cited as between 40 and 80 years on average. On that basis, Katla is expected to be gearing up for another eruption in the near future.
A period of unrest started in 1999 with a jökulhlaup, seismic tremors, geothermal activity and cauldron formation. There have been more recent subglacial eruptions: a jökulhlaup occurred in 2011, accompanied by a harmonic tremor and the formation of several ice-cauldrons, was thought to be indicative of a sub-glacial eruption; and the most recent jökulhlaup was in 2017, it is not clear if this was accompanied by a harmonic tremor.
Recent Seismicity
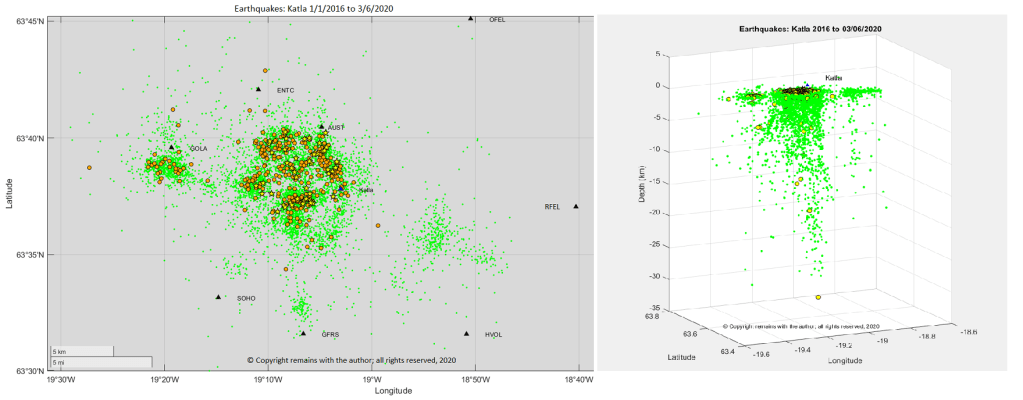
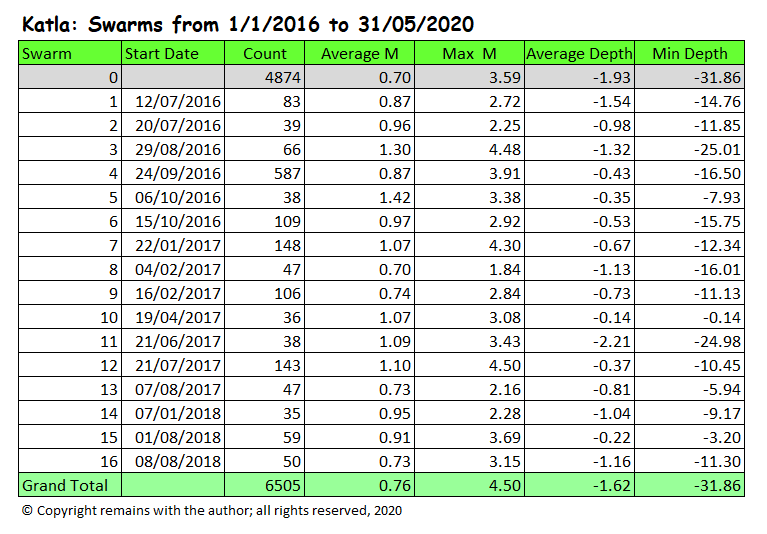
We extracted the earthquakes for Katla from the above data set using the coordinates 63.785°N, 19.4987°W to 63.4547°N,18.6608°W. This produced 6,505 earthquakes for the period 1 January 2016 to 31 May 2020.
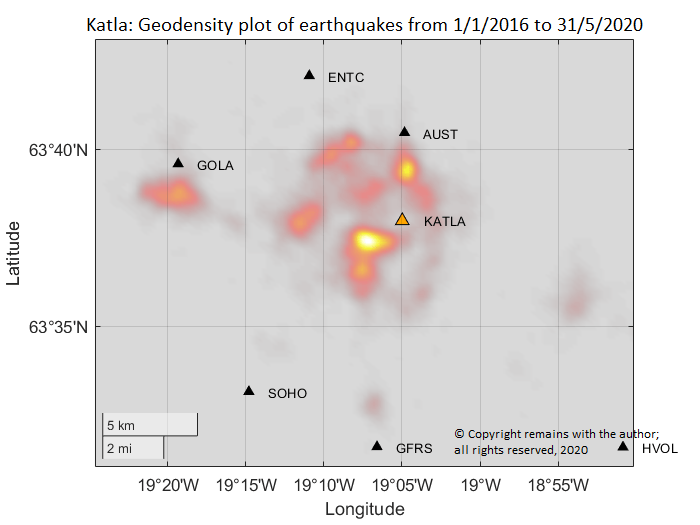
Our plots show most activity in the caldera, some at the Goðabunga cryptodome and a low level of activity to the south and east of the caldera. Activity in the caldera is fed from a depth of 32km.
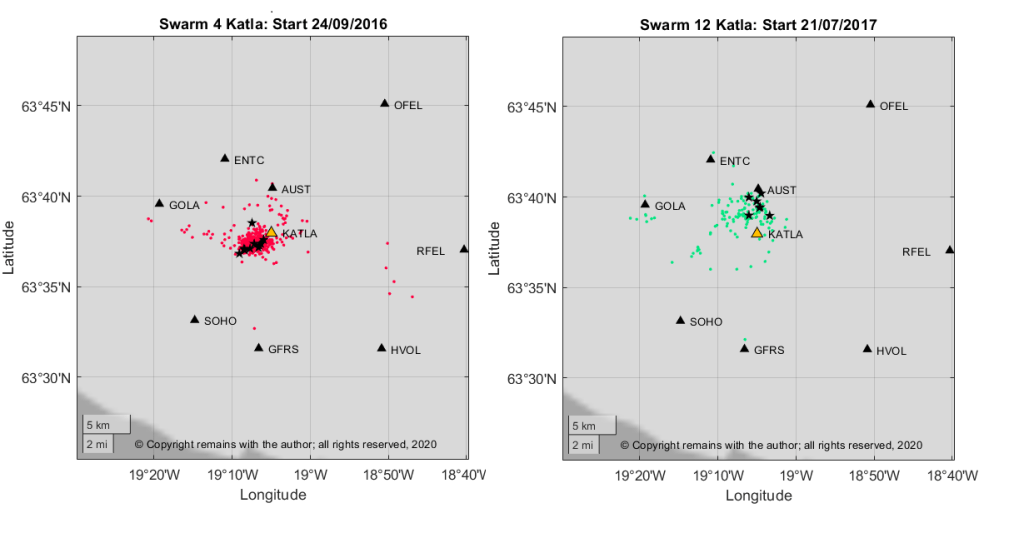
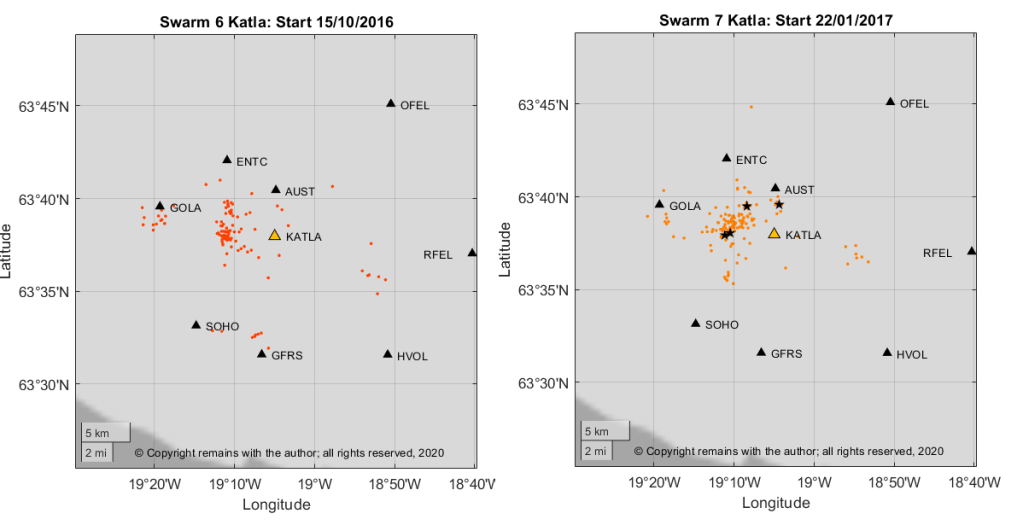
So what is causing the hot spots? We looked for earthquake swarms to see whether they are the cause of the hot spots in the geodensity plot. We used the criterion of 30 or more earthquakes in one day or in two consecutive days, which is a higher level of activity than Mýrdalsjökull’s “normal” activity. This showed 16 swarms (ref Appendix), of which five had more than 100 earthquakes; four of the five swarms were clustered (Swarms 4, 6, 7 and 12, shown below) and one was more spread out. Note: our analysis of swarms is not intended to pick up any small magma intrusions that have fewer than 30 earthquakes attached to them.
We see that Swarm 4 and Swarm 12 contributed to the hotter spots in the geodensity plots; the remaining hot spots seem to be caused by an accumulation of activity over four plus years in the data set. Without a clear map of the fissures within the caldera (Googling around did not find one), we cannot tell if the swarms coincide with known fissures. However, swarm 12 coincides with the 2017 jökulhlaup. Most of the swarms in the set appear to be part of the run up to a potential subglacial eruption. It is interesting to note that there do not appear to be any larger swarms after July 2017.
Earthquake swarms are precursors to eruptive activity. Unfortunately, as the last eruption to break through the ice-cap preceded any modern volcano monitoring, there is less certainty over what would precede another subaerial eruption, notably in respect of the intensity of swarms, magnitude of the earthquakes, jökulhlaups, and the time-frames.
It has been a while since Katla produced a large eruption. Let’s hope she sleeps for a bit longer; the world has enough to contend with at the moment.
Smithsonian Institution Natural History Museum Global Volcanism Program (GVP): https://volcano.si.edu/
“Iceland”, Thor Thordarson & Armann Hoskuldsson, Classic Geology in Europe 3, Terra Publishing, Third Impression, 2009
“Katla”, Guðrún Larsen and Magnús T. Guðmundsson (2016 March 7). In: Oladottir, B., Larsen, G. & Guðmundsson, M.T., Catalogue of Icelandic Volcanoes. IMO, UI and CPD-NCIP. Retrieved from Icelandic Volcanoes: http://icelandicvolcanos.is/?volcano=KAT
Fig 3: Map: After Jóhanneson and Saemundsson (1998a), Björnsson et al (2000) and Larsen (2000), Base data, Iceland Geo Survey, IMO, NLSI | Base map: IMO. In: Oladottir, B., Larsen, G. & Guðmundsson, M.T., Catalogue of Icelandic Volcanoes. IMO, UI and CPD-NCIP. Retrieved from Icelandic Volcanoes: http://icelandicvolcanos.is/?volcano=KAT
“Katla and Eyjafjallajökull Volcanoes”, Erik Sturkell, Páll Einarsson, Freysteinn Sigmundsson, Andy Hooper, Benedikt G. Ófeigsson, Halldór Geirsson and Halldór Olafsson, Developments in Quaternary Sciences, Volume 13, ISSN 1571-0866
It’s back to Iceland to finish off a post I started before being diverted by the earthquake swarm in Nevada.
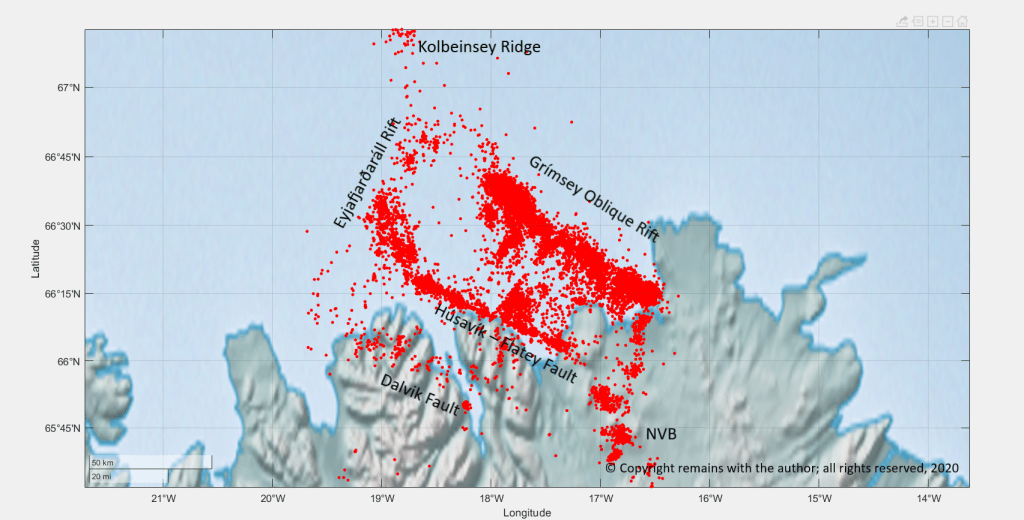
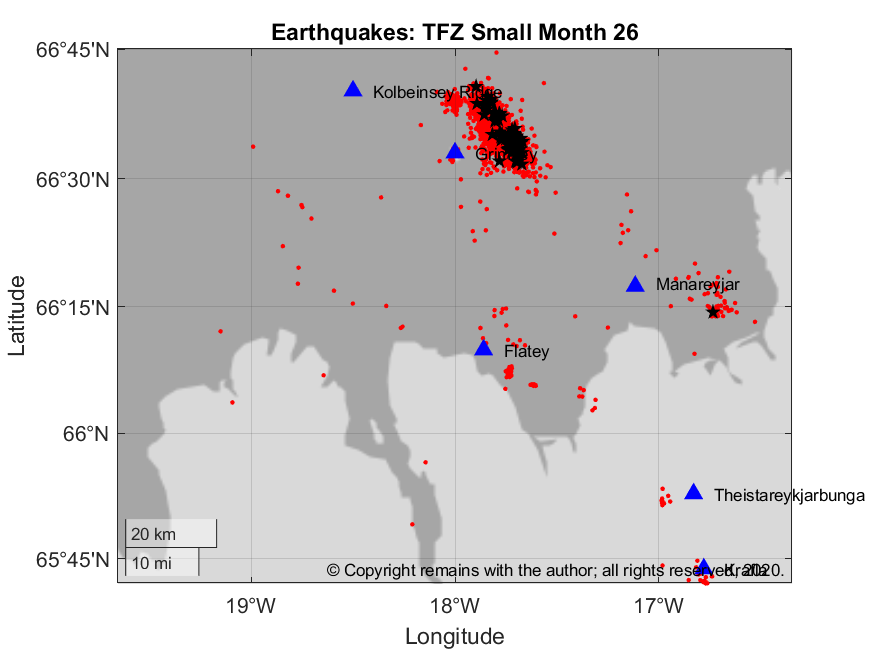
Having looked at the recent activity at the Reykjanes Peninsula, let’s now look at the Tjörnes Fracture Zone, where the Mid Atlantic Ridge leaves Iceland to head northwards. Here, current seismic activity is predominantly tectonic. Our study is based on the same data set used for the introduction to Iceland and the Reykjanes Peninsula (earthquake data downloaded from the Icelandic Meteorological Office(1) from January 2016 to April 12, 2020, updated to May 3, 2020).
The Tjörnes Fracture Zone (TFZ) is a complex area of transform and extensional faulting connecting the Kolbeinsey Ridge, the Western Volcanic Zone and the Northern Volcanic Zone. The Kolbeinsey Ridge, itself, is slow spreading at a rate of 10mm per year. The main faults in the area are: the EyjaFjarðaráll Rift, the Húsavík-Flatey Fault (the TFZ, itself), the Grímsey Oblique Rift and the Dalvik Fault. Both hydrothermal and seismic activity cluster on the faults. The Húsavík-Flatey Fault has produced earthquakes with magnitudes in the region of 7.0.
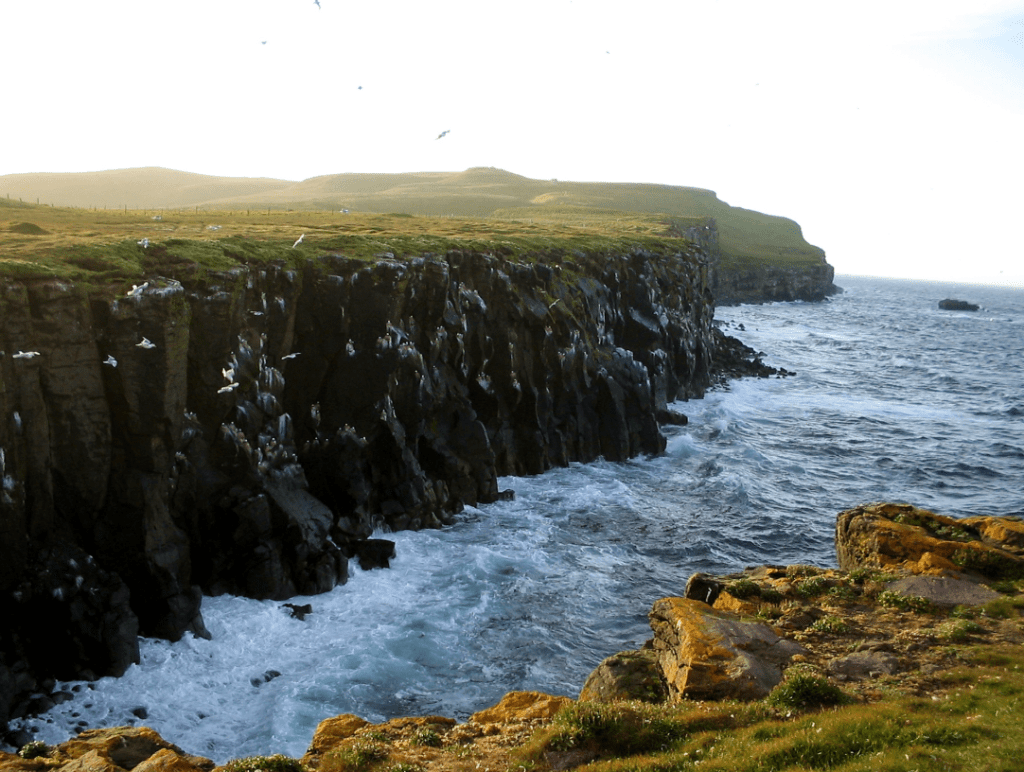
Grímsey is an inhabited island on the Arctic Circle. Its main industries are fishing and tourism(2).
Fig 2: Grímsey Cliffs. Cropped from an image by MosheA, published under CC BY-SA 2.5
Flatey is a small island in Skjálfandi Bay in northern Iceland. It is inhabited in the summer for the tourist season, being home to puffins, terns whimbrels and plovers, amongst others(3).
According to GVP(4) a submarine eruption occurred in 1868 on the Manareyjar Ridge, north of Manareyjar Island, at the south eastern end of the system; the lavas were basalt / picro basalt. A submarine eruption or dyke intrusion in 1999 caused an earthquake swarm 180km north of Grimsey and 100km north of Kolbeinsey Island on the Southern Kolbeinsey Ridge. Volcanic activity occurred in 1372 and 1755, but its whereabouts is unclear.
Seismic Activity
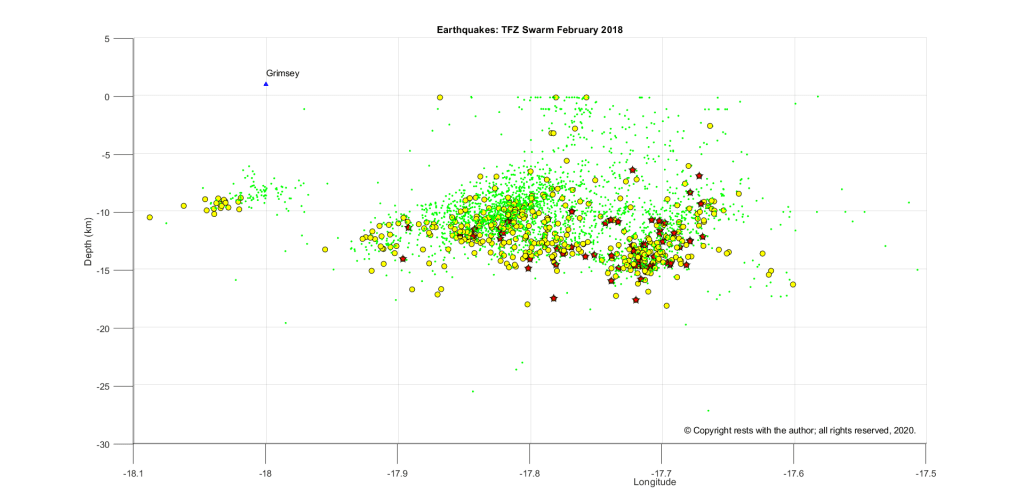
In the period from January 2016 to May 3, 2020, there were 26,762 earthquakes reported by the Icelandic Meteorological Office (IMO)(2) for the region. 131 earthquakes had a magnitude of 3.0 or more; 67 occurred in month 26 (February 2018) on the Skajálfandadujúp Rift, 52 miles ENE of Grímsey, the largest of which was 5.21M.
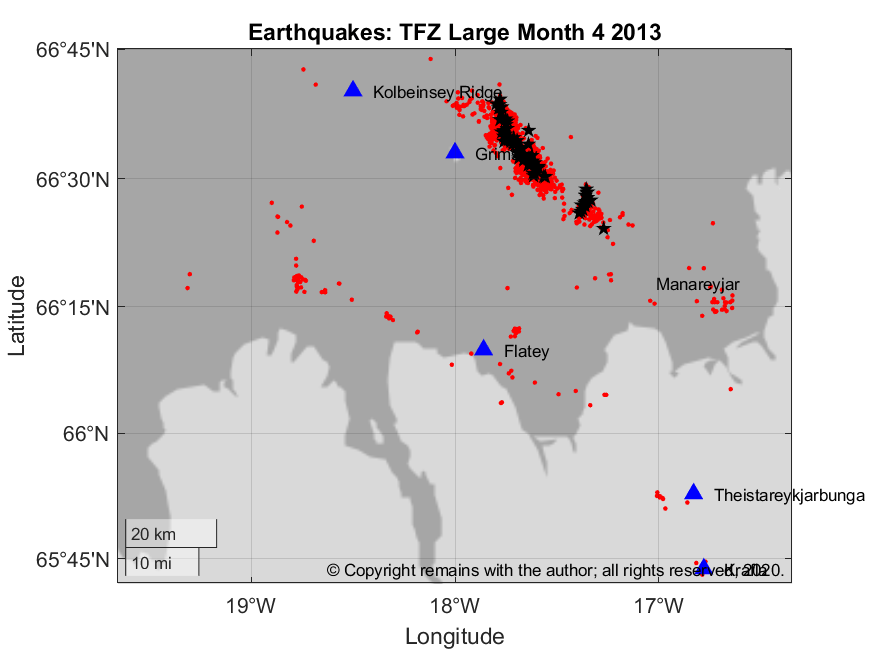
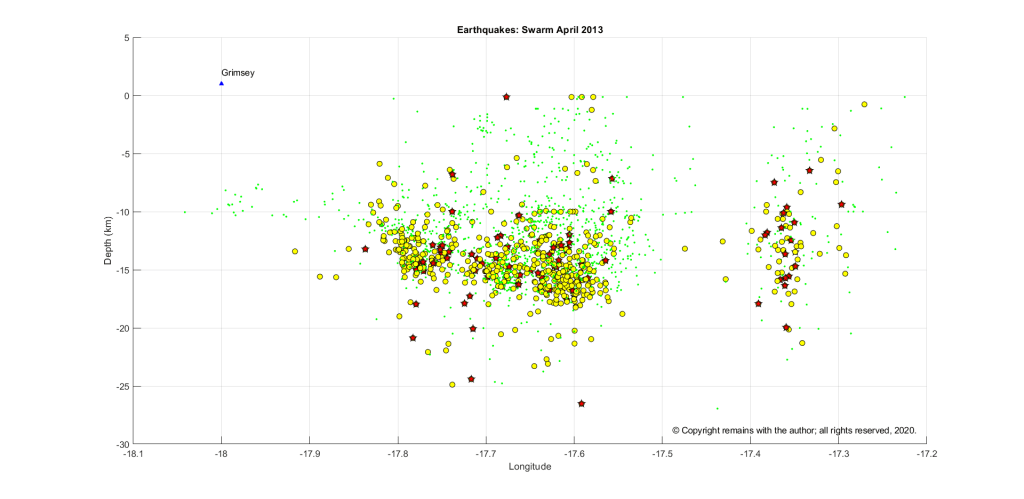
According to IMO, these swarms have occurred before; the most recent being in May & September 1969, December 1980, September 1988 and April 2013. The data for most of the earlier swarms is not publicly available on IMO’s website, but we can get data for the April 2013 swarm. In that swarm, there were 84 earthquakes with a magnitude of 3 or more; the largest of which had a magnitude of 5.37.
How does this compare to the activity on the Reykjanes Peninsula?
In the Tjörnes Fracture Zone, most seismic activity is occurring in the lithosphere. There is no reported volcanic activity associated with the two swarms we looked.
Apart from the recent large swarm, the Reykjanes Peninsula shows much less activity in the same period; again, most activity was in the lithosphere. The recent swarm, itself, was atypical (still ongoing at the time of writing, but at a reduced rate) and accompanied by ground uplift – hence the increased monitoring put in place there.
I am not Icelandic so apologies for any typos in Icelandic names.
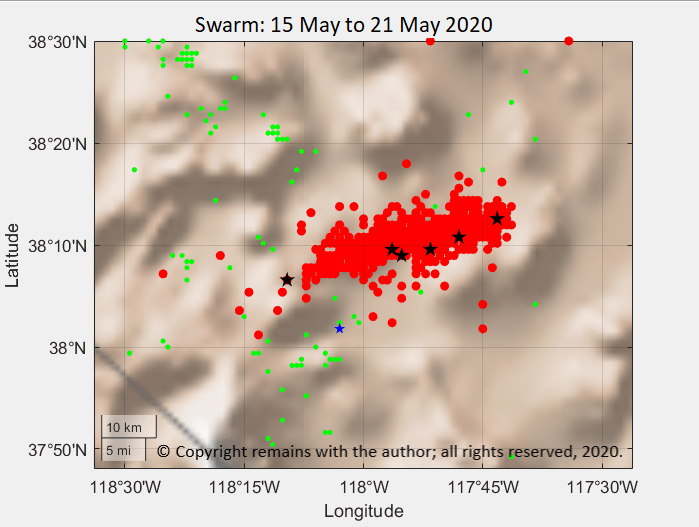
An earthquake of magnitude of 6.5, 56 km west of Tonopah, Nevada, started an earthquake swarm on 15 May 2020; at the time of writing there had been 1,032 quakes. Last year there was a large swarm to the south in the Eastern California Sheer Zone. This prompted me to take a look at earthquake activity in both California and Nevada.
The May 2020 swarm occurred in the Walker Lane Deformation Belt. According to USGS(1), this area has produced two dozen earthquakes with magnitude over 5.0M, mostly to the west and south. In December 1968, there was a 6.8M quake 50 km to the north; and, in January 1934, a 6.5M 40km to the north west.
Geological Setting
The North American Plate and Pacific Plates slide past each other at the San Andreas Fault(2) on the west coast of North America. There are small plates, the Gorda Plate(3) and Juan de Fuca Plates to the north of California, believed to be the remnants of the much larger Farallon Plate which subducted under the North American Plate.
The San Andreas Fault, a transform fault, accommodates 75+% of the relative motion between the North American and Pacific Plates. The Walker Lane Deformation Belt(4), itself, takes up between 15% to 25% of the boundary motion.
The Mendocino Fracture Zone(5) links the junction between the San Andreas Fault and Cascadia Subduction Zone to the Gorda Ridge on the western boundary of the Gorda Plate.
The Walker Lane Deformation Belt is a roughly 800km long trough, roughly aligned with the California / Nevada state border: the northern end lies at the junction of the Honey Lake Fault Zone, Warm Springs Valley Fault Zone, the Pyramid Lake Fault Zone and the southern boundaries of the Modoc Plateau and Columbia Plateau; and, the southern end lies at the intersection of Death Valley and the Garlock Fault.
The Eastern California shear zone is a portion of the Walker Lane Deformation Belt that links Owens Valley to the San Andreas Fault. It is an area that has produced several quakes of 7+M: 1872 Lone Pine quake in Owens Valley; 1992 Landers Earthquake; 1999 Hector Mine earthquake; and, most recently, the 2019 Ridgecrest swarm.
Seismic Activity 1975 to May 21, 2020
This swarm is not the first in the area. If we look at seismic activity in California and Nevada, we should see the activity from the Walker Lane Deformation Belt to the San Andreas Fault.
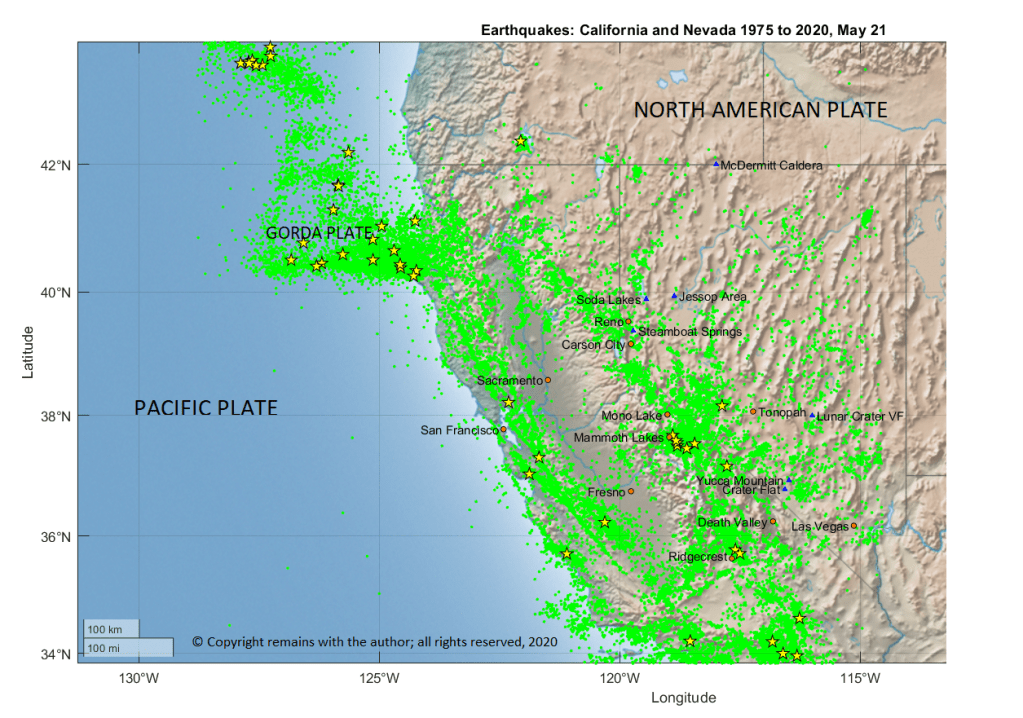
We downloaded earthquake data between 43.860°N, 128.786°W and 33.68°N, 114.548°W with magnitude over 2.5 from USGS’ site(1). In the plot below, we can see earthquakes clearly delineating the plate boundaries of the Gorda Plate, Pacific Plate and the North American Plate.
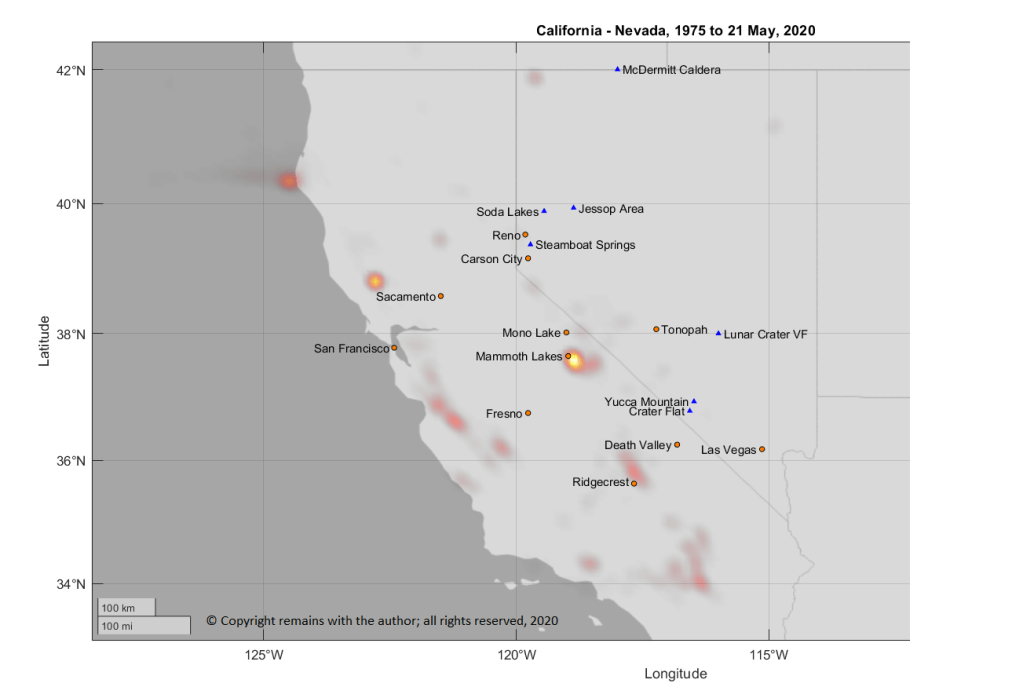
A geodensity plot of the above data set, weighted by earthquake magnitude, shows the areas of most activity: Mammoth Lakes, an area to the west of Sacramento, and the Mendocino Fracture Zone, east of the southern boundary of the Gorda Plate.
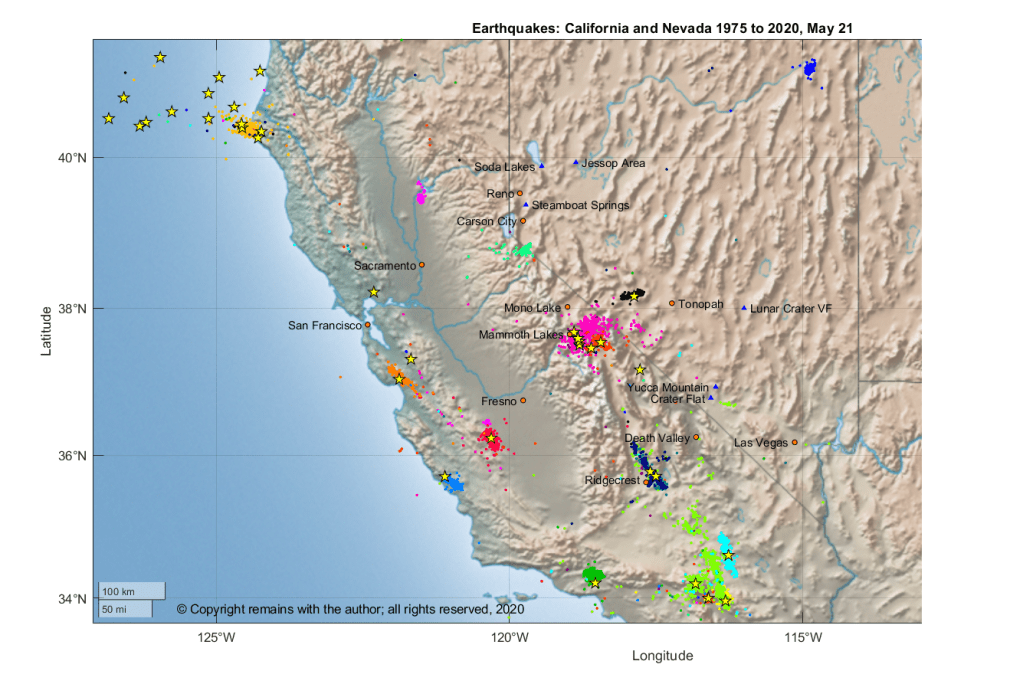
We looked through the data set to find the larger earthquake swarms; we found 17 swarms (groups of earthquakes exceeding 30 per day). With the exception of two swarms in April 1992, this was successful. In April 1992, there appears to be two swarms occurring at the same time so we split them based on geographic location.
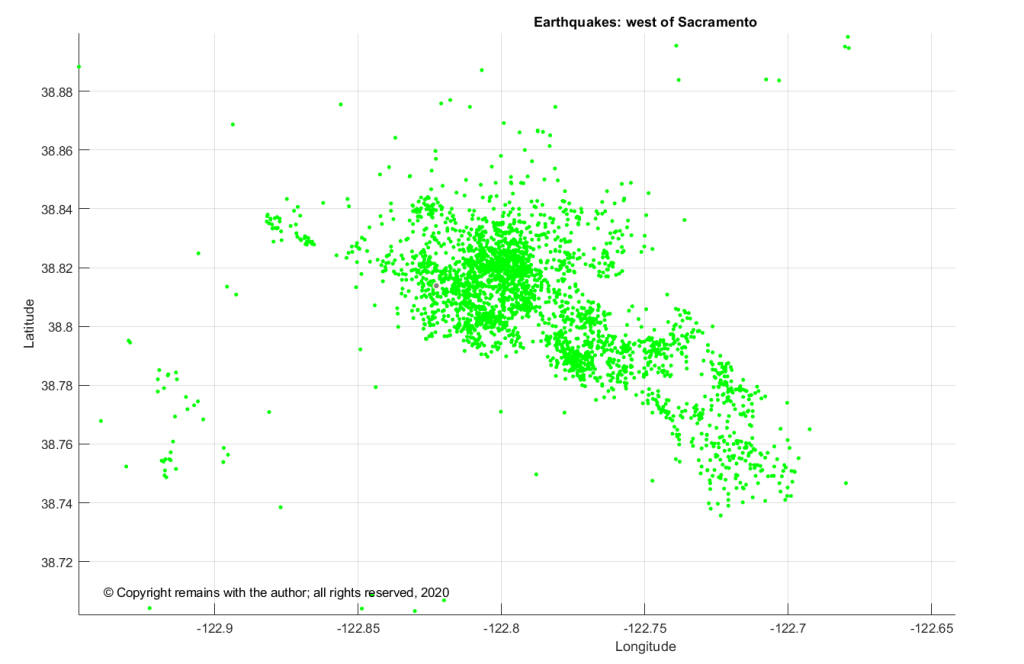
The swarms correlate with the areas of activity displayed in the geodensity plot, with the exception of the area to the west of Sacramento. The activity to the west of Sacramento has not experienced any large swarms or quakes over 6.0.
Mammoth Lakes(6) is located near the Long Valley Caldera and Mammoth Mountain, an area of rhyolitic, rhyodacite and dacite lava domes and hot springs. Mammoth Mountain last erupted around 700 years ago, with a small phreatic eruption, but still produces large volumes of CO2.
Looking more closely at the area to the west of Sacramento (38.74°N, 122.9°W to 38.86°N,122.7°W), we found that it has had 2,746 earthquakes spread consistently throughout the period from 1975 to May 21, 2020, of which the maximum magnitude was 5.01. the activity is located near Clear Lake(7), California, and the Clear Lake Volcanic Field. The Clear Lake Volcanic Field has not erupted for thousands of years but is not wholly inactive, with volcanic type earthquakes, hot springs and seepage of volcanic gas.
Although 44 years of earthquakes feels like a long period to study, this is a very short period of time geologically-speaking so any apparent trends may not be representative and, while very interesting and worthy of investigation, may not be enough for future predictions.
So how would geologists make predictions or update risk assessments? In addition to the type of work above, they would look at ground deformation and movement (the ground may stretch before fracturing), and, for volcanoes, volcanic gas emissions, and gravitational and temperature changes.
There has been a large earthquake swarm on the Reykjanes Peninsula over recent months, still ongoing at the time of writing, albeit with reduced intensity.
The Reykjanes Peninsula lies at the south west tip of Iceland on the Mid Atlantic Ridge, the boundary between the North American and Eurasian Plates. The North American Plate is moving westwards in relation to the Eurasian Plate; transform and extension faulting accommodate the relative Plate motions. The Reykjanes Volcanic Belt lies on the Reykjanes Peninsula, comprising five north east trending volcanic systems: Reykjanes, Svartsengi, Krýsuvík, Brennisteinsfjöll and Hengill. The volcanic systems are fissure swarms.
Earthquakes
The line of earthquake epicentres in Fig 1 shows the path of the Mid Atlantic Ridge. These earthquakes were extracted from the data set used to generate the plots in the earlier post introducing Iceland. The raw earthquake data is publicly available data downloaded from the Icelandic Meteorological Office for the period January 2016 to 12 April 2020. The plot above is still data-heavy (too much data to see what is happening) so I have extracted the earthquakes by month to see where and when most activity occurred.
In the plots there is an impression of seismic activity trending along the Peninsula from the east to the west. This impression is born out most strongly in the activity from month 48 onwards. Although it should be noted that the level of activity for these months is unusually high.
There are several possible reasons for the east to west trending of the earthquake swarms:
the plates do not move smoothly past each other, so friction generates faults and earthquakes;
rifting is occurring to accommodate the upward motion of land further to the east, generated by the mantle plume in the vicinity of Vatnajökull; and /or,
magma intrusion in local volcanoes.
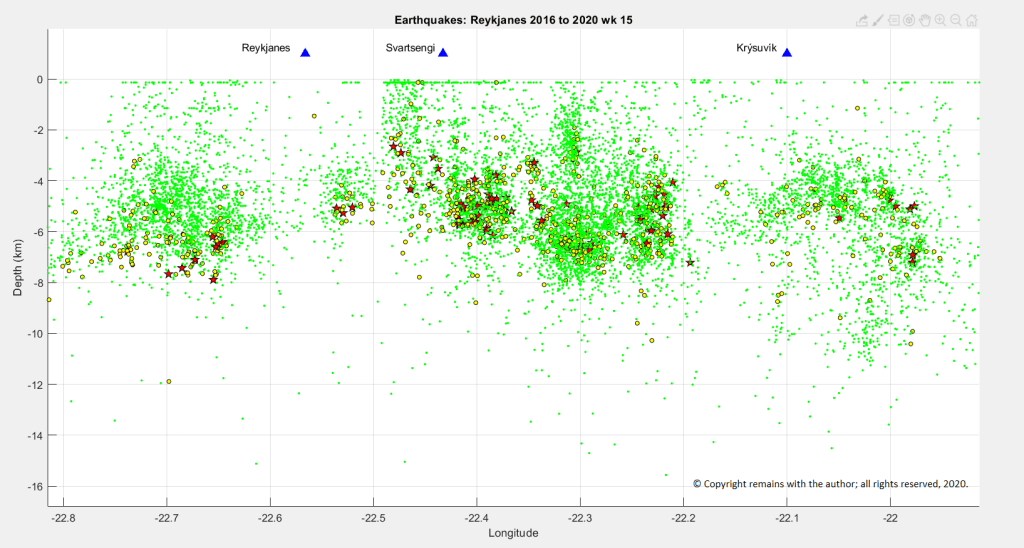
Let’s take a look at depth plots of earthquakes under the Reykjanes / Svartsengi area. This shows that the earthquakes over 3 M are largely in the lithosphere.
Plotting depth against longitude, effectively looking northwards through the swarms, also shows that most larger quakes are in the lithosphere but some over 2 M track towards the surface. On its own, this is not enough to draw any conclusions over the likelihood of an eruption; field observations, including gas emissions and ground deformation are required to determine how close to the surface magma may be.
These swarms were accompanied by local uplift, as shown by local GPS stations.
Fig 9: Uplift in the vicinity of Mt Thorbjörn as shown in recent GPS plots published by IMO: https://en.vedur.is/. THOB moved south eastwards and ELDC moved westward; both showed uplift.
IMO(3) has reported that the most likely explanation for the recent swarms and uplift is a magma intrusion near Mt Thorbjörn at depth; Mt Thorbjorn is located near the Blue Lagoon, Svartsengi. As to whether or not magma will reach the surface for an eruption and where it emerges, we will have to wait and see. In the meantime, let’s look at the recent activity in historical times.
Historic Volcanic Activity
As noted earlier, the volcanic systems are fissure swarms. Activity is driven by rifting which enables magma to reach the surface. The most recent onshore volcanic activity took place between 940 AD and 1340 AD; later activity has been offshore. Onshore lavas from these eruptions tend to be tholeiitic basalts (1). The systems are still active as demonstrated by current geothermal activity.
Hengill
Fig 10: Image cropped from one by Hansueli Krapf, published under cc licence: CC BY-SA 3.0
The Hengill volcanic system is a series of fissure vents, crater rows and small shield volcanoes, with a highest point of 803m. It lies at the triple junction of the Reykjanes Peninsula volcanic zone, the Western volcanic zone and the South Iceland seismic zone. The lava types are basalt / picro-basalt, andesite / basaltic andesite and rhyolite. Hengill’s lavas are more complex that those to the west, reflecting its position at the triple junction. GVP(2) lists 13 Holocene eruptions ranging between VEI 0 and VEI 2; the last known eruption was a VEI 2 in 150 AD.
Brennisteinsfjöll
The Brennisteinsfjöll volcanic system is a series of crater rows and small shield volcanoes, with a highest point of 610m. Its lava types are basalt / picro-basalt. GVP(2) lists 9 Holocene eruptions ranging between VEI 0 and VEI 2. One eruption, previously attributed to Hengill, occurred during a meeting of the Icelandic parliament at Thingvellier in 1000 AD. The most recent eruption was a VEI 2 in 1341.
Krýsuvík
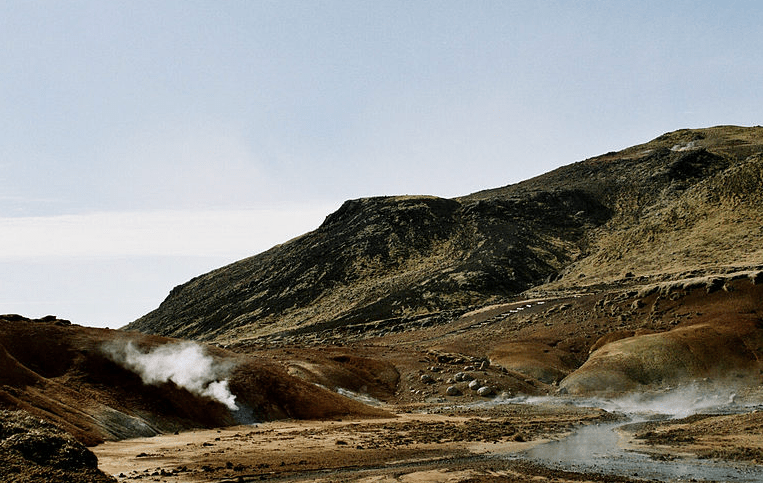
Fig 11: Image cropped from one by Reykholt, published under creative commons licence: CC BY-SA 3.0
The Krýsuvík volcanic system is a series of crater rows and small shield volcanoes, with a highest point of 360m. Like Brennisteinsfjöll, its lava types are basalt / picro-basalt. GVP(2) lists 11 Holocene eruptions ranging from VEI 0 to VEI 2; the most recent of which was in 1340. The Krýsuvík Fires spanned a period between 1151 and 1188, producing 36 km2 of lava.
Reykjanes & Svartsengi
Fig 12: Image of Svartsengi Power Station from one by Jóhann Heiðar Árnason, published under creative commons licence: CC BY-SA 3.0
The Reykjanes volcanic system is a series of crater rows and small shield volcanoes, which extends offshore and includes several small islands. Reykjanes highest point is 140m. The Reykjaneshryggur volcanic system is a submarine system which is considered part of Reykjanes. GVP includes Svartsengi as a crater row of Reykjanes. Reykjanes lava types are basalt / picro-basalt. GVP(2) lists 22 Holocene eruptions ranging between VEI 0 and VEI 4, of which the most recent was a VEI 0 in 1970; the VEI 4 was in 1226. The 1226 eruption was part of the Reykjanes Fires which started in 1210 and lasted until 1240.
The area is one that has had a period of intense volcanic activity, so the recent earthquake swarms have generated a lot of interest.
Regular updates on seismic and volcanic activity in Iceland are published by the Icelandic Meteorological Office(3).
The Armchair Volcanologist
14 May 2020
References & Further Reading:
David W Peate, Joel A. Baker, Sveinn P. Jakobsson, Tod E. Waight, Adam J. R. Kent, Nathalie V. Grassineau, Anna Cecile Skovgaard , 2009. “Historic Magmatism on the Reykjanes Peninsula”, Contrib Mineral Petrol (2009) 157:359-382
Smithsonian Institution Natural History Museum Global Volcanism Program (GVP): https://volcano.si.edu
This is a test post as a starter for my blog. I hope you find this and later posts interesting.
Iceland, home to Eyjafjalljökull and Grimsvötn, whose eruptions in 2010 and 2011, resp., disrupted European airspace, is recommended as a great place to study volcanology, with many types of volcanic activity and relatively easily accessible. It is also a great holiday destination, not that I have been privileged enough to visit.
Iceland, located between 67.2°N 23.0°W and 63.0°N 13.0°W, has an area of 103,000 km2 and a population of 364,000. Lying on both the North American Plate and the Eurasian Plate, it is the only large surface expression of the MAR where its volcanic activity can be easily studied by field volcanologists. Iceland, itself, was formed from magma and accretion.
The Mid Atlantic Ridge in the northern hemisphere is the boundary the North American Plate and the Eurasian Plates. As the plates separate, the ridge widens and allows rising magma to come to the surface. The magma rises under its own buoyancy; hotter magma is less dense than the colder surrounding rock.
In addition to the MAR, the Icelandic Hotspot, a mantle plume, contributes to both plate separation and volcanic activity. The Iceland Plateau, itself, is a large basaltic igneous province. The plume head is thought to be located in the region of the Vatnajökull icecap.
The MAR crosses Iceland in a series of transform and extensional faults, starting at the Reykjanes Peninsula in the south west to the Tjörnes Fracture Zone in the north. Plotting the earthquakes reported by the Icelandic Meteorological Office (IMO) from January 2016 to 12 April 2020 shows the path of the MAR.
If we take a look at a three-dimensional plot of the same earthquake looking from the south, we can see that there are deeper earthquakes under the volcanic regions Myrdalsjökull and Vatnajökull.
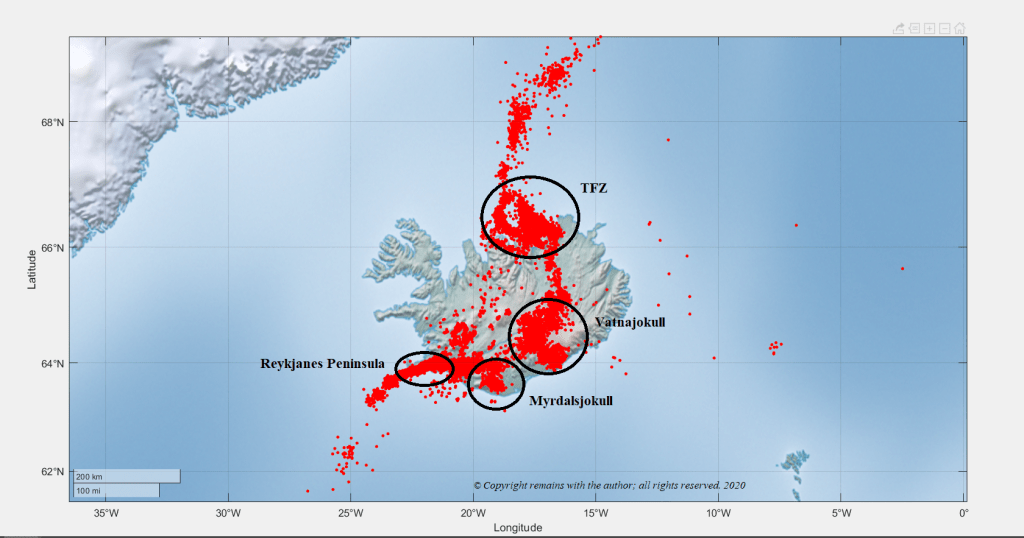
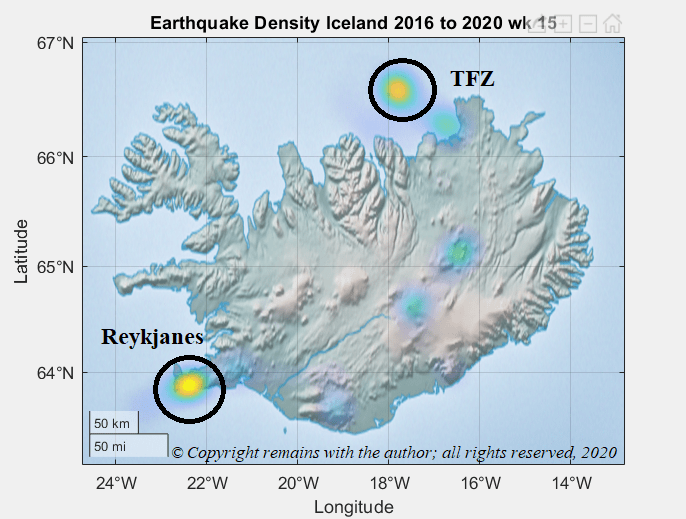
A geodensity plot of the same earthquakes, weighted by magnitude, shows most activity (yellow areas) at the western end of the Reykjanes Peninsula and on the Tjörnes Fracture Zone to the north. Other areas of interest are Myrdalsjökull (Katla), Vatnajökull (Barðabunga) and Herðubreið.
Iceland is often touted as having every form of volcanism going but it does not have an obvious active subduction zone; eruptions tend to be associated with fissures. Not to worry, Iceland has many active volcanoes, including: Askja, Bárðabunga, Eyjafjalljökull, Katla, Grimsvötn, Hekla and Surtsey – plenty to offer us in terms of volcanic and seismic activity.
Our plot is data-heavy (in the region of 104,000 earthquakes) so we cannot see much more without further analysis. We will look at each volcanic region in turn in later posts.
Thank you for reading this and I look forward to sharing the next post with you.


