On 28th July 2026 a 7.1 magnitude (USGS 6.8 magnitude) earthquake struck Uto, south of Kumamoto, Kyushu. At the time of writing, 34 fatalities had been reported, with 123 injured and 9,000 people displaced. The earthquake was widely felt, including as far afield as China. In 2016 the area was hit by three large earthquakes: a 6.2 and 6.0, followed by a 7.0 the following day. Our thoughts are with the victims, their families and friends, and everyone else impacted.
Shinichi Sakai, from the Earthquake Research Institute, University of Tokyo, has said that the earthquake may have been caused by slip on the southern portion of the Hinagu Fault. During the 2016 Kumamoto earthquakes, only the northern extent of the Hinagu Fault slipped. The Hinagu Fault is located in the southern section of Futagawa-Hinagu fault zone, the Futugawa Fault to the north. This fault zone lies at the southern end of the Japan Median Tectonic Line, Japan’s longest fault system, which begins near Ibaraki Prefecture on the Pacific coast of Honshu and runs parallel to Japan’s volcanic arc to Kyūshū.

The Geospatial Information Authority of Japan reported ground deformation: in Yatsushiro, the Sencho geographic reference point was displaced 0.84 m (2 ft 9 in) northeast, and the Izumi station recorded a 0.17 m (6.7 in) movement southward; in Kumamoto, the Jonan station recorded 0.4 m (1 ft 4 in) of displacement to the north. Surface ruptures along the Hinagu Fault damaged roads, bridges, and buildings.
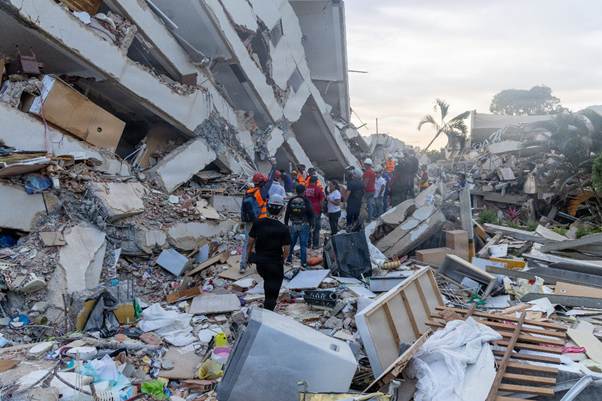
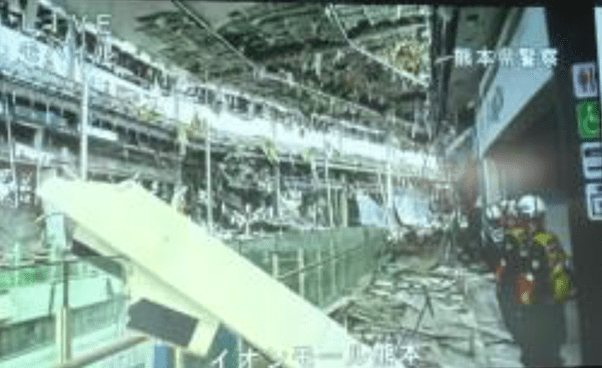
Some of the fatalities and injuries were caused by the collapse of the second floor of Aeon Mall Kumamoto, followed by an explosion; a factory chimney, part of the 19th century Yatsushiro-gūshrine and part of bridge collapsed in Yatsushiro; fires were also reported in Yatsushiro. Damage to rail infrastructure occurred; a freight train derailed near Yatsushiro Station; there were more than 200 reports of snapped rails and collapsed sound barriers; bent rails were reported at a train depot in Kumamoto and between Matsubashi and Ogawa stations on the Kagoshima Main Line. Landslides occurred on Mount Mayuyama. 48,300 homes lost power in Kumamoto Prefecture; businesses were also impacted. Kumamoto Castle, which was undergoing restoration work following the 2016 Kumamoto earthquakes, was extensively damaged.
Tectonic Setting
The Japanese Archipelago comprises 5 main islands, Hokkaido, Honshu, Shikoku, Kyushu and Okinawa. and c.14,000 smaller islands. Its geology is dominated by the subduction of the Pacific Plate in the north and the subduction of the Philippine Sea Plate in the south. Japan is seismically very active and home to c.100 active volcanoes.
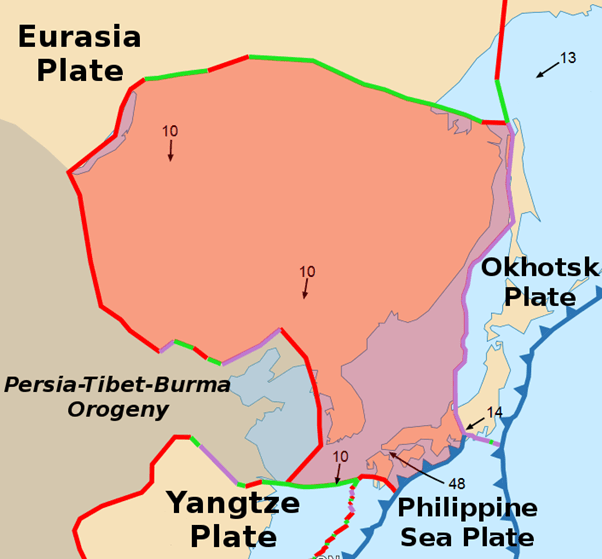
Kyushu Island, itself, lies on the rift boundary between the Amur and Okinawa Plate to the west of the subduction of the Philippine Sea Place under these plates.
The Amur Plate is a small tectonic plate located on the eastern edge of the Eurasian Plate. It has clearly defined boundaries on the the south by the Qinling suture zone in central China and the Baikal Rift Zone and Stanovoy Mountains on the north. The eastern boundary is with the Okhotsk Plate. The plate is moving anti-clockwise, according to GPS measurements.
The Okinawa Plate is another small continental tectonic plate. To its north is the Amur Plate. On its eastern margin the Philippine Sea Plate subducts at the Ryuku Trench. On its western edge there a divergent boundary with the Yangstze Plate.
The Philippine Sea Plate, comprising oceanic lithosphere, lies beneath the Philippine Sea, to the east of the Philippines. The Philippine Sea plate, the Amur Plate, and the Okhotsk plate meet near Mount Fuji in Japan.
Seismicity
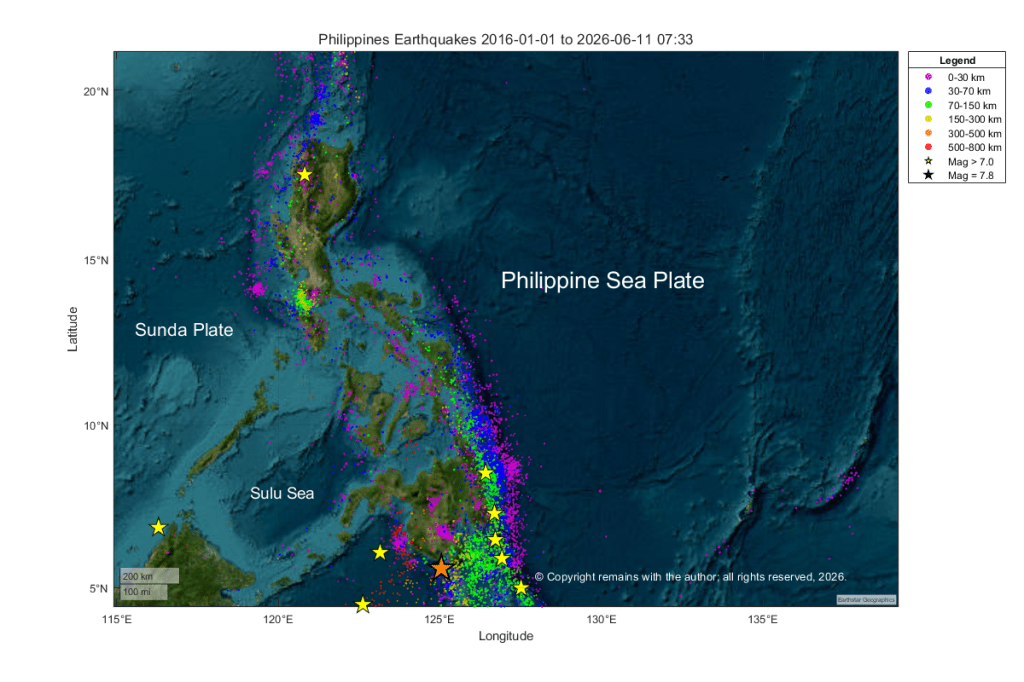
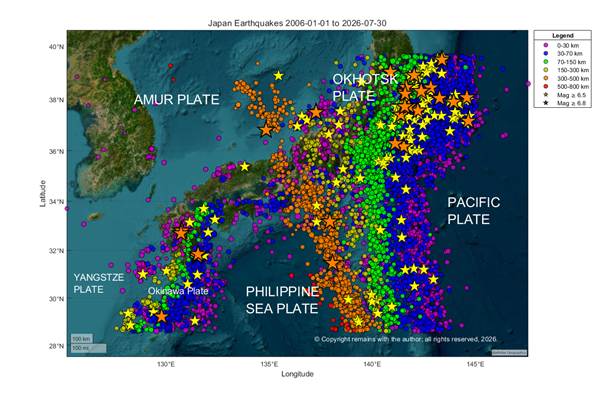
We plotted earthquakes occurring from 1st January 2006 to 30th July 2026 10:00am between 39.63°N, 153.14°E to 28.60°N, 124.75°E. Our download from USGS contained 17,396 events. The plots clearly show the subduction zones.
Thank you for visiting.
Armchair Volcanologist
© Copyright remains with the author, all rights reserved, 2026.
Sources:
USGS for raw earthquake data: Earthquake Hazards Program | U.S. Geological Survey
Wikipedia: 2026 Kumamoto earthquake – Wikipedia