After a long period of absence to care for a sick relative, we are back.
A lot has happened in the interim in terms of volcanic and seismic activity globally. So a lot of catching up to do.
We are starting by looking at Iceland. The Icelandic Met Office (IMO) (https://en.vedur.is/) has changed its earthquake monitoring system from its SIL system to SeisComP to make monitoring easier. In the process they have updated Skjálftalísa (https://skjalftalisa.vedur.is/) which we use to download earthquake data. This makes it easier to select data. It also has a 3D plotting capability for those who do not have the time or software to be able to do it themselves. Our thanks to IMO.
Our new post on the seismic activity on the Reykjanes Peninsula will be up shortly.
The earthquake swarm is continuing as we write, although he magnitude of earthquakes has reduced. As the uncertainty continues, our thoughts are with those required to evacuate Grindavík, those supporting them, the Department of Civil Defence, and the scientists and others monitoring the activity.
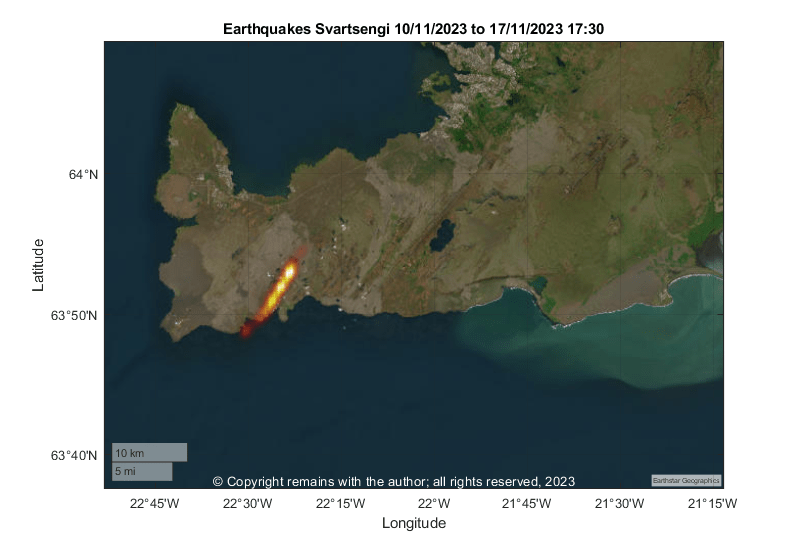
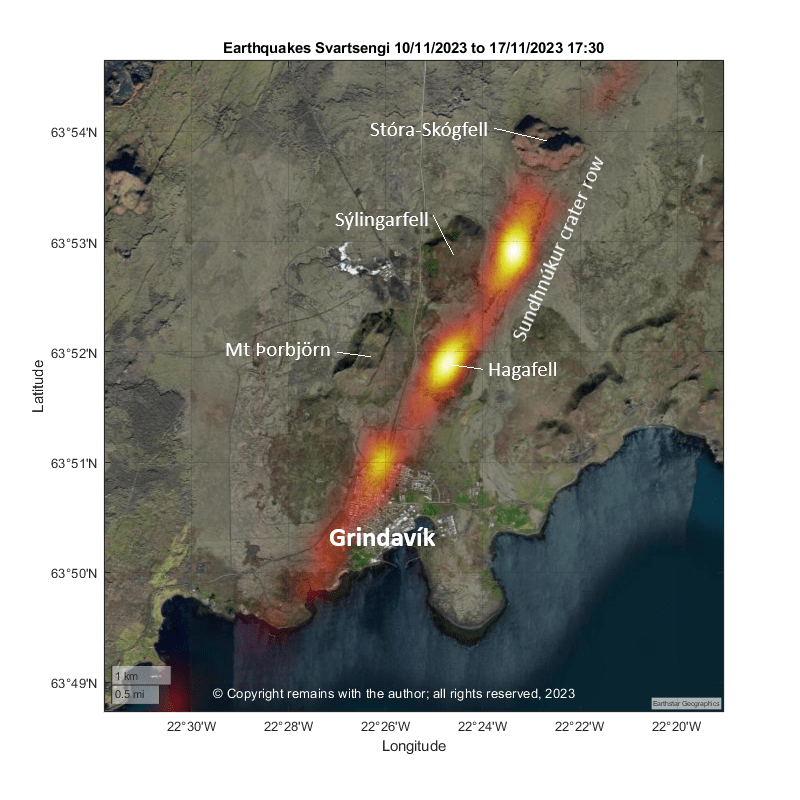
According to IMO, ground deformation is continuing at a slower rate. It is thought that if an eruption occurs, it is most likely to be in the region of Hagafell. Yesterday, sulphur dioxide was detected in a borehole at Svartsengi located north of Mt Þorbjörn. The borehole extends eastwards towards the Sundhnúkur crater row, close to the where the magma intrusion is. This is considered evidence of magma north of Hagafell. The possibility of an eruption is still considered high.
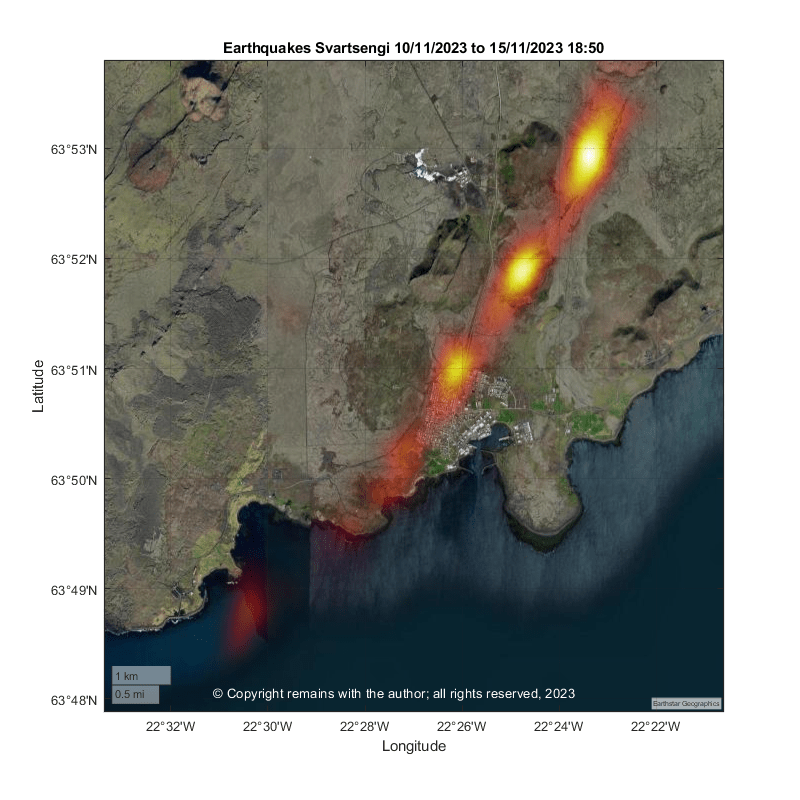
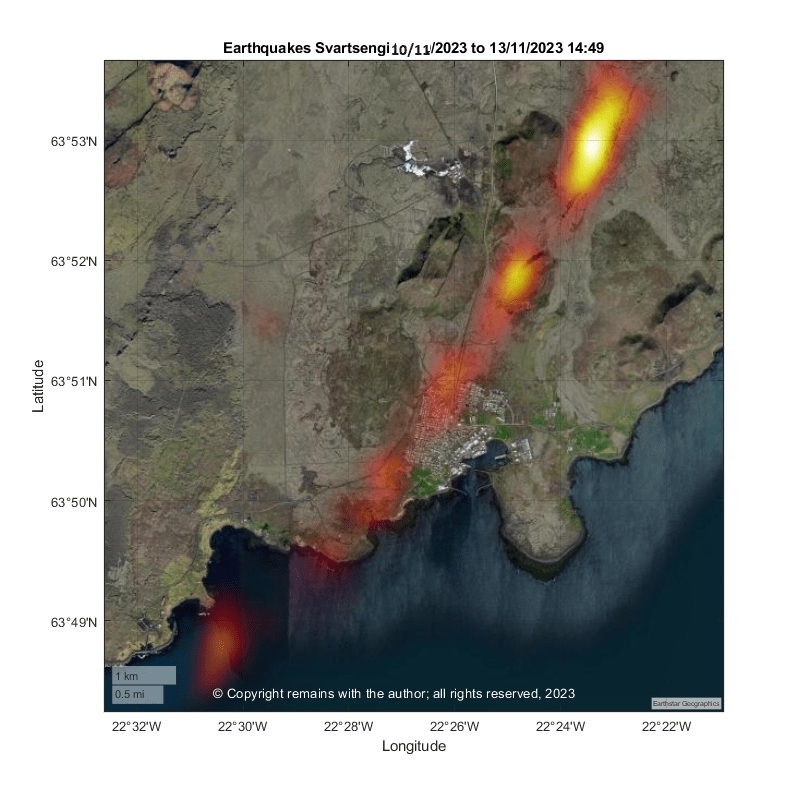
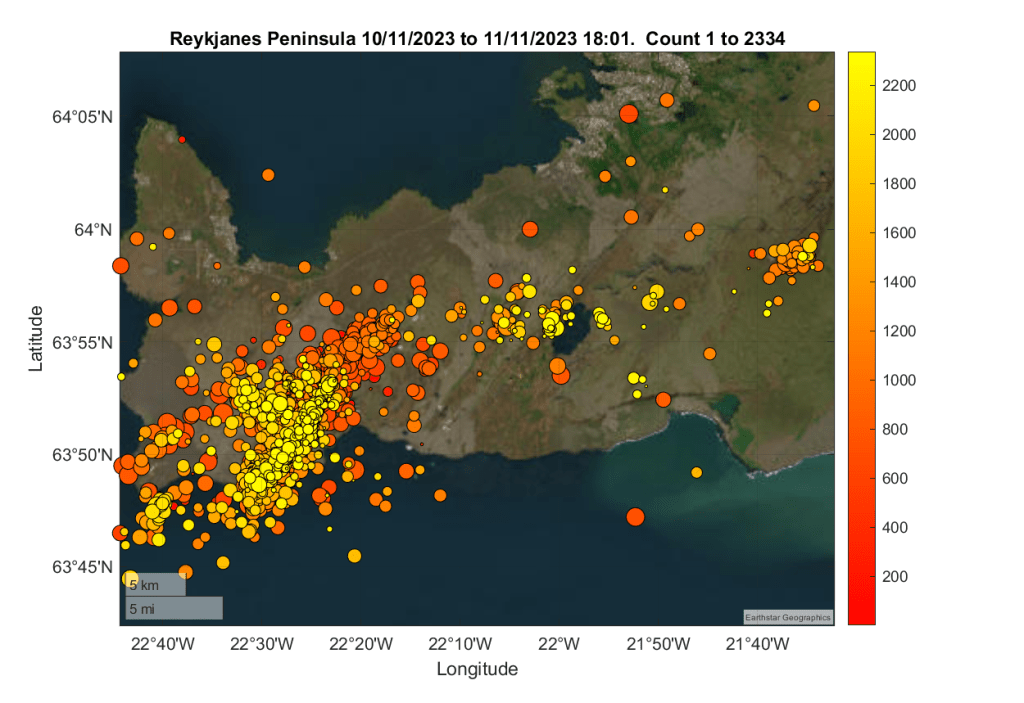
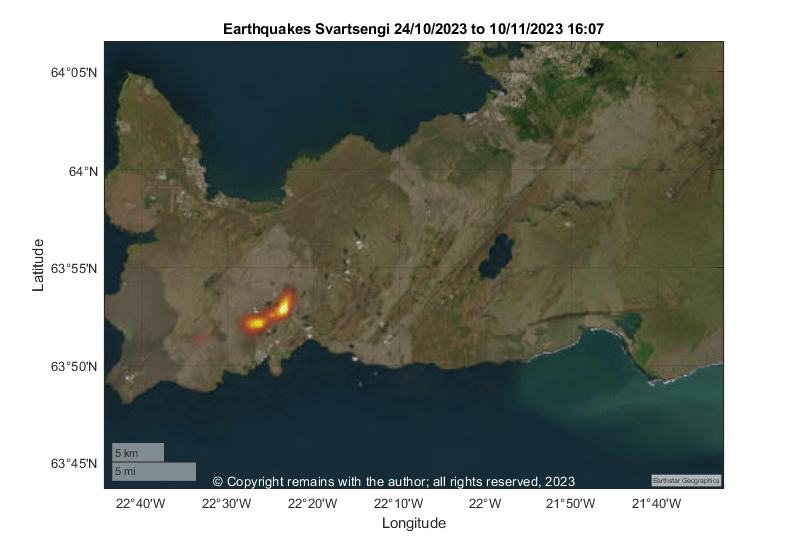
If we ccompare the locations to our geodensity plots (ref. Fig 31 below), the areas of most seismic activity are located at the Sundhnúkur crater row, Hagafell and northwest Grindavík. The geodensity plots are often good predictors of where an eruption will occur. However, with three current seismic hot spots, the situation is not clear at the moment. If an eruption occurs, the precise location(s) will depend on where weak spots allow magma through.
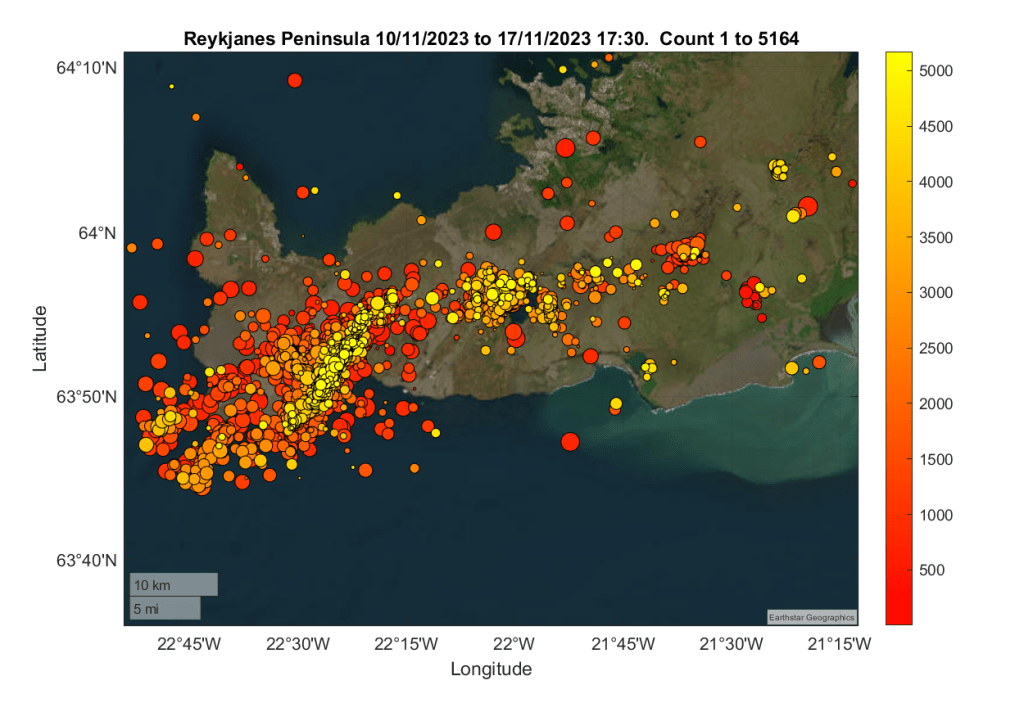
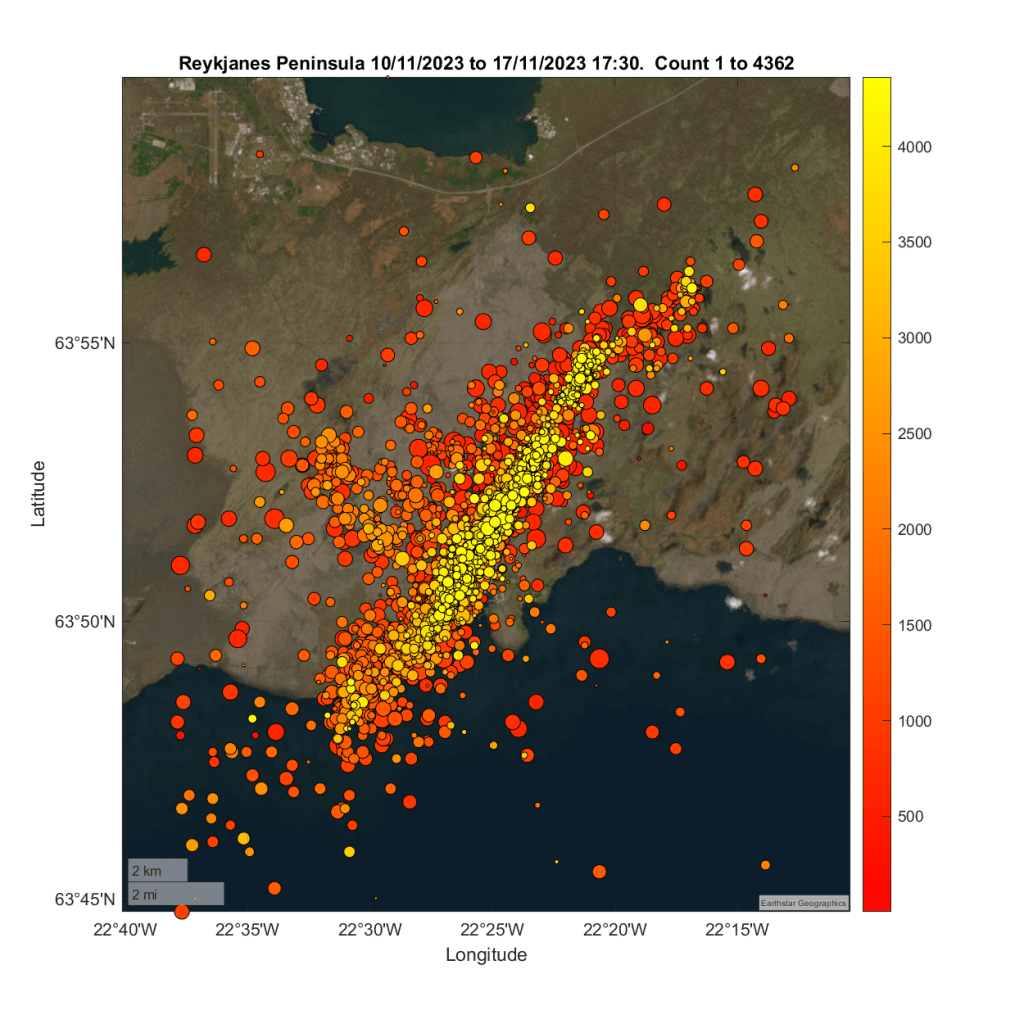
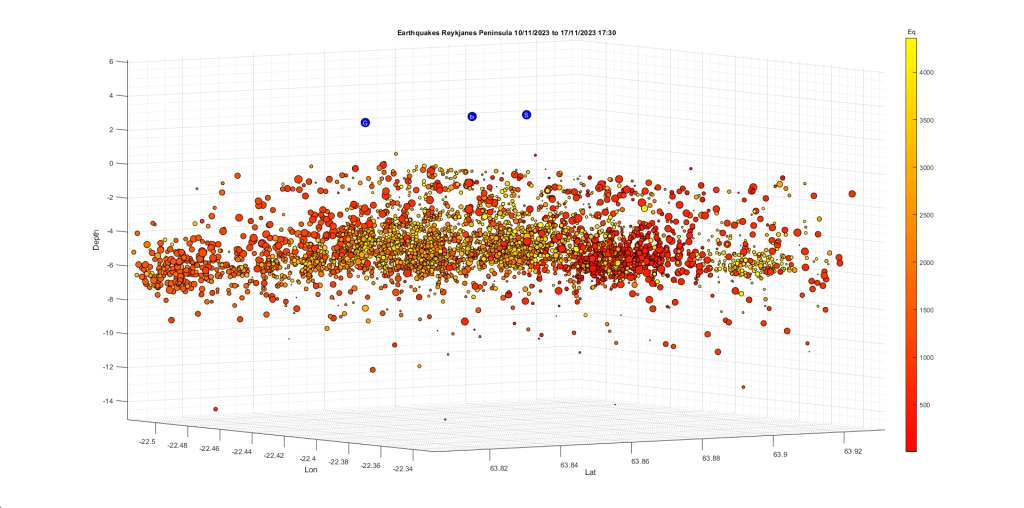
Our updated earthquake plots are below. The data source is as below.
Seismic activity is occurring along the dike and also at Krýsuvík.
The earthquake swarm continues as we write. The intensity has lessened, and the size of the earthquakes decreased. The probability of an eruption is still considered high.
According to IMO, most monitoring is focussing on the dike formation and Grindavík. Ground deformation is consistent with magma flowing into the dike. Part of the magma may be solidifying at the edges of the dike. Magma inflow is thought to be near Sundhnúk. SO2 measurements show fluctuating degassing associated with the dike. Magma may have come within 500m of the surface. The sink hole which opened in Grindavík continues to widen.
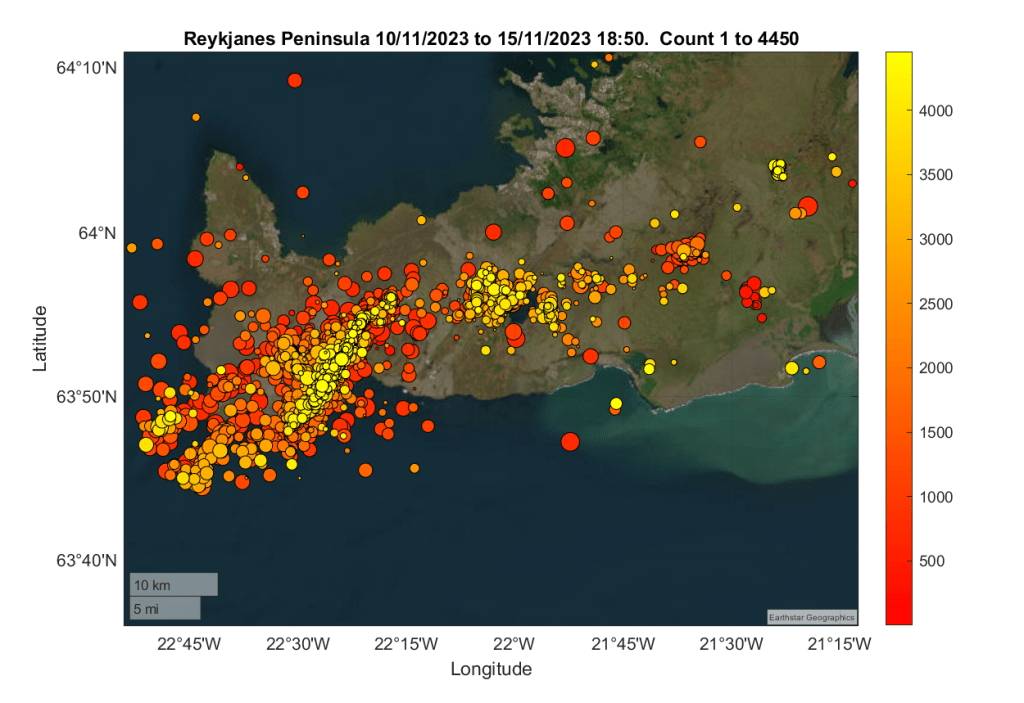
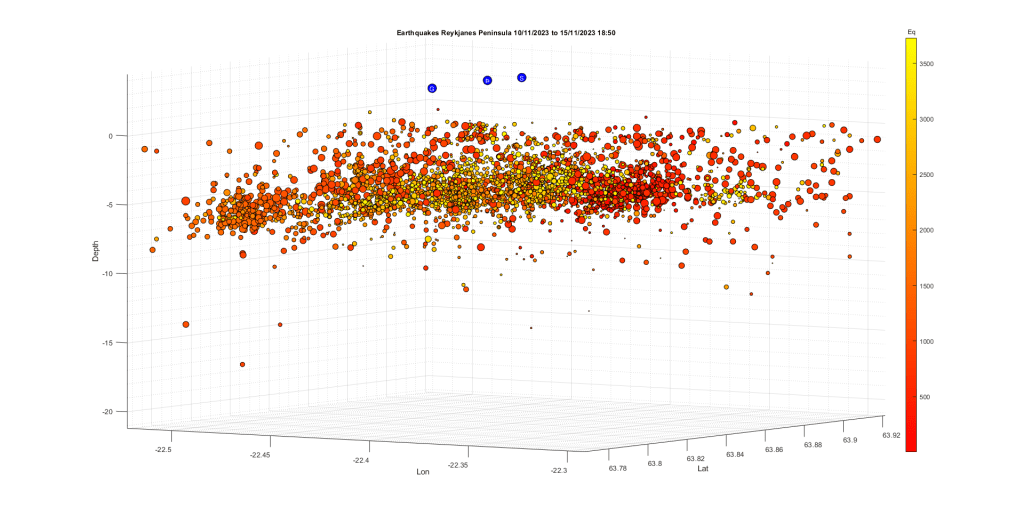
We have updated our earthquake plots to 18:50 today.
The most recent earthquakes occur along the dike, and at Krýsuvík. We do not understand the relationship between Fagradalsfjall and activity further west, other we have observed than activity at Krýsuvík usually precedes activity west of it. Frustrating not to be a geologist!
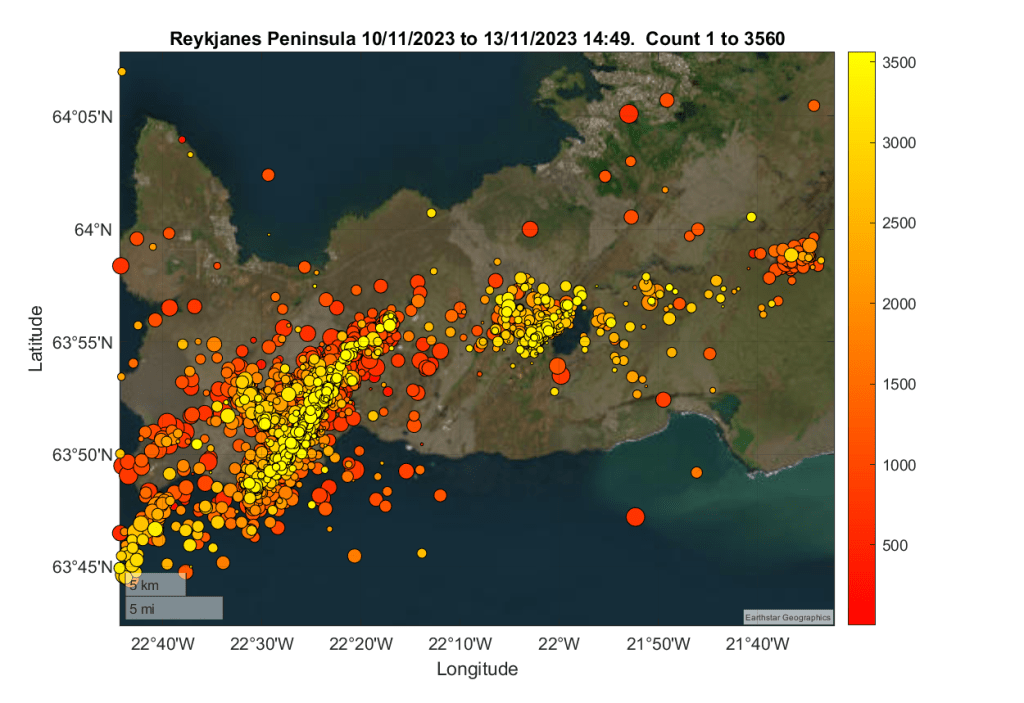
Correction: Fig 20 is for the period 10th November to 13th November (Error was in the image title, not the caption. The plot, itself, is unchanged). Apologies for any inconvenience.
The earthquake swarm continues as we write. The intensity has lessened, and the size of the earthquakes decreased, most probably reflecting the fact that magma has reached less brittle rock layers nearer the surface. Scientists have said the magma inflow has lessened, seismic activity is between depths of 2km and 5km but there is no change in the assessment of the likelihood of an eruption.
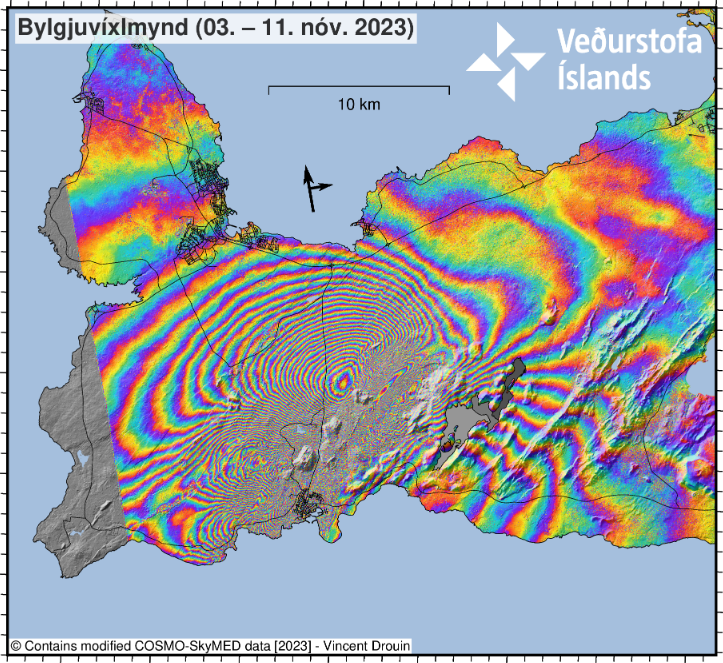
The InSAR image showing the formation of the possible graben running through part of Grindavík has been published on IMO’s site today. The sudden formation of the graben on Friday night led to the evacuation of Grindavík. Local news sources have images of the damage done to roads and property.
Fig 15: InSAR image showing ground displacement caused by seismic activity between 3rd November 2023 and 11th November 2023. Source: IMO
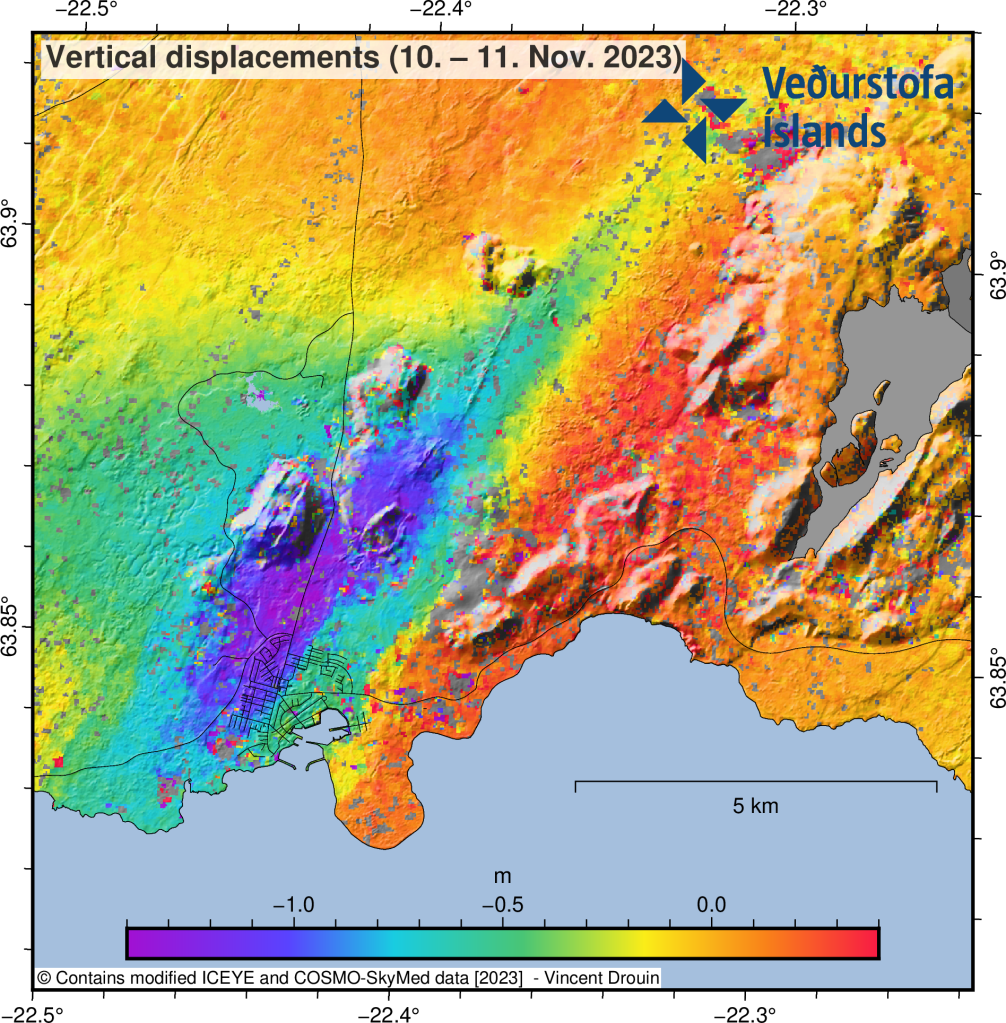
Fig 16: Estimate of the vertical displacements caused by the dike during its initial propagation from Friday afternoon to Saturday morning. The displacements were estimated by combining ICEYE and COSMO-SkyMed pixel offset tracking results. Source: IMO.
We have updated our earthquake plots for the swarm from 10th November 2023 to 13th November 2023 14:49. We used the earthquakes published on Whole Country (vedur.is) for the Reykjanes Peninsula with a quality of over 90%., a total of 3,560 earthquakes. We may have picked up some ghosts and other errors (confirmed earthquakes have a quality of 99%) but we believe that this will give a rough idea of what is going on.
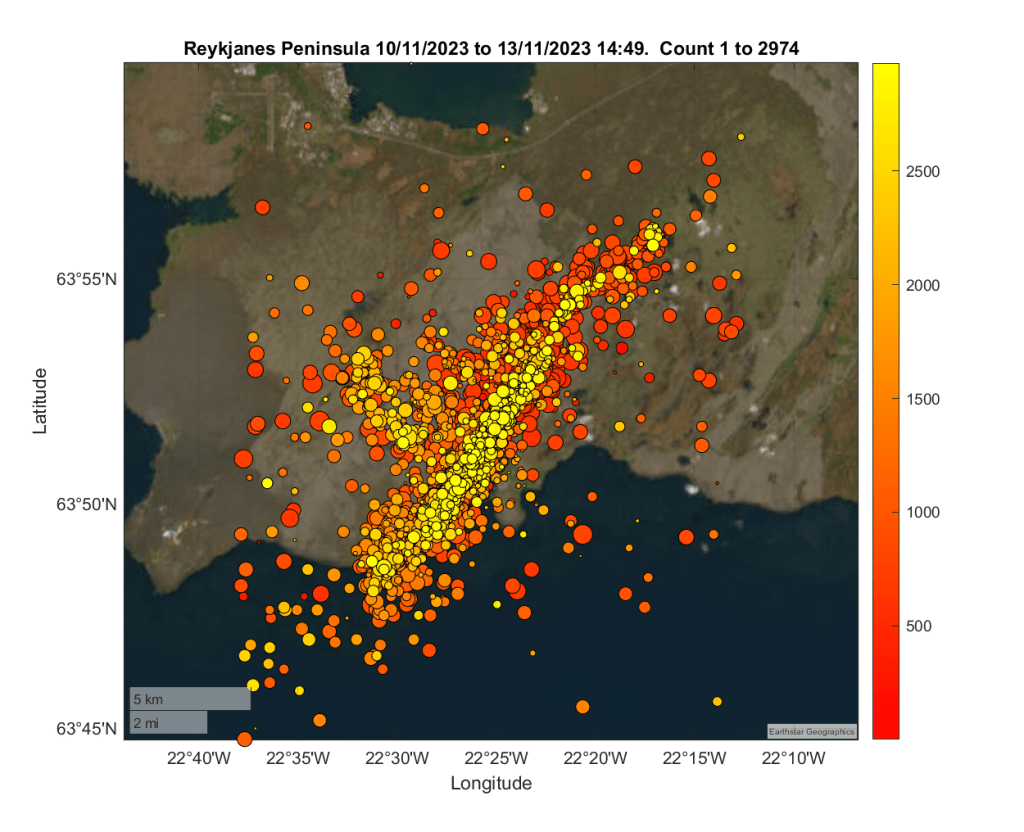
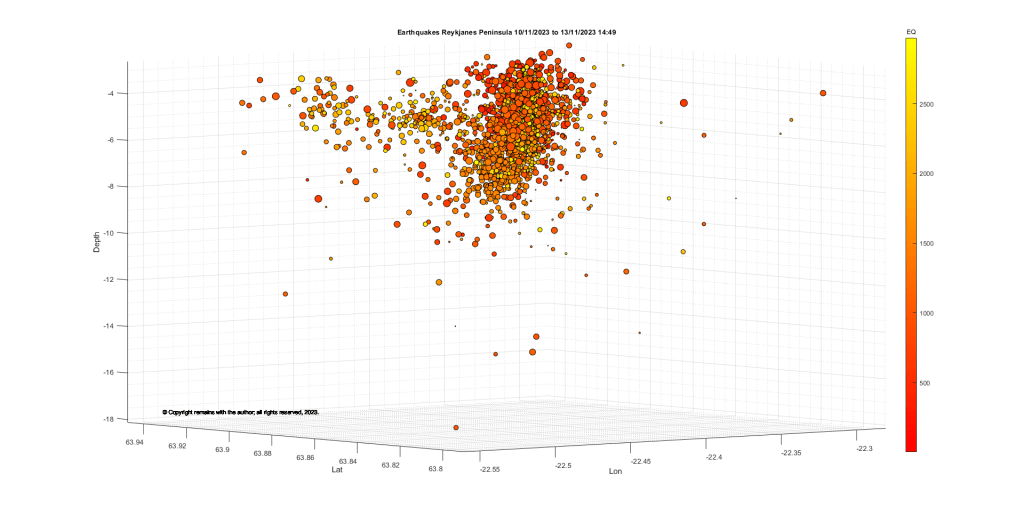
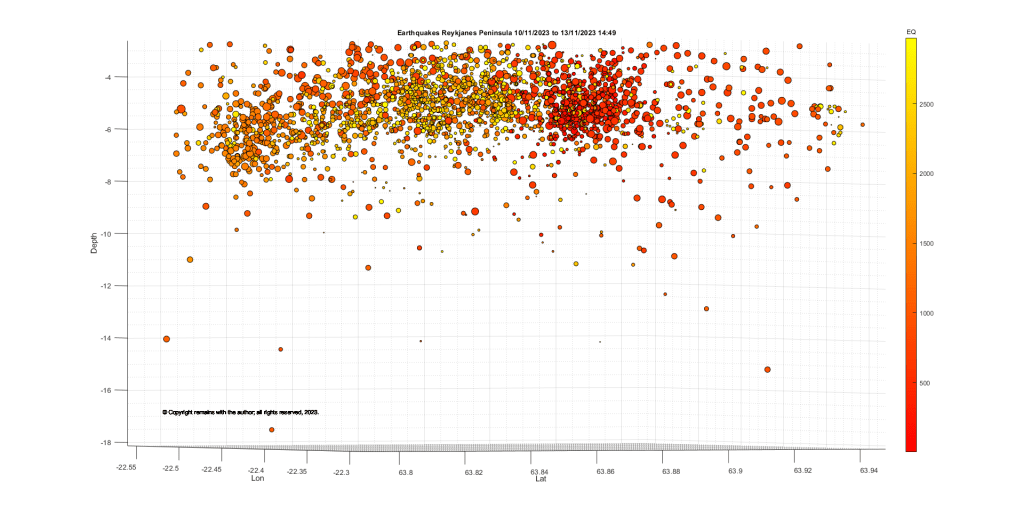
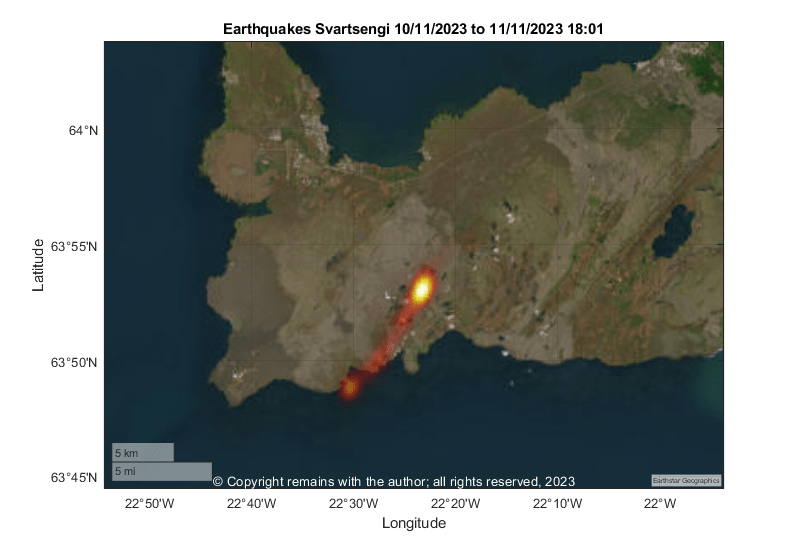
Our 3D scatter plots for the above seismic activity covered too big an area to look at the formation. We extracted earthquakes between 63.746°N, 22.211°W and 63.996°N, 22.631°W, a total of 2,974 earthquakes. For the 3D scatter plots only we removed a small earthquake with a depth of more than 40 km from the data set as it distorted the scale of the plots too much.
IMO reported this evening that there is a significant likelihood of a volcanic eruption in the coming days.
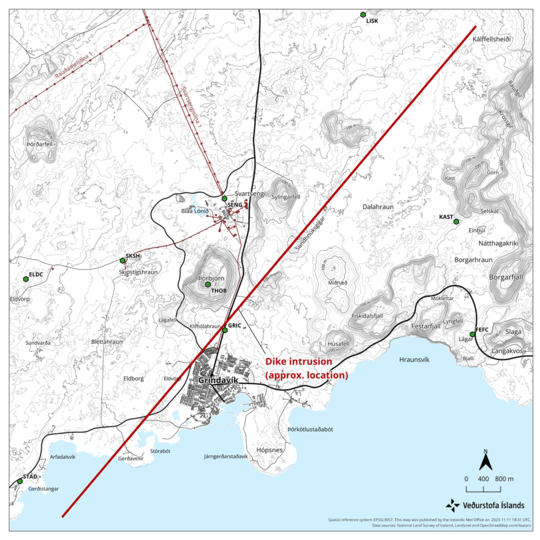
Modelling based on ground deformation and seismicity by scientists at IMO and the University of Iceland shows that there is a 15km long magma intrusion located northwest of Grindavík. The intrusion stretches from Kálffellsheiði, northeast of Grindavík, to offshore southwest of Grindavík.
Magma has ascended to 800m below the surface. Where and when an eruption will occur cannot be predicted now – other than to say that it would most likely be in the vicinity of the intrusion, if it occurs.
Fig 12 Map showing the location of the dike intrusion based on combined satellite radar imagery, GPS measurements, and geophysical modelling. Source: IMO
Since our original post below, events have moved on. The town of Grindavík was evacuated overnight when it became apparent that a dike could be forming under the town. The Svartsengi Power Plant will be operated remotely.
The swarm has continued relentlessly since yesterday.
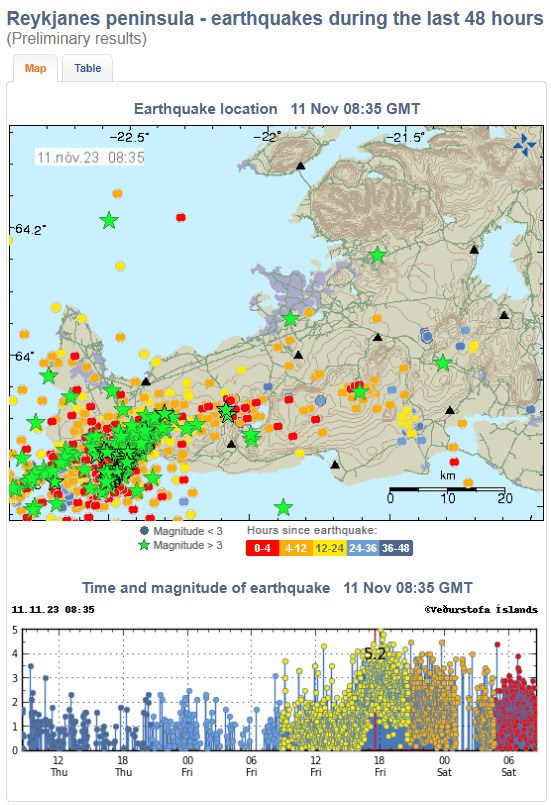
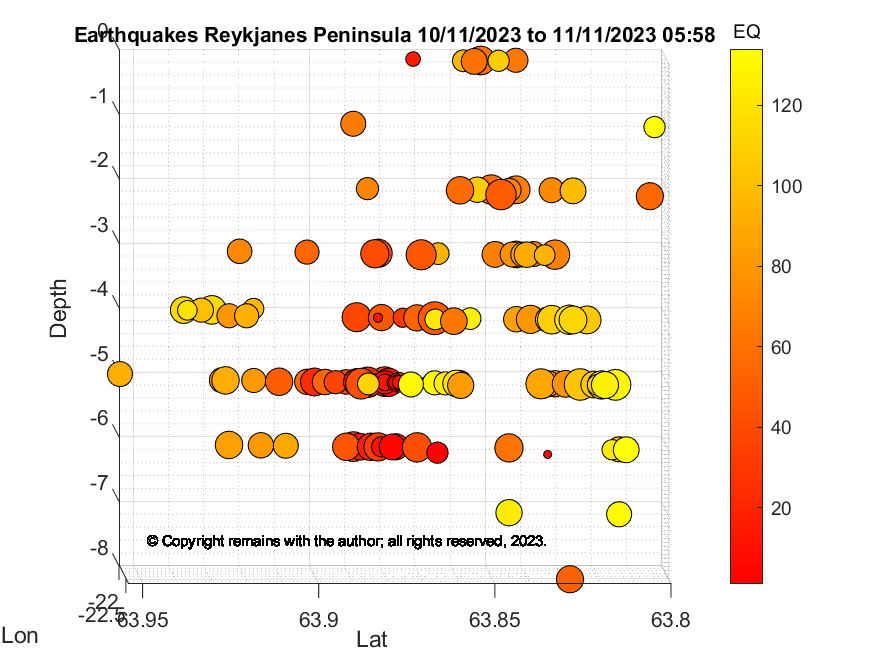
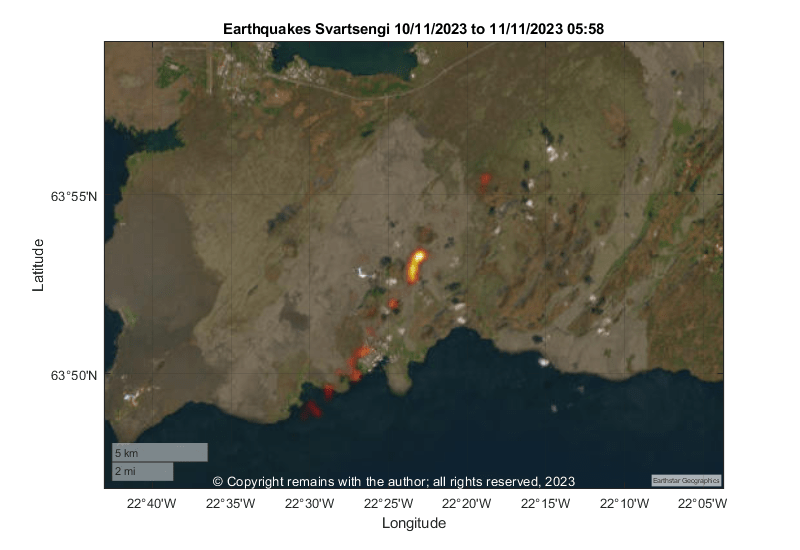
Fig 8: Earthquakes on the Reykjanes Peninsula. Note the activity is concentrated near Mount Þorbjörn; most of the outliers are ghost in the auto system. Source: IMO.
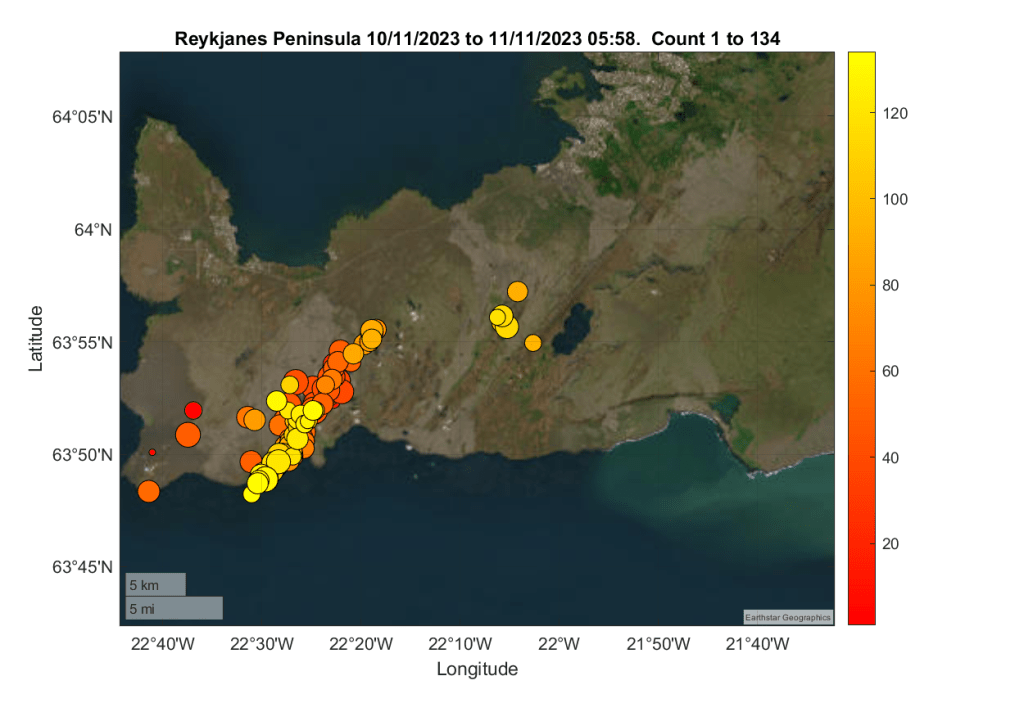
We have plotted the activity from 10th November 2023 to 11th November 2023 05:58 using the confirmed earthquakes reported on Skjálfta-Lísa (vedur.is), a total of 134 earthquakes. Our plots show the possible dike formation.
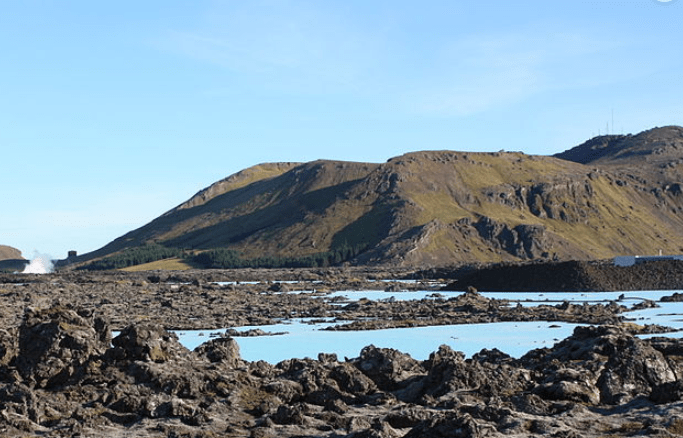
Fig 1: Image cropped from one by Arian Zwegers of the Blue Lagoon with Mt Þorbjörn. Published under CC BY 2.0
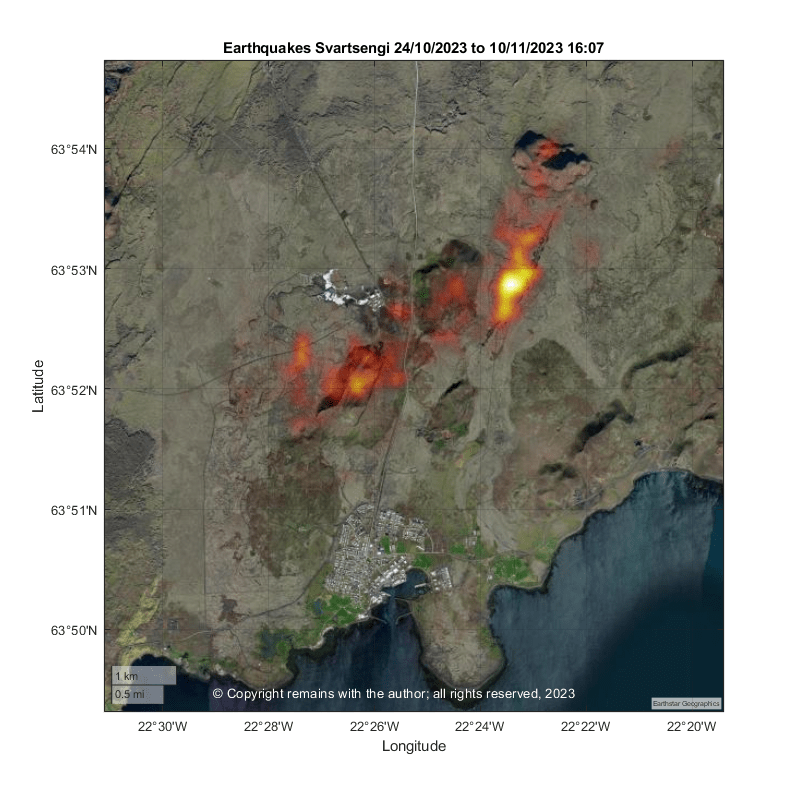
A large earthquake swarm started north of Grindavík, Iceland, on 24th October 2023 in the vicinity of the Svartsengi Geothermal Plant and Mount Þorbjörn. This is the fifth time such a swarm has occurred during the volcano-tectonic episode which started on the Reykjanes Peninsula in December 2019, including the three eruptions of Fagradalsfjall. Earlier today (10th November 2023), the swarm intensified. The aviation code for the Reykjanes – Svartsengi system has been raised to orange.
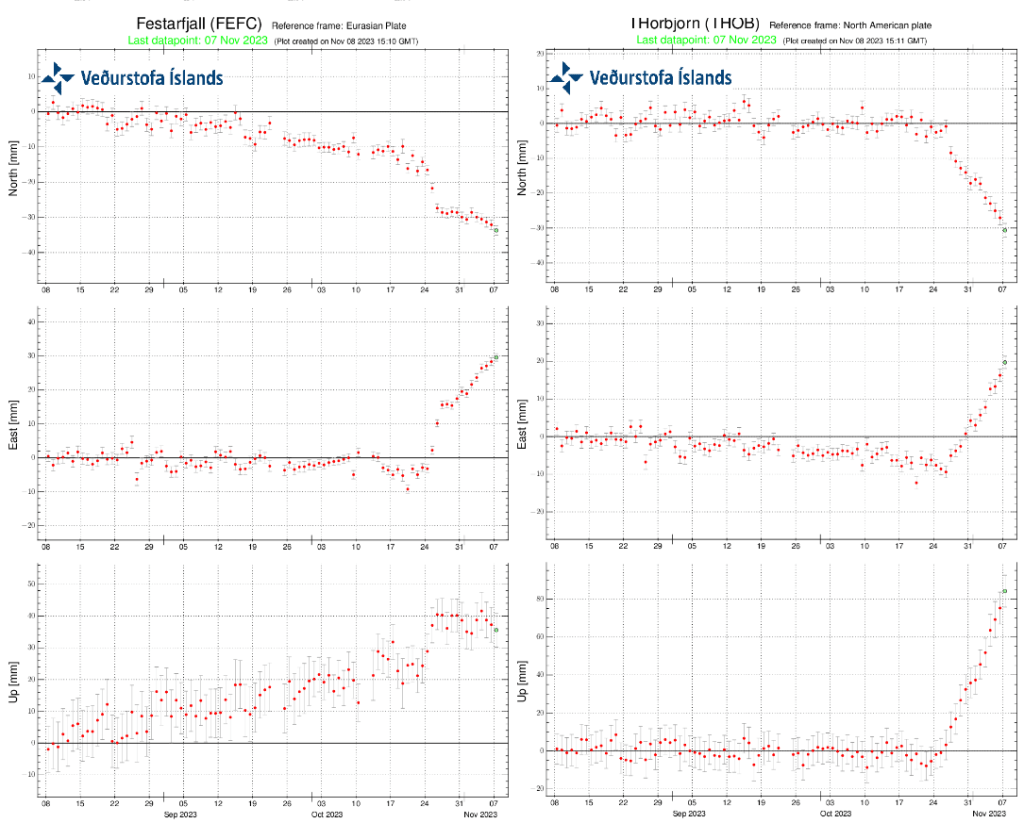
Because this activity started near Fagradalsfjall, it was initially thought that the swarm was caused by magma movement associated with Fagradalsfjall and the earthquakes to the west were triggered earthquakes (faults moving to accommodate the magma). This was born out by initial ground deformation showing at station FEFC, southwest of Fagradalsfjall. However, this has been followed by consistent uplift at the stations near Mt Þorbjörn, raising concerns that there is magmatic activity there. It is believed that magma is accumulating in a sill at a depth of 5km. Since then, there have been seven earthquakes with a magnitude greater than 4.0M in the area (as of 9th November 2023).
Fig 3: Time series for GPS stations FEFC and Thorbjörn to 9th November 2023. Source: IMO.
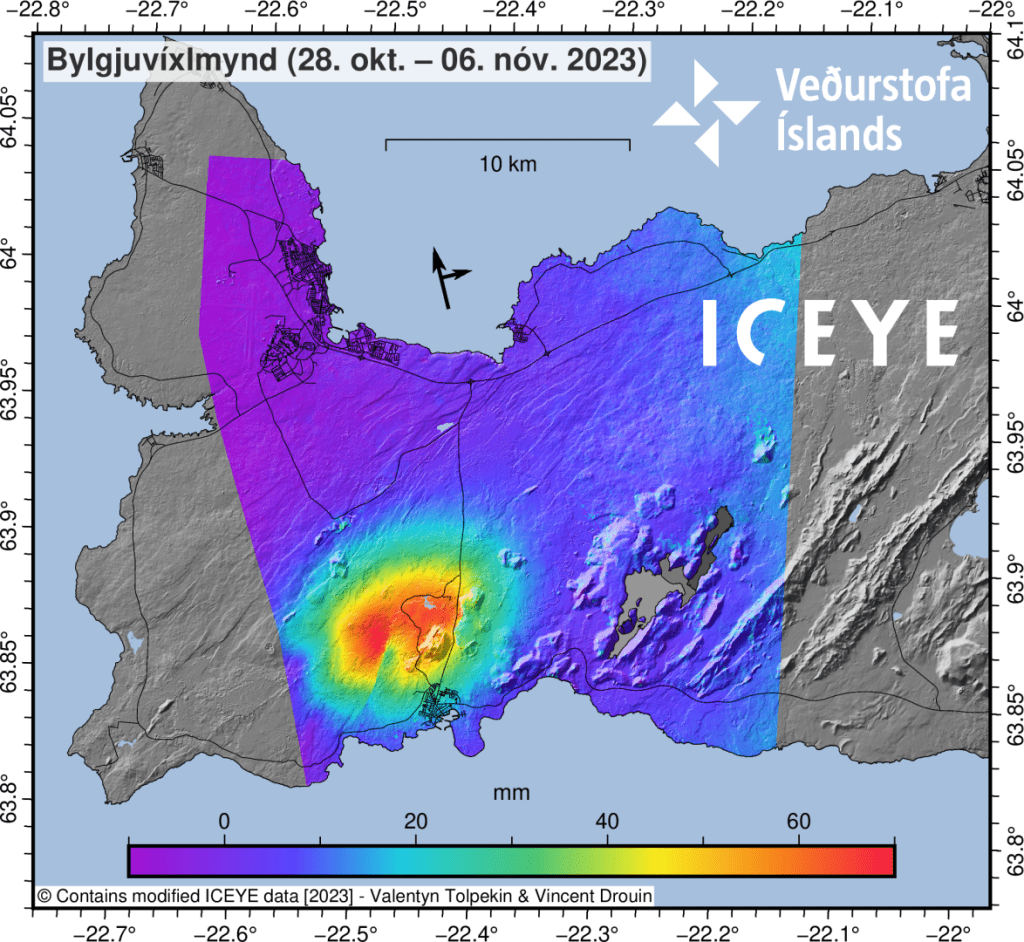
Fig 4: Interferogram (InSAR) for the period 28th of October – 6th of November showing around 7cm ground deformation. The green indent SW of Mt. Þorbjörn is an offset in the deformation signal caused by fault movements by earthquakes. Source: IMO
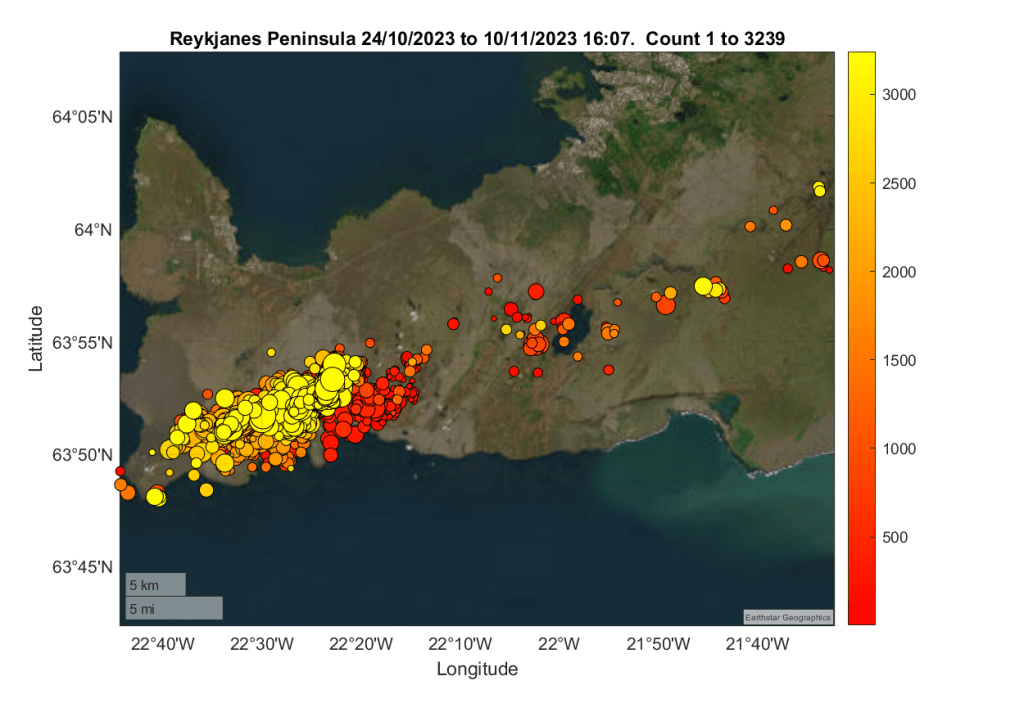
We have plotted the earthquakes reported on Skjálfta-Lísa (vedur.is) for the Reykjanes Peninsula for the period 24th October 2023 to 10th November 2023 (16:07) to see what is going on. 3,239 earthquakes have been recorded, although many more have occurred.
The geoscatter plot shows the initial seismic activity southwest of Fagradalsfjall, followed by its migration westward.
Time will tell whether an eruption ensues. But as a precautionary measure the Blue Lagoon is now closed to visitors and the residents of Grindavík have been advised of evacuation plans.
Our plot do not include the larger recent earthquakes, including the 5M. When we get more data, we will update our plots.
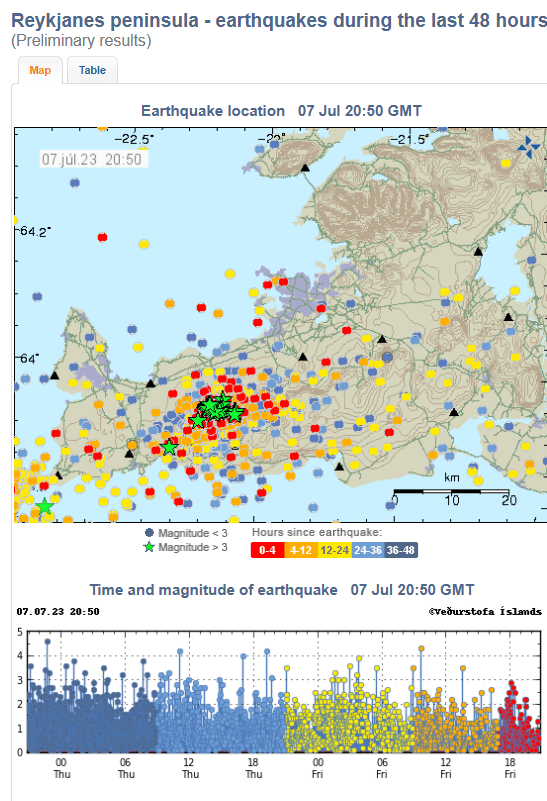
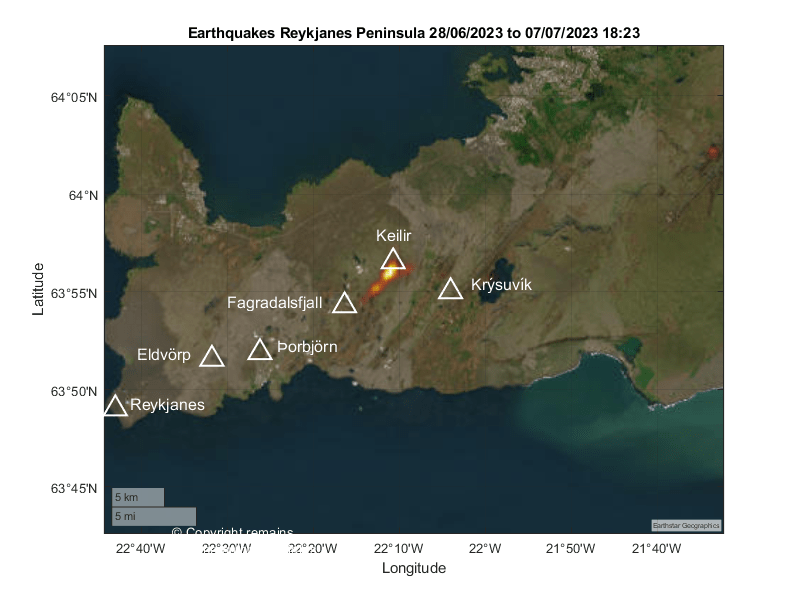
The earthquake swarm which started on 4th July 2023 is continuing vigorously as we write, with 7,000 earthquakes detected. InSAR has confirmed that there is a dike intrusion between Fagradalsfjall and Kelir. IMO have said that magma is likely to have reached a depth of around 1 km by 6th July, causing a fracture of a 2.8 km length between Fagradalsfjall and Keilir, centred a little north of Litli-Hrútur. The expectation is that, if an eruption occurs, it will be in hours or days. The eruption may be short but bigger in its initial stages than the 2021 and 2022 eruptions. The alert level remains at orange.
A smaller swarm is also ongoing southwest of the peninsula on the Reykjanes ridge, near the island of Eldey. This may be due to crustal accommodation of the magma intrusion between Fagradalsfjall and Kelir and/or it may be independent activity. The alert level has been raised to yellow. We will look at this in later posts.
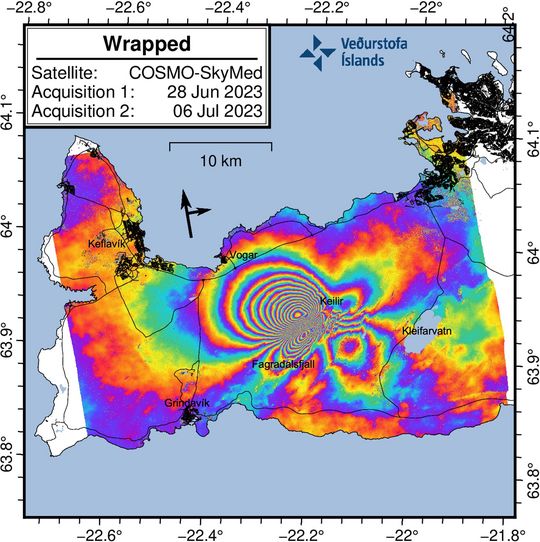
The wrapped image (Fig 2) clearly shows a series of multicolored fringes centered bewtween Fagradalsfjall and Keilir. These fringes show ground deformation caused by the new dike intrusion which commenced on 4 July 2023. The maximum observed deformation related to the dike intrusion is up to 18 cm in the satellite‘s line-of-sight (los) in the NW direction.
Although the deformation signal extends over a large area of the western Reykjanes Peninsula, this does not mean there is magma beneath this entire region. The magma intrusion is situated bewteen Fagradalsfjall and Keilir. There is no indication of additional magma movements outside this area.
Several small lineaments are also visible in the interferogram which cut across the fringes. These represent fault movements/earthquakes that were triggered during the dike propagation.”
We have updated our earthquake plots to this morning, 7th July 2023 09:37 using the published earthquakes from https://skjalftalisa.vedur.is .
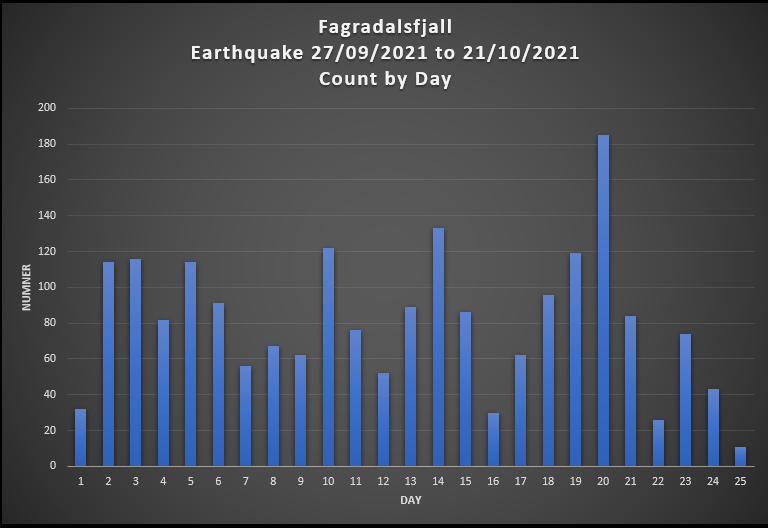
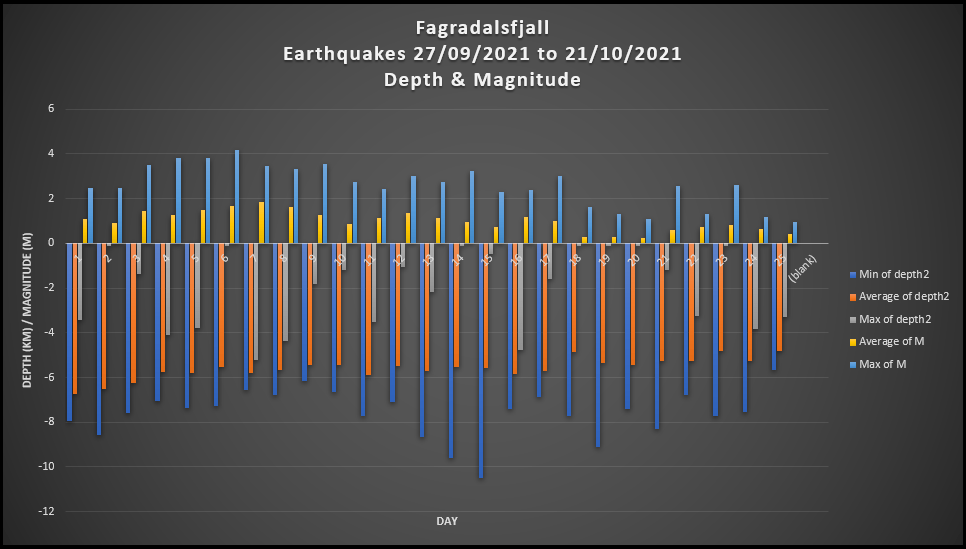
The eruption at Fagradalsfjall has halted. No lava has been erupted in the period 18 September to 18 October 2021 (or to the time of writing). The seismic swarm at Kelir has lessened. Gas emissions have decreased. The aviation code has therefore been lowered.
The eruption will not be declared over for some time. It is not possible to tell if this is a temporary lull or the eruption has ended; the eruption may resume at the same location in Fagradalsfjall or at a new fissure. As the authorities have pointed out, this can only be determined in retrospect.
The volcanic hazards are currently: gas, high temperatures both in the area and the lava field, earthquakes and rockfalls.
It’s been a few days since we looked at the latest earthquake swarm at Kelir, which is on-going. Here are the updated plots.
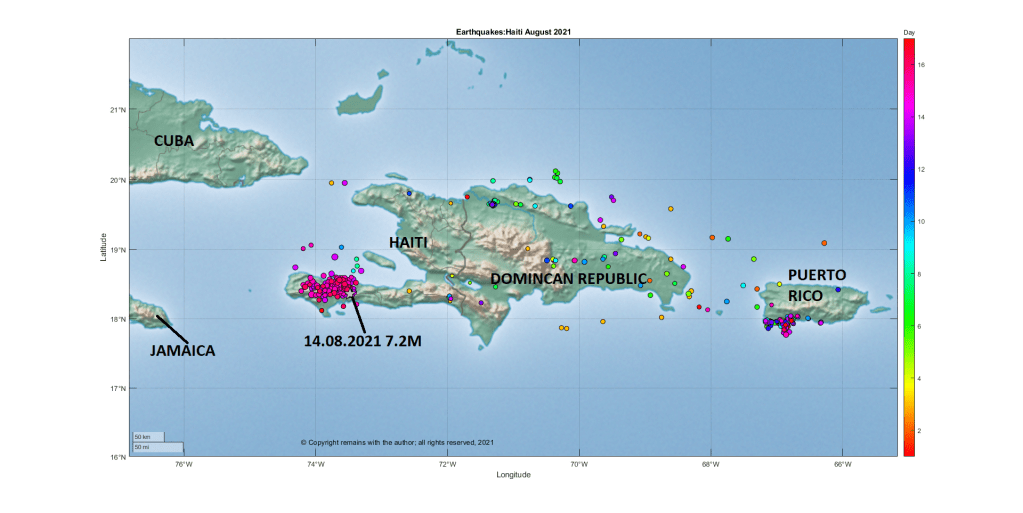
Our thoughts are with Haiti. Tragically, on 14 August 2021 at 8:29am (local time), a shallow (10km) earthquake of 7.2M occurred on the South West peninsula of Haiti 13 kilometres southeast of Petit Troup de Nippes. The earthquake was felt across the region, including Haiti, Dominican Republic, Jamaica, Cuba, and Puerto Rico. Over one million people may have been exposed to very strong or severe shaking.
A one-month state of emergency has been declared for Haiti. As of 16 August 2021, 1,419 are believed to have lost their lives, more than 6,000 injured and many thousands displaced. Tropical Depression Grace is likely to pass over the stricken area at the time of writing, bringing with it the risk of heavy rains, flooding, landslides and further loss of life.
Aftershocks are occurring, and may do so for some time. There is a small risk that this event is a foreshock to another event.
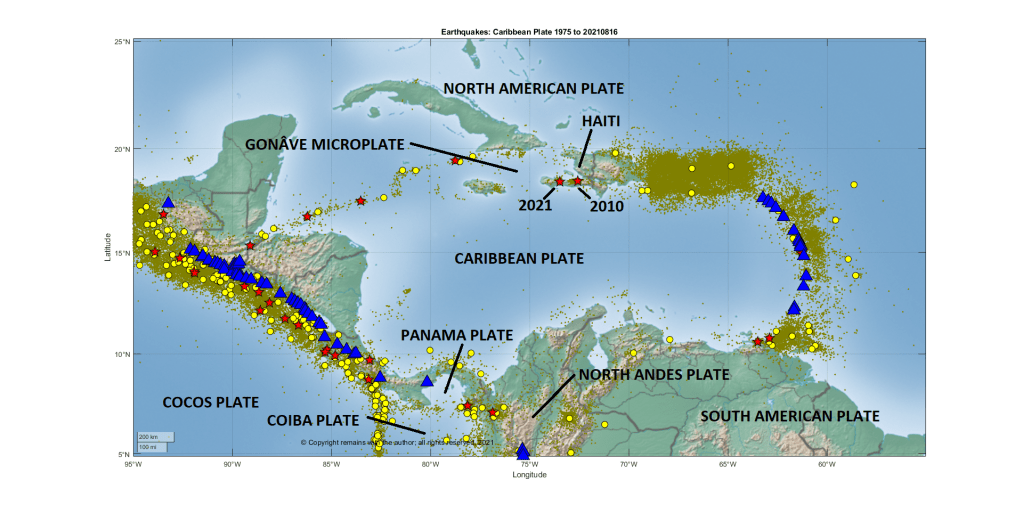
Haiti is located on the western side island of Hispaniola in the Greater Antilles Archipelago; the Dominican Republic occupies the eastern side of the island. Two large fault zones cross the island: the Septentrional-Orient fault in the north and the Enriquillo-Plantain Garden Fault Zone in the south.
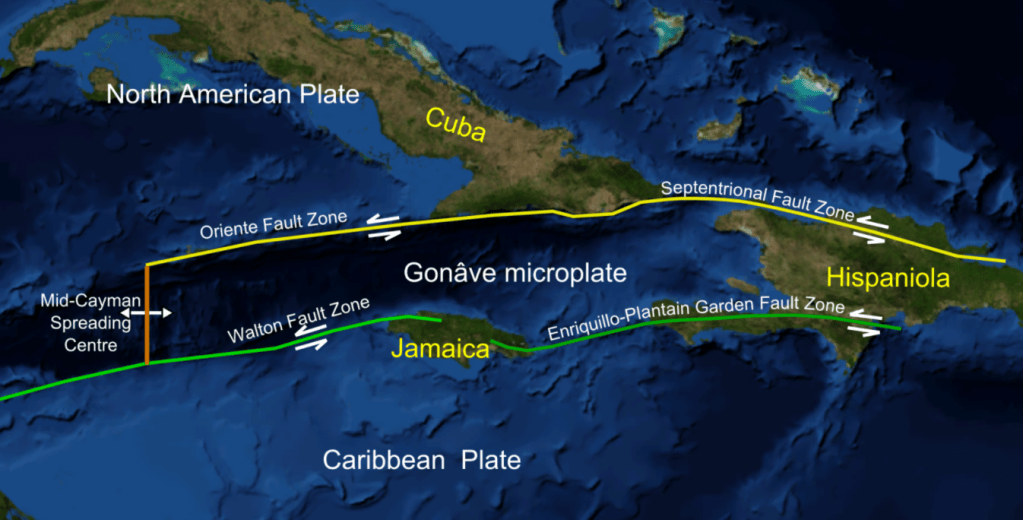
Fig 2: Cropped image from one digitally altered by Mikenorton of the Gonâve Microplate (plate boundaries, main faults, islands and plates were added). Source: Gonâve microplate.
Hispaniola was formed from the collision of volcanic arcs with the North American Plate; the island is made up of 11 former island arcs. Haiti has an estimated population of 11.4 million (2018). The country is poor, politically unstable and yet to recover from the 2010 earthquake.
While the island has a volcanic past, there has not been any reported volcanic activity in the Holocene. There are two Pleistocene volcanoes in Haiti, the nepheline basalt scoria cones of Morne la Vigie, north of Port au Prince, and Thomazeau, east north east of Port-au-Prince, both of which were active around 1.5 million years ago; and, three in the Dominican Republic, the basaltic cinder cones of San Juan, trachyandesite lava domes and flows of the Dos Hermanos volcanic field and the rhyolitic to basalt Valle Nuevo volcanic field. The presence of picrite in the Duarte Complex in central Hispaniola and enriched basalts in southern Haiti are thought to be indicative of earlier hotspot activity
Tektites have been found in the Beloc Formation, Haiti, which are thought to have originated from the asteroid impact in Yucatán Peninsula, Mexico, which caused the K-Pg mass extinction event 66 million years ago.
2021 7.2 M Earthquake
The earthquake occurred in the Enriquillo-Plantain Garden Fault zone on the transform plate boundary between the Caribbean Plate and the North American Plate. The faulting mechanism for this earthquake indicates oblique thrust faulting along the fault zone. This fault zone accommodates 7mm per year of the 20mm per year of the relative plate motion. It is likely that this earthquake occurred in the same fault system as the devastating January 2010 7.0M earthquake which occurred near Port-au-Prince, the capital.
According to the DEC, the January 2010 earthquake not only caused significant loss of life and damage but also severally impacted Haiti’s government and infrastructure: 25% civil servants died, 60% government buildings, 80% schools in Port-au-Prince and 60% schools in the South and West departments were destroyed. In all, over 220,000 were killed, more than 300,000 injured and around 300,000 homes damaged or destroyed.
USGS note that four other large earthquakes are known to have occurred in the region: October 1751 in the Gulf of Azua at the eastern end of the Enriquillo-Plantain Garden fault zone; November 1751 at Plaine du Cul-de-Sac which destroyed Port-au-Prince; June 1770 which also destroyed Port-au-Prince; and, April 1860 which also caused a tsunami.
It is expected that there will be a request for international aid. If you wish to help / donate to the aid effort, refer to your favourite international aid agency, in the first instance.
We are looking again at the volcano basics, this time the hazards posed by volcanoes. This is not intended to put you off visiting a volcano; understanding the hazards is the first step towards mitigating volcanic risk.
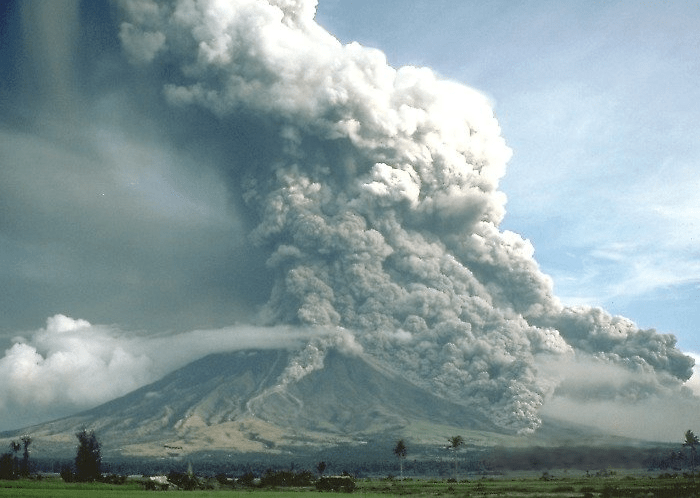
Fig 1: Pyroclastic flows at Mayan, 1984, Philippines by C. G. Newhall, Public Domain
Visiting a volcano
A quick word about visiting a volcano before we get into volcanic hazards.
It is usually possible to view an erupting volcano from a safe distance if you follow local official advice. Where there is an exclusion zone in place, the local authorities consider it too unsafe for the general public to go into that zone. Your insurance company and local rescue teams would probably take a very dim view of any accidents arising should you stray into the zone and need rescuing.
If you want to visit a volcano, do your research, take advice and have an enjoyable trip.
Volcanic risk mitigation
The purpose of volcanic risk mitigation is to reduce the losses from a volcanic eruption or other volcanic hazard. This involves understanding the hazards posed by the volcano, the losses that would be incurred should an event occur and putting appropriate measures in place, where possible.
Volcanic hazards
This is a list and brief description of the major volcanic hazards, both when the volcano is in repose and when it is erupting.
Volcano not erupting
When a volcano is not erupting the hazards are pretty much the same as for any mountain: altitude, weather, avalanche, rock fall, getting lost in unfamiliar terrain, not being properly prepared, and/or not looking where you are going while taking that selfie / photo.
There may be the additional hazards from gas emissions, hot springs or fumaroles: for example, carbon dioxide is an invisible odourless gas that can accumulate in depressions in the ground or caves, replacing the oxygen in the air leading to asphyxiation; hot springs can cause chemical and heat burns; fumaroles emit gases.
Volcano erupting
The main additional hazards from an erupting volcano are: blast wave (directed blast), eruption clouds, tephra, pyroclastic flows, lava flows, lava domes, debris avalanche flows, lahars, jökulhlaups, gas emissions, earthquakes, caldera formation and tsunamis.
Blast wave:
Explosive eruptions triggered by a sudden release in pressure can generate supersonic blast waves (directed blasts). These blasts can flatten trees, destroy property and kill (directly or via debris hurled by the wave). If the gases and ash released in the explosion are hot, they sear everything in their path. An example is the lateral blast wave produced by Mount St Helens at the start of the May 1980 eruption.
Eruption clouds:
These are the clouds of ash, gases and rocks propelled by the volcano into the atmosphere; the cloud rises through kinetic energy from the eruption and heat. Before the advent of aviation only the larger ash clouds posed a serious threat. Ash clouds may reach heights from hundreds of metres to tens of kilometres. If the ash cloud reaches the stratosphere it can have regional and global impacts on climate; ash filters out sunlight, cooling the air. Examples of climate impacting eruption clouds are Krakatau, 1883, and Tambora, 1815.
Ash, especially ash with a high silica content, is also bad for aircraft. Flying through an eruption cloud at speed is akin to flying through a large sand blaster. Ash abrades the outer surface of the aircraft, including the windshields and lacerates vulnerable parts. Engine heat also melts the ash, coating fuel nozzles and turbine blade with glass, which may stop the engines in seconds. An eruption as small as a VEI 3, is enough to put an aircraft at risk. Examples of aircraft in trouble are the VEI 4 eruption of Galungung, 1982 and VEI 3 of Redoubt, 1989. A BA flight encountered the eruption cloud from Galungung 150 km away from the volcano; all the engines cut out, were successfully restarted 2,000 m from the sea, after falling 9,000 m, only for the experience to be repeated when the plane flew back into the cloud (the plane later landed successfully in Java, despite having an abraded opaque windscreen); a Singapore Airlines flight was only able to recover two engines from the loss of all four after flying through the same cloud two weeks later. A KLM flight lost all four engines in the Redoubt ash cloud and got uncomfortably close to the Alaskan mountains before being able to recover.
Tephra:
What goes up, must come down. Tephra is the ash and rock that falls out of the eruption cloud due to gravity. It is densest nearest to the volcanic vent; it can be dense enough to cut out all light by filtering out starlight, moonlight and sunlight; it may also cut the electricity supply, block roads and hamper rescue attempts.
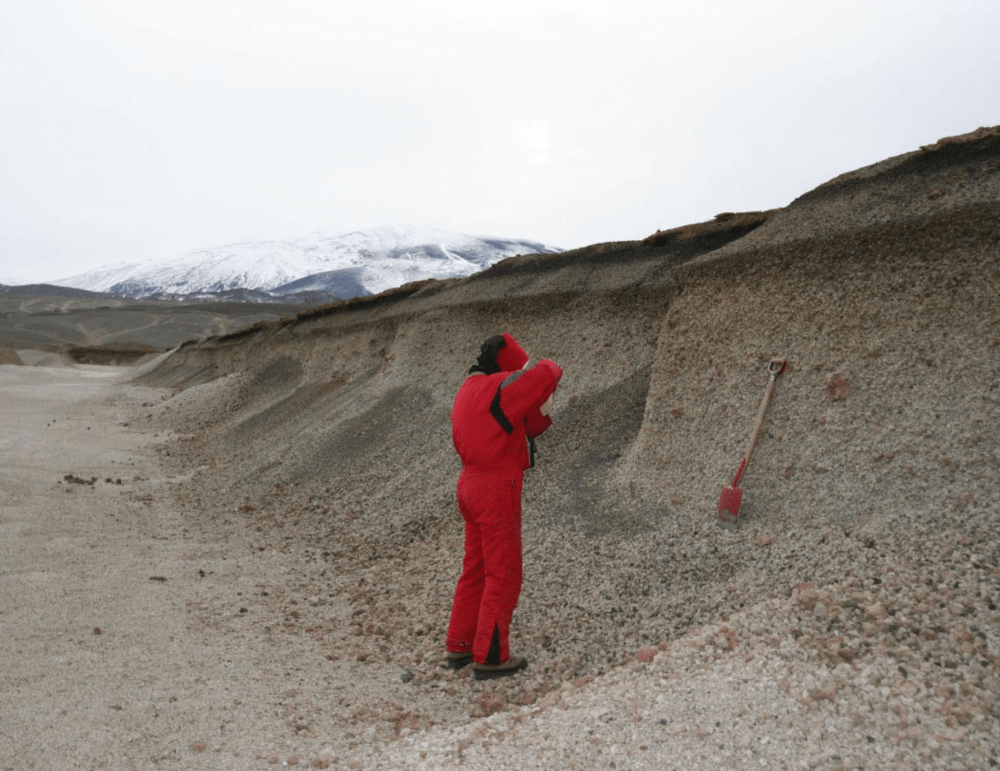
Fig 2: Light-coloured tephra deposit from one of Hekla’s largest explosive eruptions, H-3. The total thickness is of the order of several meters. Photographer: Guðrún Sverrisdóttir, Photo 5 of 5. Retrieved from Icelandic Volcanoes
The weight of accumulated tephra on buildings may cause them to collapse. If the tephra is combined with water, it may turn to concrete and be very difficult to remove.
Accumulation of tephra on the ground may cover vegetation, cutting off air and water to the plants: a layer as thin as 2.5 cm is enough to kill some plants, vegetation recovers within a year; a covering of 15 cm or more is enough to kill vegetation and sterilise the soil from which it takes decades to recover.
Tephra may also be rich in chemicals that are toxic to plants and the livestock that feed on them and contaminate the water supply. Fluorosis from ash is a common cause of death in livestock and people. Some minerals in tephra are also carcinogenic.
There is no shortage of examples of eruptions where tephra has caused loss of life; here are three: Pinatubo, 1991, Vesuvius, 79 AD, and Tambora, 1815.
Pyroclastic flows:
These are big killers. You cannot outrun a pyroclastic flow so unless you are right on the edge of a cold flow, or in an air-tight robust building, your chance of survival is zero. Pyroclastic flows are fast-moving surges of gases, ash and rocks propelled by gravity that flow down the sides of the volcano at speeds of up to 200 km per hour; heavy ash and rocks form a basal surge, whereas lighter ash may form phoenix clouds, propelled upwards by heat and turbulence. Small flows may travel up to 20 km and larger ones more than 100 km from the vent. Pyroclastic flows are generated by collapse of the eruption column or by lava domes (collapse of the dome or detonation by pressurised gas).
Pyroclastic flows deposit large volumes of ash and rocks; lumps of lava may be the size of a vehicle. If the flow is hot, the ash and rocks may be welded together as ignimbrite. Hot flows will ignite anything that is flammable. The area covered by the debris depends on the size of the eruption, a very large one may cover an area the size of Switzerland.
Again, there is no shortage of examples of pyroclastic flows, in addition to the three eruptions noted above, there is the VEI 4 1902 eruption of Mount Pelée, Martinique, in which two pyroclastic surges caused by dome collapse wiped out the capital St Pierre killing 30,000 and leaving 50,000 homeless; a third pyroclastic flow killed 2,000 in Morne Rouge.
Lava:
Lava flows are the lava which flows down a volcano or across open ground. Most lava is viscous and can be outrun; hazards tend to be damage to property, farm land, power supplies and communication lines. There are rare instances where lava flows have killed, such as Nyiragongo in 1977, when a fissure emptied the lava lake, producing basaltic lava flows with speeds of 30km per hour; where observers getting too close were casualties chunks of lava breaking off the flow or from the explosions where hot lava met water or ice; or where lava flows have cut off escape routes.
Lava domes are formed when more viscous magma builds up as a dome rather than flows. They tend to have a solid surface and may have spines of solid lava pushed up by magma from the centre of the dome. Lava domes may collapse under gravity causing block and ashflow eruptions or there may be a directed blast where a crack or collapse releases pressure. Examples where lava domes have claimed lives are Mount Pelée, 1902, Mount Unzen, 1991, Merapi, 1930, Mount St Helens, 1980 (cryptodome).
Debris Avalanche Flows & Lahars:
Volcanoes are made up of layers of loose ash and lava so are not very stable. They may suffer partial edifice collapse as a result of gravity, erosion or from the pressures generated during an eruption. The collapse causes debris avalanche flows – a fast moving, gravity driven currents of rocks, water and other materials.
Mount St Helens is an example of the debris avalanche flow triggered by magma: a dacite cryptodome destabilised the northern slope; a small earthquake caused the bulge to fail, its collapsing released superheated steam, resulting in the catastrophic eruption. Bandai volcano in Japan suffered failure of the northern flank set off by a small phreatic eruption in 1888; the avalanche had a volume of 1.5km3 and killed 461 people. Unzen in 1792 suffered sector collapse with no eruptive activity; the edifice failed under gravity alone.
A lahar is a water saturated debris avalanche flow (mudflow). Lahars may be triggered by heavy rainfall typical of the tropics or by the rain storms generated by an eruption. Rain washes loose ash and rocks into river valleys or gullies where they mix to torrential mud flows. Lahars can move at speeds of 90 km per hour. Mudflows, plus debris picked up, form torrents which destroy property and kill those caught in their path. A famous example of a catastrophic lahar is the destruction of the town of Armero in 1985 from a series of lahars resulting from pyroclastic flows 50 km away at the summit melting snow in a VEI 3 eruption of Nevado del Ruiz; most of the population of 28,700 were buried in several metres of mud.
Jökulhlaups:
These are glacial outburst floods caused by the melting of glacier ice by heat from magma near the surface or during an eruption. The water may accumulate under the ice in lakes, if its exit is blocked by ice, to be released as a flood when the ice dam breaks or floats. Jökulhlaups carry debris from ash, boulders and ice bergs from the glacier.
The term is Icelandic and here we can find many examples. One is the 1996 jökulhlaup from Grímsvötn with a volume of 3.5 km3, which reached a peak discharge of 45,000 cubic metres per second. Most of the damage was to roads, bridges and power supplies; not many people lived in the vicinity. Flood deposits covered 750 km2 and extended the coastline out by 800m.
Volcanic Gases:
Volcanoes emit gases (volatiles) both when erupting and not. The volatiles include sulphur dioxide, steam, carbon dioxide, hydrogen fluoride, hydrogen chloride, hydrogen sulphide and carbon monoxide; they may also include toxic compounds of arsenic, bismuth, cadmium, copper, lead, mercury, thallium and zinc. Volatiles can tell us much about the lavas: unevolved magmas (mid ocean ridge basalts) tend to contain less water than arc basalts and rhyolites. However, here we are concerned with the hazards posed by volcanic volatiles.
Volcanic emissions damage vegetation, mostly by the acidic effects on soil and foliage, reducing crop yields or stripping vegetation. Acidic gases may damage skin and irritate eyes and lungs. Hydrogen sulphide, like carbon dioxide, can accumulate in volcanic or geothermal areas, causing fatalities from neural, respiratory and cardiovascular damage or by asphyxiation. One such tragedy occurred at Lake Nyos on 21 August 1986 in Cameroon when a cloud of carbon dioxide released from the lake flowed down the volcano, asphyxiating the 1,700 people plus pets, livestock and wild animals in its path.
Earthquakes:
Volcanic activity rarely produces large earthquakes (over 6.0 M); the ground motion required to accommodate magma movement is relatively small. However, magma movement generates swarms of earthquakes which can run into the thousands. The accumulated shaking may damage property, weakening it to be more vulnerable to the effects of the eruption which may ensue.
Caldera formation:
I have not seen this mentioned as a specific hazard in its own right in my text books, probably because much of the hazard is covered by other factors, such as: the eruption cloud, tephra, lava flows, tsunamis and earthquakes, which may be considerable in a caldera-forming eruption.
A caldera is formed when the roof of the magma chamber sinks while its contents are being evacuated. In addition to the eruptive products, this may result in loss of land as we saw with Krakatau. The depression may fill rapidly with water (sea water or fresh water). Land loss is likely to be permanent resulting in loss of property, businesses, flora and fauna and anything else left on that land.
Tsunamis:
These are big killers. Volcanic tsunamis are generated when a large volume of sea water is displaced by ash deposited by a collapsing eruption columns, pyroclastic flows and edifice failure. Tsunamis may travel a long way, devastating shore-lines. Examples are Krakatau, 1883 and Tambora, 1815.
So why live near a volcano?
If volcanoes are such a threat, why do people live near them, or even on their slopes (assuming that they know that the beautiful wooded mountain is a volcano)? We’ll look at the reasons in more detail later, but in summary they are that large eruptions are not that frequent (the volcano may be in repose for decades / centuries); volcanic ash contains a lot of nutrients which lead to fertile soils, good for crops and livestock; the scenery is often unusual or attractive leading to tourism; and, if you were born or raised in the area, you may accept the risk.
We will look at volcanic risk mitigation over the coming weeks.
A large earthquake swarm started in Iceland in the Tjörnes Fracture Zone (TFZ) on 19 June 2020, still ongoing at the time of writing. The Civil Protection Authority, Iceland, has declared a state of uncertainty; the TFZ is capable of producing large destructive earthquakes.
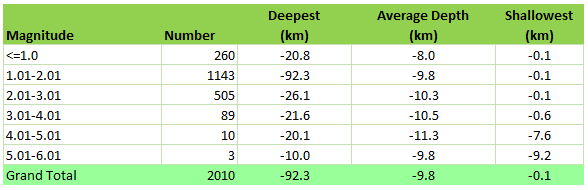
The Icelandic Meteorological Office (IMO) has reported that over 9,000 earthquakes have been detected by their SIL earthquake monitoring system. The swarm includes three earthquakes over 5.0: on 20/06/2020 a 5.6 and a 5.4, both 20 km north east of Siglufjörður; and, on 21/06/2020, a 5.8 30 km north, north east of Siglufjörður. The day before the swarm started there was a small earthquake with a depth of 92.3 km, which is unusually deep for the area.
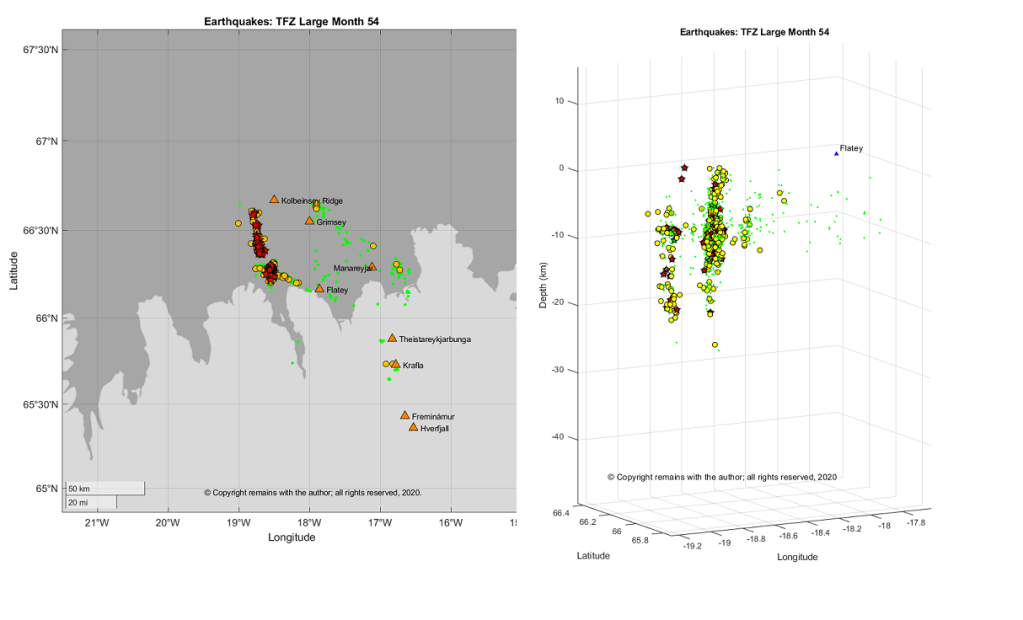
IMO is in the process of manually confirming the earthquakes – a mammoth task! We have updated our earthquake data set up to 28 June 2020 based on the earthquakes confirmed so far in order to take a look at the swarm. In the area, 65.25°N, 21.5°W to 67.25°N, 15.0°W, 2,010 earthquakes from 1 June 2020 to 28 June 2020 were available to download.
Our plot for month 54 (1 June 2020 to 28 June 2020) shows that the swarm is occurring on the western end of the TFZ, near the junction of the Eyjafjarðaráll Rift and the Húsavík-Flatey Fault.
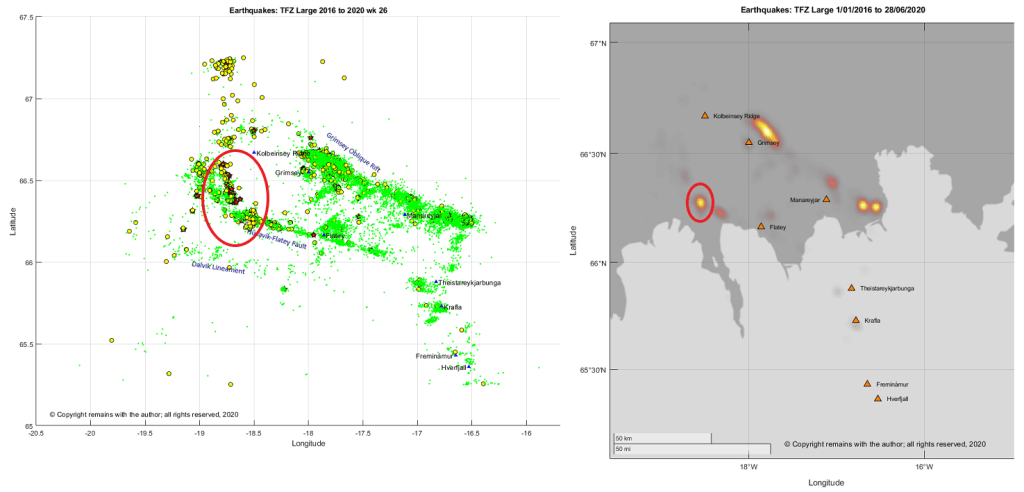
Prior to this swarm, most activity in our data set from 1 January 2016 had been on the Grímsey Oblique Rift and Húsavík-Flatey Fault, with a large swarm occurring to the north west of Grímsey in February 2018 (see our earlier post). The current swarm appears to be the western end of the system catching up.
This swarm is, however, relatively deep for oceanic crust. Whether or not there is any associated volcanic or geothermal activity remains to be seen.
The swarm on the Reykjanes Peninsular that started in late 2019 is still ongoing, albeit at a reduced rate. Are the two swarms linked? The obvious answer is yes – they are both on transform fault systems which accommodate the spreading from the Mid Atlantic Ridge as it crosses Iceland. But is there more to it? Possibly, the crust could be fracturing to accommodate other activity in Iceland – e.g. uplift from the mantle plume. If yes, we may see some more activity e.g. in the vicinity of the Vatnajökull Icecap in the next few months. But we’ll have to wait until the real experts opine.
For updates, please consult IMO.
The Armchair Volcanologist
29 June 2020.
Source for earthquake data: Icelandic Meteorological Office (IMO): https://en.vedur.is
While browsing IMO’s website a few days ago, I saw that signs have been detected that Grímsvötn is getting ready for another eruption, IMO ; a team of scientists noted large sulphur dioxide emissions near the south west caldera rim, indicating that magma is close to the surface. At the time of writing, the alert level for Grímsvötn remains at green.
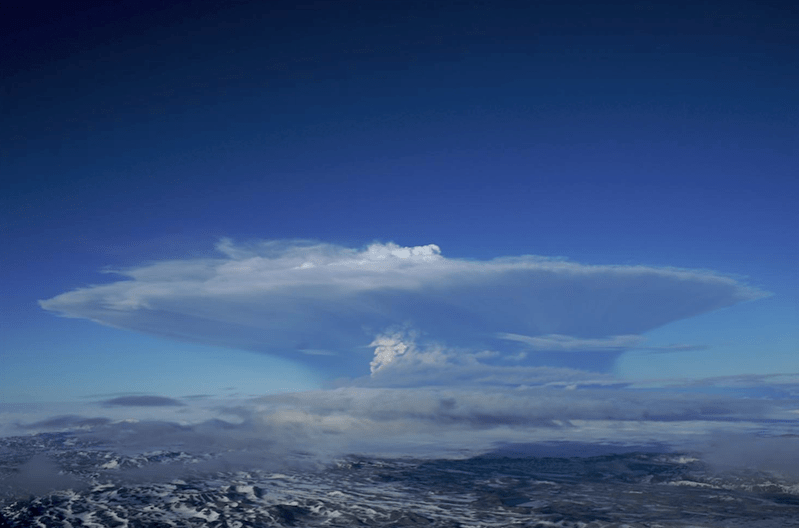
Grímsvötn is Iceland’s most active volcano, erupting every 10 years and last erupting in 2011 with a VEI 4.
Fig 1 Grimsvotn 2011 eruption. Photographer: Sigurjónsson,O. Grímsvötn (GRV): photo 2 of 14. Retrieved from Icelandic Volcanoes: http://icelandicvolcanos.is/?volcano=GRV
Geological Setting
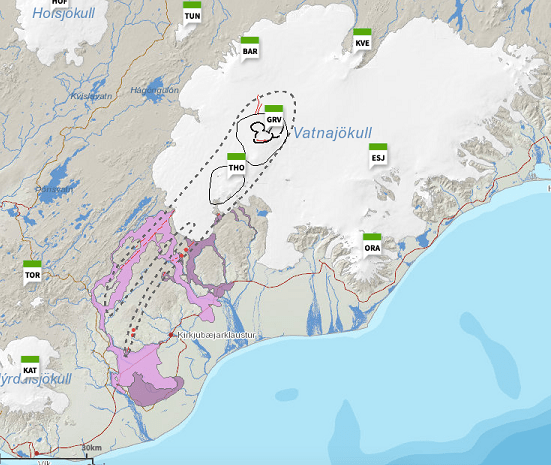
Grímsvötn is one of six active volcanoes under the Vatnajökull ice cap: Bárðarbunga, Kverkfjöll, Grímsvötn, Esufjöll, Þórðarhyrna, Öræfajökull. Apart from Þórðarhyrna (THO in the map below), the other volcanoes are different volcanic systems.
The Vatnajökull volcanoes are part of the Eastern Volcanic Zone in Iceland. Volcanism here is caused by rifting and extension from the separation of the North American and Eurasian Plates. As noted in an earlier post, the Eastern Volcanic Zone accommodates 40 to 100% of the separation.
Our description of the Grímsvötn volcanic system is largely based on Magnús T. Guðmundsson and Guðrún Larsen’s description in Icelandic Volcanoes (ref. Sources below for the full accreditation).
The Grímsvötn volcanic system
The Grímsvötn volcanic system, itself, is made up of two central volcanos and fissure swarms. It is partly covered by ice.
Fig 2 The Grímsvötn volcanic system showing craters, central volcanoes and fissure swarms. Retrieved from Icelandic Volcanoes (see Sources below for full accreditation).
The Central Volcanoes
The Grímsvötn central volcano is a 1722m high, 15-16km diameter caldera complex covered by the Vatnajökull ice-cap, with ice depths of 100m to 700m; she has an 8km by 10km ice-filled caldera. Grímsfall (GFUM) is the highest point on the caldera rim. There is a subglacial lake in the caldera under a 200 – 300m ice shelf with an associated geothermal area. The lake has been the source of many jökulhlaups.
The Þórðarhyrna central volcano, also subglacial, is a 1650 high with a 15 km diameter, connected to Grímsvötn by a subglacial ridge. The volcano, itself, has a small intrusive complex but does not appear to have a large magma reservoir. There is a geothermal area near Pálsfjall.
Ice cover has restricted study of the volcanoes. However, Grímsvötn has been around for long enough to develop a caldera – possibly more than 100,000 years.
Grímsvötn’s lava types are tholeiitic basalt with basaltic andesite and dacite / rhyolitic outcrops in the Þórðarhyrna central volcano. The presence of a shallow magma reservoir is inferred from the geothermal field in the caldera. The 2011 eruption of Grímsvötn produced 0.8km3 basaltic tephra.
Þórðarhyrna is less active than her neighbour; the last eruption occurred in 1903 with a VEI 4. It is possible that she had a second eruption in 1753, resulting in jökulhlaups. Again, ice cover has limited geological study. There is little seismic activity near Þórðarhyrna.
The Fissure Swarms
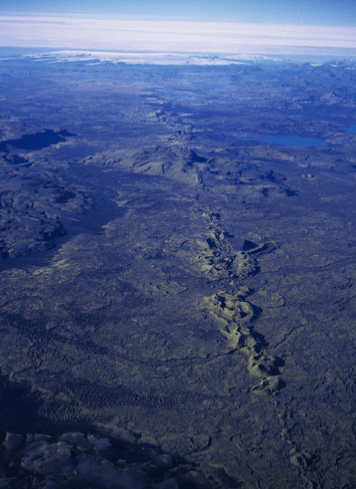
The fissure swarm is about 100 km long and 18 km wide. Rifting is believed to occur along the entire swarm. The northern end of the fissure swarm is covered by the Vatnajökull ice-cap; the southern 80km is ice-free. Subglacial ridges characterise the northern end of the fissure, but not the ice-free southern end where crater rows delineate the fissure, including the Laki.
Three known subglacial eruptions have occurred since 1867 at Gjálp 10km to 15km north of Grímsvötn, itself. The eruptive products include subglacial ridges and some airborne tephra. The 1996 eruption produced basaltic andesite.
Four effusive eruptions have been identified in the ice-free section of the fissure swarm southwest of Grímsvötn in the last 8,000 years; lava volumes have been between 1 km3 to 14 km3 with up to 0.7km3 of tephra. The largest fissure eruption was the Laki eruption in 1783 to 1784. No eruptions have been identified for the ice-covered section of the fissure swarm.
The Laki Fissure Eruption 1783 -1784
This eruption was well documented at the time; the Reverend Jón Steingrímsson’s 1788 account in “A complete description of the Síða Fires” gives a detailed eye-witness account.
The 1783 eruption occurred on 27km long fissure and lasted from 8 June 1783 to 7 February 1784. The early phase consisted of a series of ten or more explosive tephra events, each followed by effusive lava flows. Grímsvötn, itself, erupted in July 1783 to May 1785 causing ash fall and jökulhlaups.
The Laki eruption was pre-empted by earthquakes of increasing intensity from mid-May to 8 June 1783 when a large ash cloud and ash fall appeared, followed by lava columns over 1km high from new fissure to the north. Volcanic gases filtered out sunlight, making the Sun appear red. Accompanying rainfall was acidic, irritating people’s eyes and skin. Lava flows filled river gorges, overflowing to cover surrounding farmland. During the eruption, Mount Laki was destroyed; I am not sure how big she was and how much her destruction contributed to the vast tephra output.
The eruption is rated a VEI4, having produced 0.7km3 of tephra which covered more than 8,000 km2, and 14 km3 of lava. Volcanic gases, including fluorine, killed more than half of the livestock and the “Haze Famine” killed 20% of the Icelandic population. Further afield, 100 million tonnes of sulphur dioxide, having reached the jet stream, spread acidic sulphate aerosols round the Northern Hemisphere, damaged vegetation and crops in Europe and Alaska, caused severe winters and annual cooling of around 1.3°C that lasted for two to three years.
Fig 3: Laki Crater Row: Photographer: Sigurðsson, O. Grímsvötn (GRV): photo 1 of 14. Retrieved from Retrieved from Icelandic Volcanoes: http://icelandicvolcanos.is/?volcano=GRV
According to GVP, the Grímsvötn volcanic system has had 86 Holocene eruptions ranging from VEI 0 to VEI 6. The VEI 6 occurred around 10200 BP and is the thought to be the source of the Saksunarvatn Tephra, a basaltic tephra which covered an area of 2 million km2 around the North Atlantic. The Saksunarvatn Tephra, like the Vedde Ash from Hekla, is a geological time marker, although radiocarbon dating of the Saksunarvatn Tephra shows that it may have come from seven eruptive events over a 500 year period from 10400 BP to 9900 BP
Grímsvötn’s most recent eruptions from 1996 to 2011 range from VEI 3 to VEI 4. They were preceded by a small increase in seismicity and small earthquake swarms, except for the 1996 Gjálp eruption. The 1996 eruption was preceded by a 5.4 earthquake on Barðabunga’s northern caldera rim, swarms over a two day period at Barðarbunga’s north and northwest caldera rims and at Grimsvotn’s southern caldera rim, followed by a swarm from the north Bardarbunga caldera rim that migrated to Gjálp.
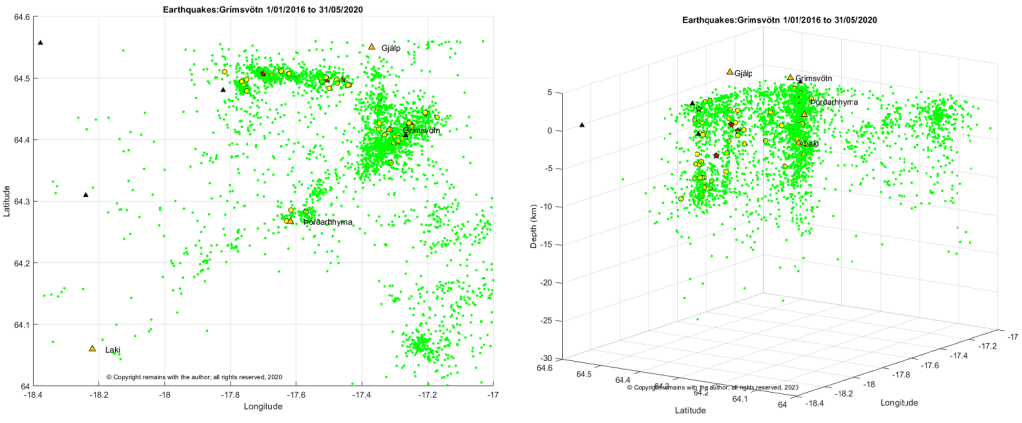
Recent Seismicity
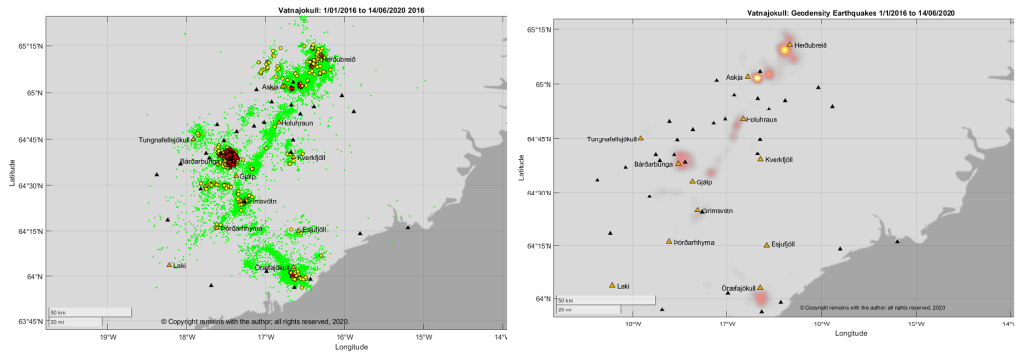
So, what does our earthquake data set tell us about the likelihood of an eruption at Grímsvötn? The answer is a disappointing “not a lot”. We can see that Grímsvötn has a fairly steady stream of earthquakes but no obvious swarms. However, given the proximity of Grímsvötn to other volcanoes, we may have attributed some of Grímsvötn’s activity to another volcano in error. Plots are shown below, including one for Vatnajökull which shows the problem.
The earthquake plots of the Vatnajökull region show the SW-NE trending fissure swarms and also a SE-NW trending line of earthquakes. The head of the mantle plume is considered to be under the Vatnajökull ice-cap; perhaps we are seeing its influence on the plate junction? We can also see the proximity of Grímsvötn to Bárðarbunga.
The Grímsvötn system, with 3,326 earthquakes, is not the most seismically active volcano; activity is overshadowed by seismic activity at Bárðarbunga (5,464 earthquakes), Askja and Herðubreið (a combined 15,645 earthquakes) and Öræfajökull (4,770 earthquakes). The 2014 eruption of Holuhraun was both preceded and accompanied by intense seismic activity at Bárðarbunga, notably near the edges of the caldera, and deflation at Bárðarbunga. Since the eruption, Bárðarbunga has started to re-inflate. Our data set starts a year or more after the end of that eruption.
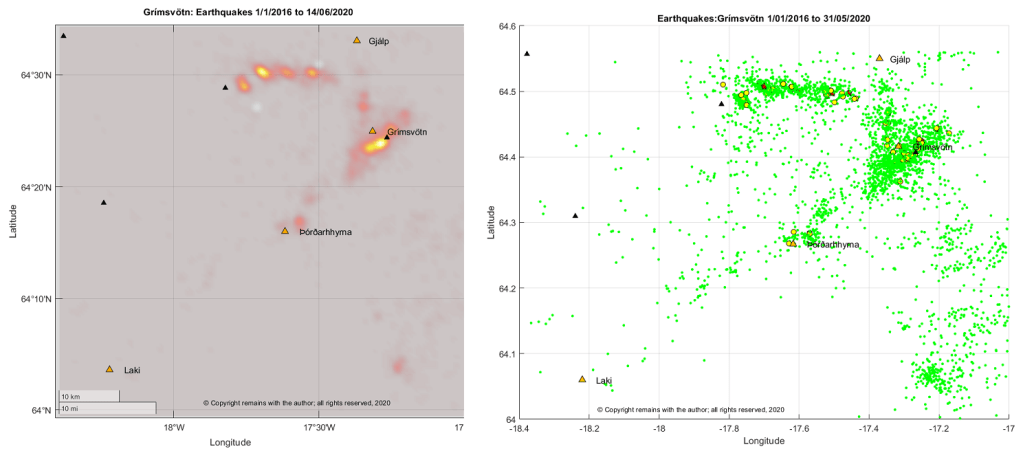
Looking more closely at Grímsvötn we see that earthquake activity is focused on the south east of the caldera and at an E-W trending fissure to the north east of the volcano. The E-W fissure is parallel to similar lines of activity further north at Bárðarbunga’s caldera. We also picked up some activity at Þórðarhyrna.
The earthquakes are telling only part of the story. Grímsvötn has had a steady stream of earthquake activity during the period, but without the SO2 measurements from scientists, we would not be certain that magma, itself, was near the surface.
For updates on Grímsvötn, please visit IMO’s website (details below).
The Armchair Volcanologist
22 June 2020
Sources and Further Reading
“Grímsvötn”, Magnús T. Guðmundsson and Guðrún Larsen (Institute of Earth Sciences – Nordvulk, University of Iceland) In: Oladottir, B., Larsen, G. & Guðmundsson, M.T., Catalogue of Icelandic Volcanoes. IMO, UI and CPD-NCIP. Retrieved from Icelandic Volcanoes: http://icelandicvolcanos.is/?volcano=GRV
“Þórðarhyrna”, Magnús T. Guðmundsson and Guðrún Larsen (Institute of Earth Sciences – Nordvulk, University of Iceland) In: Oladottir, B., Larsen, G. & Guðmundsson, M.T., Catalogue of Icelandic Volcanoes. IMO, UI and CPD-NCIP. Retrieved from Icelandic Volcanoes: http://icelandicvolcanos.is/?volcano=THO
Fig 2: Map: After Guðmundsson and Miller (1997), Guðmundsson et al (2013a), Jóhannesson and Sæmundsson (1998a), Jóhannesson et al (1990). Base data, Iceland Geo Survey, IMO, NLSI | Base map: IMO. In: Oladottir, B., Larsen, G. & Guðmundsson, M.T., Catalogue of Icelandic Volcanoes. IMO, UI and CPD-NCIP. Retrieved from Icelandic Volcanoes: http://icelandicvolcanos.is/?volcano=GRV
Smithsonian Institution Natural History Museum Global Volcanism Program (GVP): https://volcano.si.edu
Having visited Katla, let’s go further north to the Eastern Volcanic Zone and take a look at Hekla.
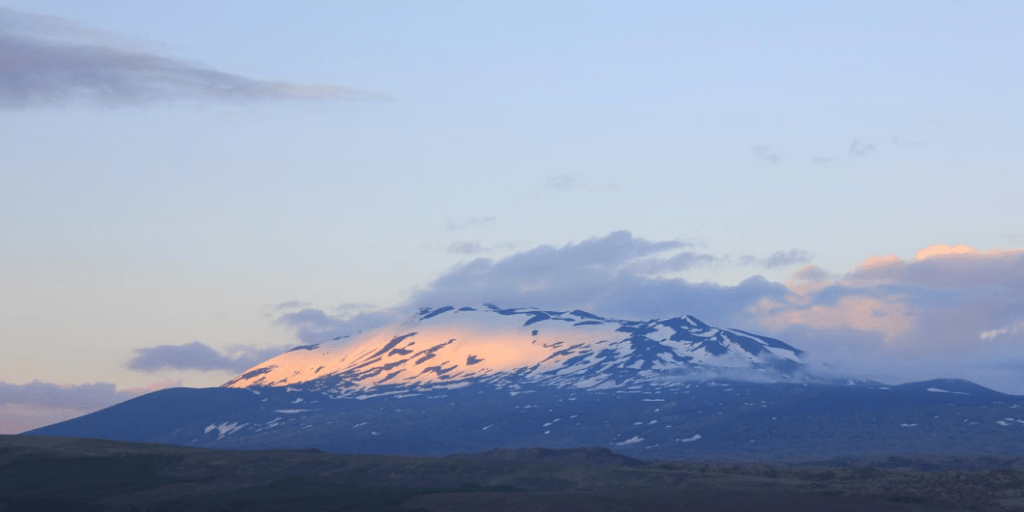
Hekla is an active snow-covered elongated stratovolcano, lying at the southern end of the Eastern Volcanic Zone in Iceland in a rift transform junction. Following the 1104 AD eruption, Hekla was called “The Gateway to Hell” – a name that stuck until the 19th century.
Fig 1: Hekla 22 June 2014; photo by Evgenia Ilynskya (see below for source).
The Hekla volcanic system comprises a 1490m high central volcano and a 60 km fissure swarm. The Heklugjá fissure, 5.5 km long cutting across the central volcano, is the site of many eruptions and gives Hekla its elongated shape. The Vatnafjöll fissure system, 40 km long and 9 km wide is considered part of the Hekla volcanic system. Hekla may have a small magma reservoir 4 km below the surface. She has permanent snow cover but no large glacier.
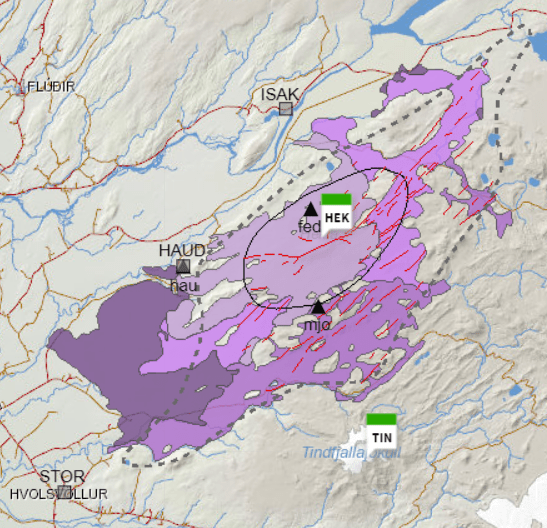
Fig 2: Hekla’s central volcano, fissure system and some lava flows. Retrieved from Icelandic Volcanoes (see Sources below). GPS and seismic stations are included so we can identify earthquake locations in later plots.
Hekla’s lavas differ from the rift zone volcanoes; her lavas are andesite, basaltic andesite, basalt / picro basalt, rhyolite and dacite. She erupts tephra and silicic to intermediate lavas from the central volcano. Eruptions tend to be a short plinian / subplinian phase followed by lava flows. Larger explosive silicic eruptions have produced enough tephra for the deposits to act as time markers in dating other eruptive activity in Iceland. She is a large fluorine producer which is hazardous to livestock. The hazards listed are tephra fallout, fluorine gas, pyroclastic flows and lava flows; the absence of a large glacier means that jökulhlaups are not a major hazard for Hekla.
The fissure system produces basaltic lavas and a small amount of tephra; its hazards are listed as lava flows and volcanic gas pollution.
Eruptive History
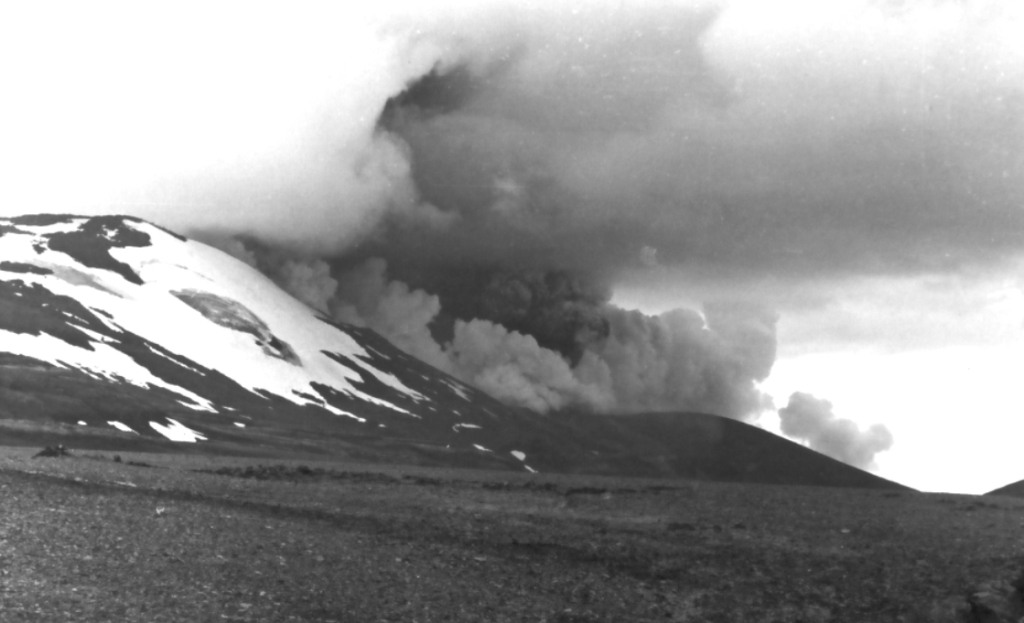
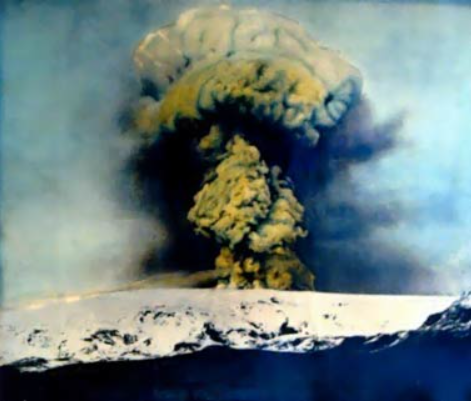
Fig 3: 1980 Eruption of Hekla by oxonhutch at English Wikipedia: Hekla,shared under CC-BY-2.5
According to GVP, Hekla has had 65 Holocene eruptions ranging from VEI 1 to 5. Larsen and Thordarson state that there have been 100 eruptions in the past 9000 years, 23 of which occurred in the last millennium with VEIs ranging from 0 to 5. The central volcano produces eruptions of VEI 2 to 6, VEI 3 to 4 being the most frequent; the longer the repose time between eruptions, the larger the ensuing eruption. The fissure system produces less explosive eruptions (VEI 1 to 2). Hekla’s largest known eruption, a VEI 6, occurred between 3000 to 4300 years ago. Traces of ash from Hekla have been found in Scandinavia, Germany, Ireland and the UK.
Hekla’s eruptive style has changed over time: from effusive basalt 9000 to 7000 years ago; to large explosive silicic eruptions between 7000 to 3000 years ago; and, then smaller more frequent mixed silicic and basaltic eruptions from 3000 years ago to the present day.
The most recent eruption was in 2000, with a VEI 2 to 3, 0.01km3 of airborne tephra 0.01km3 and 0.12km3 of lava; it thought that magma rose through a conduit from a depth of more than 10km to 1km below before heading towards a fissure on the Hekla ridge.
Hekla has an unusually low level of seismic activity. Her largest earthquakes are in the order of 2M when dormant and 3M during an eruption. She does not give much warning of an eruption: known precursors are earthquakes 25 to 90 minutes beforehand. Monitoring has increased since the last eruption so there should be more information about any precursors to future eruptions.
Recent Seismic Activity
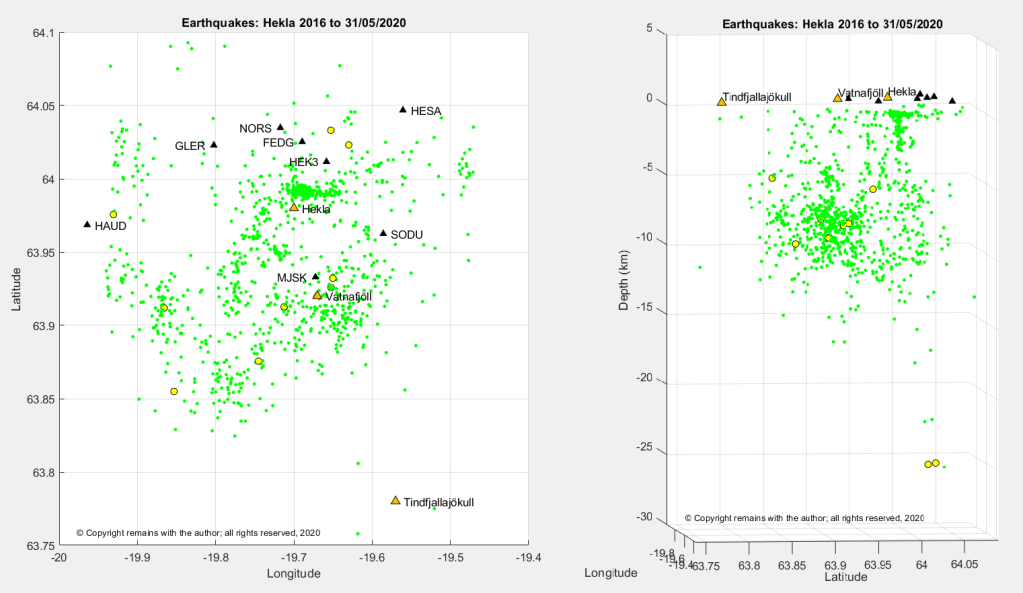
From the data set of earthquakes downloaded from IMO’s site for period 1 January 2016 to 31 May 2020, we extracted those for the Hekla – Vatnafjöll area: 63.7578°N, 19.4687°W to 64.0952°N, 19.9399°W. We found 1,018 earthquakes, compared to Katla’s 6,505 for the same period. The largest quake was 2.62 and the deepest 25.11km.
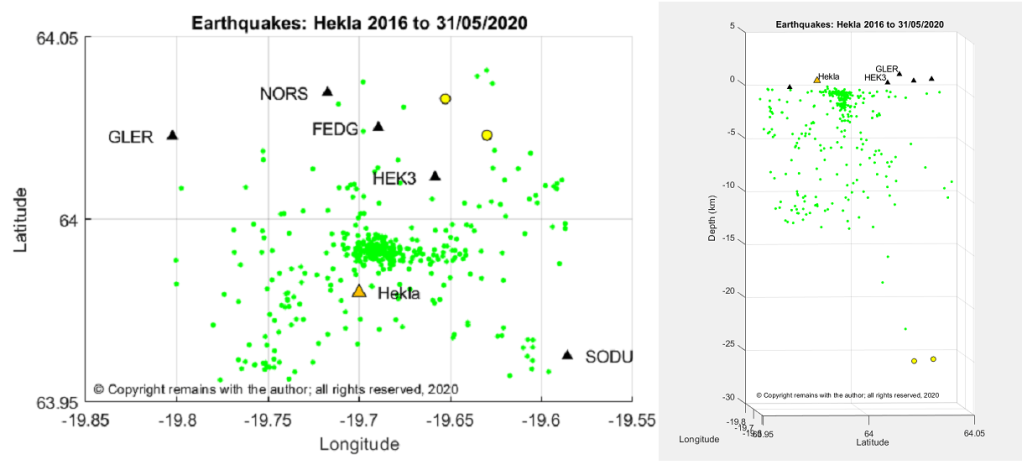
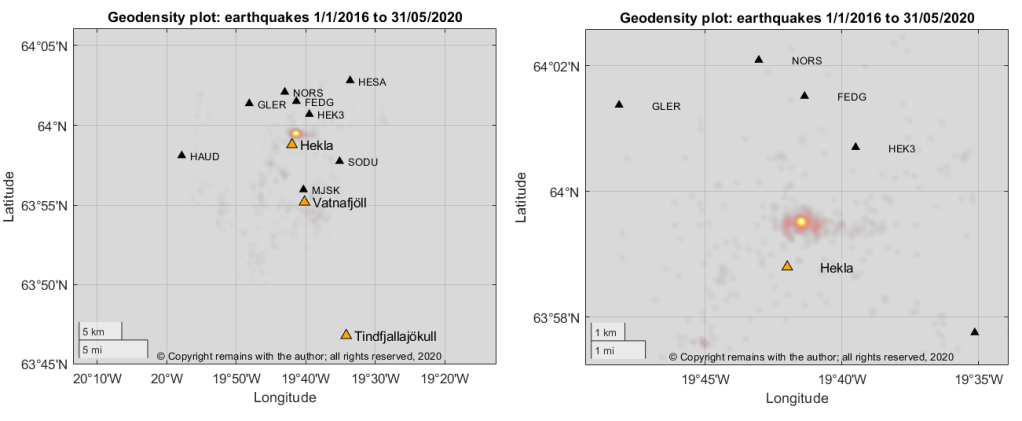
In our latitude v longitude scatter plot we can see that most earthquake activity is scattered along the fissure systems, with an E-W “cluster” to the south of GPS station HEK3, north of Hekla. The latitude v depth plot shows the activity near Vatnafjöll is occurring in the lithosphere, whereas there appears to be a conduit under Hekla. A close up of the cluster confirms this impression.
We looked for swarms in the data set to see if these account for the hot spot but did not find any large ones; the hot spot appears to be an accumulation of activity over the period. Hekla seems to have a slow magma feed.
“Hekla”, Guðrún Larsen (Institute of Earth Sciences – Nordvulk, University of Iceland) and Thor Thordarson (Faculty of Earth Sciences, University of Iceland). In: Oladottir, B., Larsen, G. & Guðmundsson, M.T., Catalogue of Icelandic Volcanoes. IMO, UI and CPD-NCIP. Retrieved from Icelandic Volcanoes: http://icelandicvolcanos.is/?volcano=HEK
Fig 2: Map: After Jóhannesson and Einarsson (1992), Jóhannesson and Saemundsson (1998a), Larsen et al (2013a), Base data, Iceland Geo Survey, IMO, NLSI | Base map: IMO. In: Oladottir, B., Larsen, G. & Guðmundsson, M.T., Catalogue of Icelandic Volcanoes. IMO, UI and CPD-NCIP. Retrieved from Icelandic Volcanoes: http://icelandicvolcanos.is/?volcano=HEK
Smithsonian Institution Natural History Museum Global Volcanism Program (GVP): https://volcano.si.edu
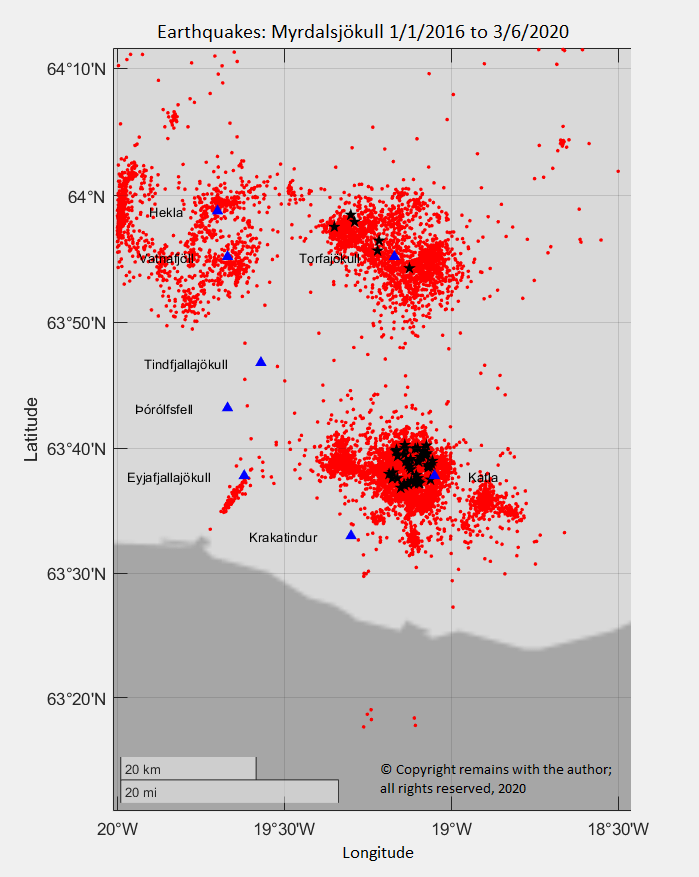
Continuing our theme of seismicity in Iceland, we have now reached the Mýrdalsjökull Region and are heading towards the Fire Districts in the Eastern Volcanic Zone.
We took a slight detour to set up a Glossary to explain some of the terms used here to help out. You can find it on the Menu bar.
Mýrdalsjökull lies at the southern end of the Eastern Volcanic Zone, near its junction with the South Iceland Seismic Zone. The South Iceland Seismic Zone is a transform fault system that links the West and East Volcanic Zones. The Eastern Volcanic Zone accommodates 40 to 100% of the spreading between the North American and the Eurasian Plates; the Western Volcanic Zone takes up the remainder. Active rifting on the Eastern Volcanic Zone terminates at Torfajökull volcano at the rift’s southern end. Katla, Eyjafjallajökull and more southerly volcanoes are on the Eurasian Plate.
Fig 1: Katla 1918 eruption. Image by RicHard-59 Public Domain
We updated our earthquake dataset so we are now looking at the period from 1 January 2016 to 31 May 2020. Apart from the continued swarm on the Reykjanes Peninsula, there has not been any unusual activity (to the untrained eye, at least). We used IMO’s latest earthquake map for Mýrdalsjökull as an indicator for the coordinates to extract the data for the region. This picked up five seismically active volcanic systems (Eyjafjallajökull, Hekla, Katla, Torfajökull and Vatnafjöll) and three inactive areas (Krakatindur, Þórólfsfell and Tindfjallajökull).
Let’s start by taking a closer look at Katla; the other volcanic centres will be covered in later posts.
The Katla Volcanic System
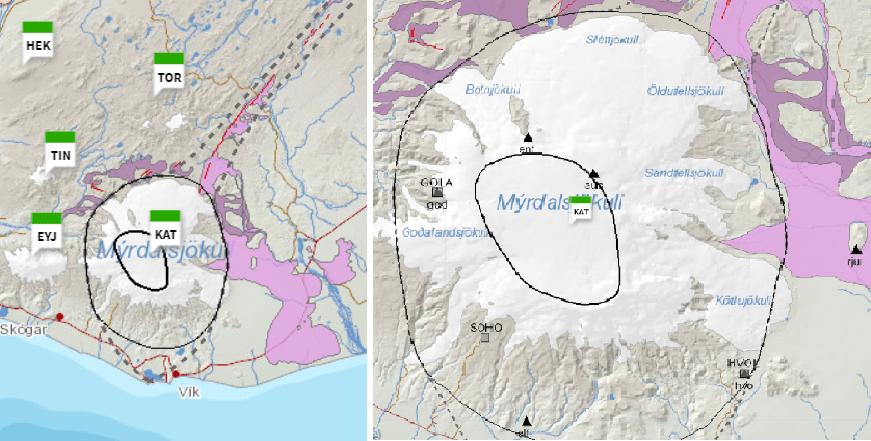
Katla is one of Iceland’s most active volcanoes. The volcanic system is 80 km long, made up of a 30 km wide central volcano and fissure systems. The central volcano has a 10km by 14km wide, 600m to 750m deep caldera with a 5km wide magma reservoir at a depth of 1.5 km. The Katla fissure, Kötlugjá, is located in the caldera. At the north west of the system is the Hólmsá fissure and to the north east, the Eldgjá fissure. There are also inactive fissures to the south. The Mýrdalsjökull ice cap covers most of the central volcano.
Fig 3: Images of the Katla Volcanic System retrieved from the CatalogueofIcelandicVolcanoes (see Sources below) showing the caldera rim, the outline of the central volcano and the north east fissure system. EYJ, TIN, HEK and TOR are other volcanic centres which may be covered in later posts.
Katla’s lavas are basalt/picro basalt, rhyolite and dacite, with a few intermediate hybrids, andesite and basaltic andesite. The basaltic eruptions are the most voluminous , sourced from the mantle via a spreading rift. She has also had many dacite eruptions. Lavas from the Eldgjá fissure are basaltic.
Eruptive History
Volcanism at Mýrdalsjökull began over 800,000 years ago and at Katla, 200,000 years ago. Studies of tephra have identified 200 basaltic and 14 silicic eruptions in the last 8,500 years; unfortunately, no more is known about what happened before the end of the last ice age.
Katla’s largest known eruption was a rhyolitic VEI 6 in 10600 BC which produced more than 10 km3 of rhyolite in pyroclastic flows and airborne tephra that reached 1,300 km from the volcano. The Sólheimar ignimbrite formed from the pyroclastic flows; and the tephra is referred to as the Skógar tephra (Iceland) or Vedde Ash (Norway, after the place where it was discovered).
GVP notes 132 Holocene eruptions for Katla, which range from VEI 3 to VEI 5. All Holocene eruptions occurred in the caldera, except for the 934 AD to 940 AD eruption of the Eldgjá fissure to the north east and the Hólmsá Fires in 6600 BC. Her recent eruptive style tends to be explosive basaltic eruptions from the caldera with tephra volumes up to 2km3, accompanied by jökulhlaups (glacial outburst floods). Water from melting ice cap contributes to the explosivity of the eruptions.
The last eruption to break the ice-cap was a VEI 4 in 1918 which produced an ash column up to 14 km in height, 0.7 km3 of airborne tephra, 1 km3 of debris from jökulhlaups and a small volcanic fissure; no lava emission was reported. The 1625 and 1755 eruptions, both VEI 5s, produced more tephra which reached further than 1,000 km from the central volcano.
The average time between eruptions has been cited as between 40 and 80 years on average. On that basis, Katla is expected to be gearing up for another eruption in the near future.
A period of unrest started in 1999 with a jökulhlaup, seismic tremors, geothermal activity and cauldron formation. There have been more recent subglacial eruptions: a jökulhlaup occurred in 2011, accompanied by a harmonic tremor and the formation of several ice-cauldrons, was thought to be indicative of a sub-glacial eruption; and the most recent jökulhlaup was in 2017, it is not clear if this was accompanied by a harmonic tremor.
Recent Seismicity
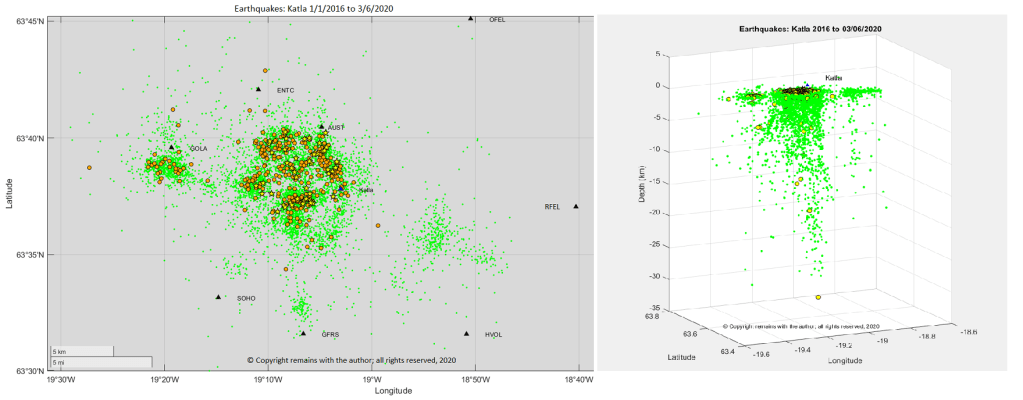
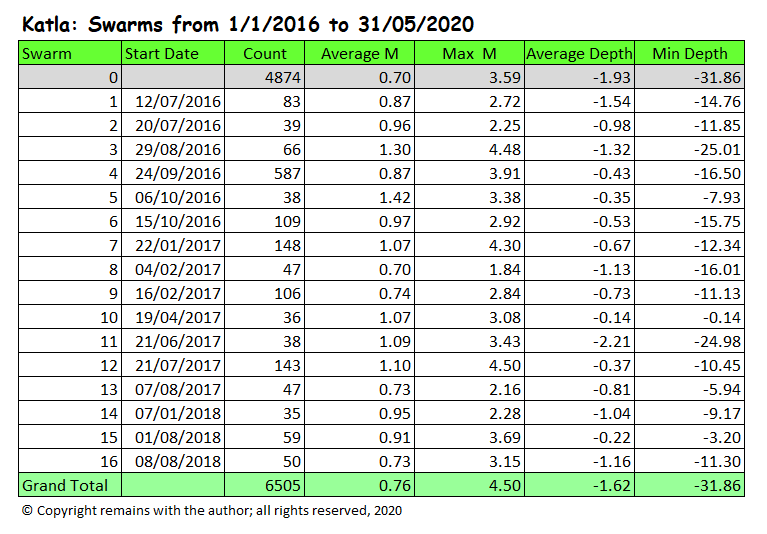
We extracted the earthquakes for Katla from the above data set using the coordinates 63.785°N, 19.4987°W to 63.4547°N,18.6608°W. This produced 6,505 earthquakes for the period 1 January 2016 to 31 May 2020.
Our plots show most activity in the caldera, some at the Goðabunga cryptodome and a low level of activity to the south and east of the caldera. Activity in the caldera is fed from a depth of 32km.
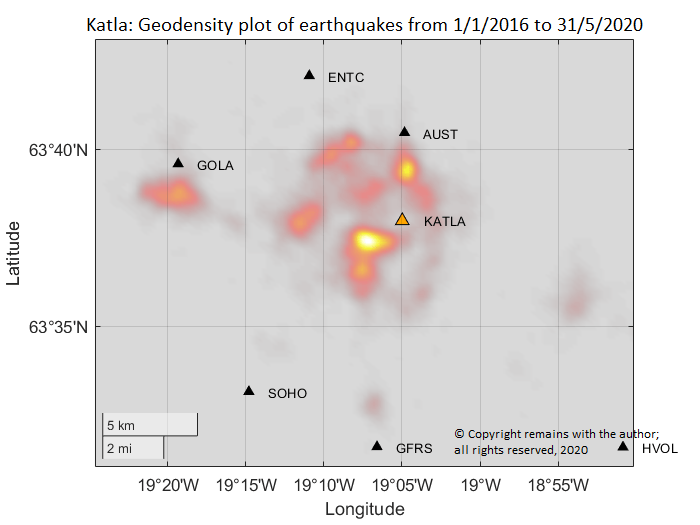
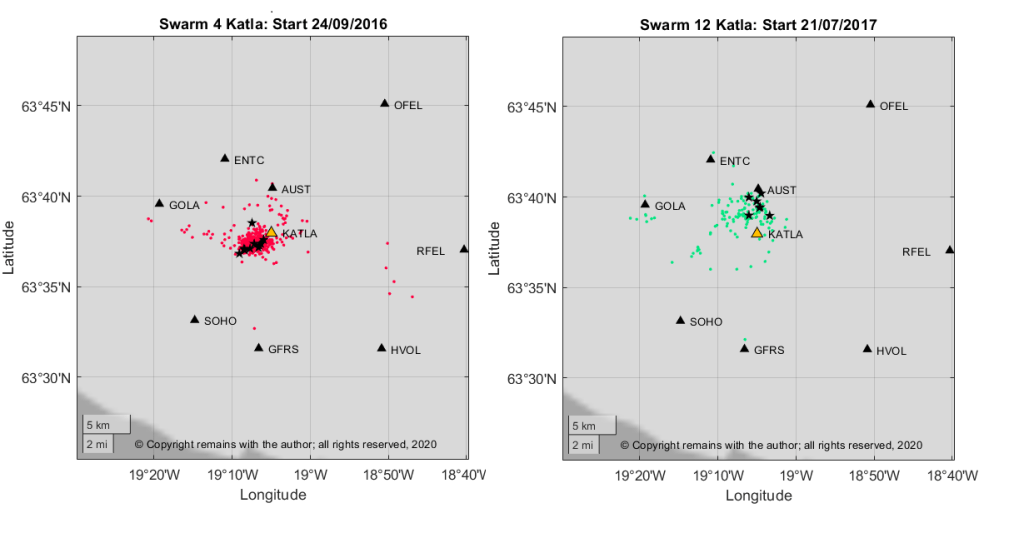
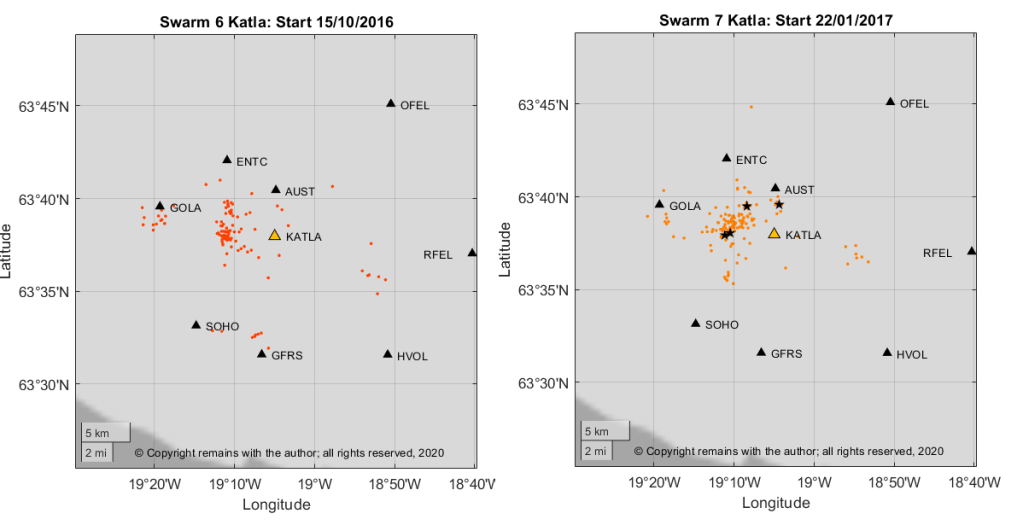
So what is causing the hot spots? We looked for earthquake swarms to see whether they are the cause of the hot spots in the geodensity plot. We used the criterion of 30 or more earthquakes in one day or in two consecutive days, which is a higher level of activity than Mýrdalsjökull’s “normal” activity. This showed 16 swarms (ref Appendix), of which five had more than 100 earthquakes; four of the five swarms were clustered (Swarms 4, 6, 7 and 12, shown below) and one was more spread out. Note: our analysis of swarms is not intended to pick up any small magma intrusions that have fewer than 30 earthquakes attached to them.
We see that Swarm 4 and Swarm 12 contributed to the hotter spots in the geodensity plots; the remaining hot spots seem to be caused by an accumulation of activity over four plus years in the data set. Without a clear map of the fissures within the caldera (Googling around did not find one), we cannot tell if the swarms coincide with known fissures. However, swarm 12 coincides with the 2017 jökulhlaup. Most of the swarms in the set appear to be part of the run up to a potential subglacial eruption. It is interesting to note that there do not appear to be any larger swarms after July 2017.
Earthquake swarms are precursors to eruptive activity. Unfortunately, as the last eruption to break through the ice-cap preceded any modern volcano monitoring, there is less certainty over what would precede another subaerial eruption, notably in respect of the intensity of swarms, magnitude of the earthquakes, jökulhlaups, and the time-frames.
It has been a while since Katla produced a large eruption. Let’s hope she sleeps for a bit longer; the world has enough to contend with at the moment.
Smithsonian Institution Natural History Museum Global Volcanism Program (GVP): https://volcano.si.edu/
“Iceland”, Thor Thordarson & Armann Hoskuldsson, Classic Geology in Europe 3, Terra Publishing, Third Impression, 2009
“Katla”, Guðrún Larsen and Magnús T. Guðmundsson (2016 March 7). In: Oladottir, B., Larsen, G. & Guðmundsson, M.T., Catalogue of Icelandic Volcanoes. IMO, UI and CPD-NCIP. Retrieved from Icelandic Volcanoes: http://icelandicvolcanos.is/?volcano=KAT
Fig 3: Map: After Jóhanneson and Saemundsson (1998a), Björnsson et al (2000) and Larsen (2000), Base data, Iceland Geo Survey, IMO, NLSI | Base map: IMO. In: Oladottir, B., Larsen, G. & Guðmundsson, M.T., Catalogue of Icelandic Volcanoes. IMO, UI and CPD-NCIP. Retrieved from Icelandic Volcanoes: http://icelandicvolcanos.is/?volcano=KAT
“Katla and Eyjafjallajökull Volcanoes”, Erik Sturkell, Páll Einarsson, Freysteinn Sigmundsson, Andy Hooper, Benedikt G. Ófeigsson, Halldór Geirsson and Halldór Olafsson, Developments in Quaternary Sciences, Volume 13, ISSN 1571-0866


#/media/File:Keilir_distance.jpg)