Category Archives: North America

Seismic and volcanic activity in North America

Mount St Helens : 18 May 1980 Eruption

Good Afternoon!

The 40th anniversary of the catastrophic eruption of Mount St Helens was on 18 May 2020.  On 18 May 1980, 57 people are known to have been killed, most probably by the initial lateral blast, not taking into account anyone unwise enough to have ignored the exclusion zone.  In addition, significant damage was done to the surrounding area.

Geologists Keith and Dorothy Stoffel, on a photography expedition, witnessed the catastrophic failure of the northern flank of the volcano: the north side of the volcano slid down then disintegrated in a massive debris avalanche. This was followed by the horizontal blast and the vertical ash column which reached a height of 20 km within 10 minutes. The threat of being engulfed in the ash cloud forced them to return to base.

Fig 1: Mount St Helens and Spirit Lake before the May 1980 eruption. Image cropped from one by Jim Nieland – US Forest Service, Public Domain

Geological Setting

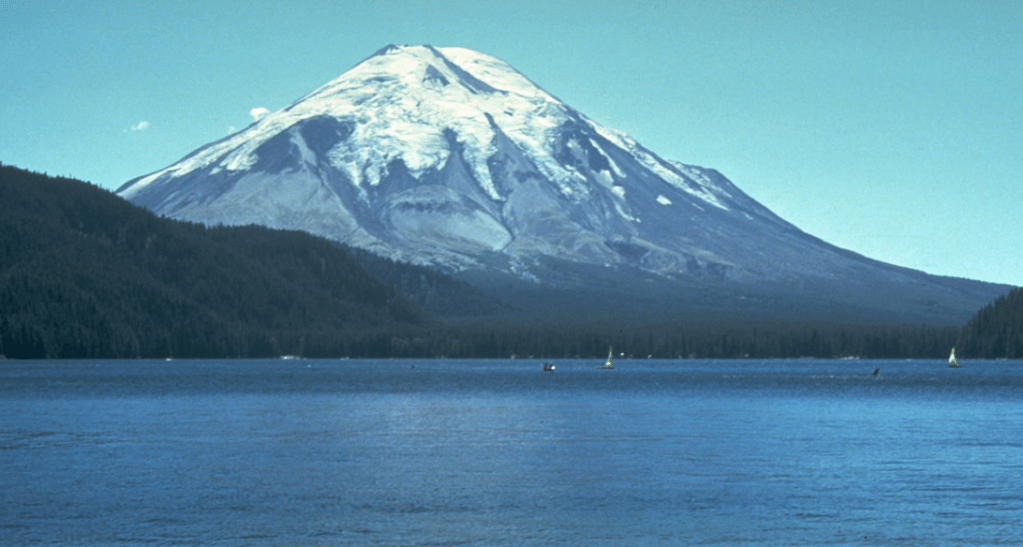
Mount St Helens lies at the front of the Cascades volcanic arc in Washington. She is the most active volcano in the arc. Her lavas are dacite, andesite / basaltic andesite, basalt / picro basalt, trachybasalt / tephrite basanite and trachyandesite / basaltic trachyandesite(1). The lavas are sourced from depths of 7 km – 14 km beneath the base of the edifice. Eruptions occurring after 1980 were fed from magma at a depth of less than 4 km. 

Volcanism here is driven by the subduction of the Juan de Fuca plate under the North American plate.  The arc starts in northern California and reaches up to British Columbia, including composite volcanoes and volcanic centres, calderas and back arc basalt shield volcanoes.  Lava compositions range from intermediate to high silica lava domes to low silica lave flows in the southern end of the arc.  The presence of low silica lavas at the southern end of the arc is attributed to extensional tectonics permitting the rise of more fluid magmas.

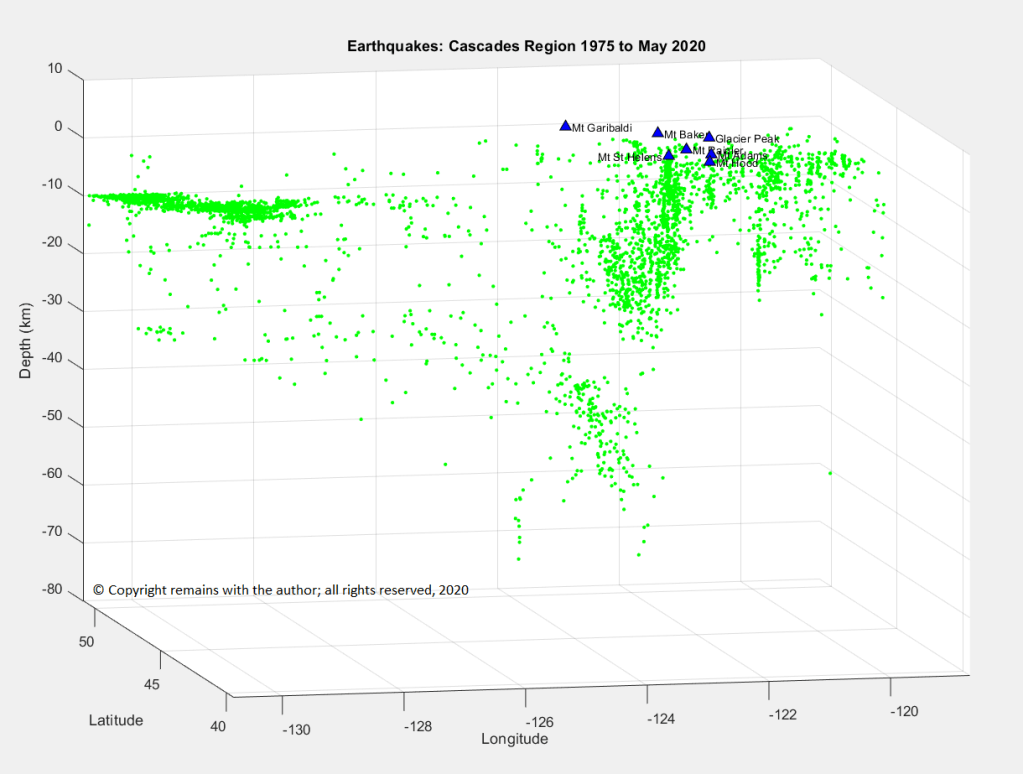
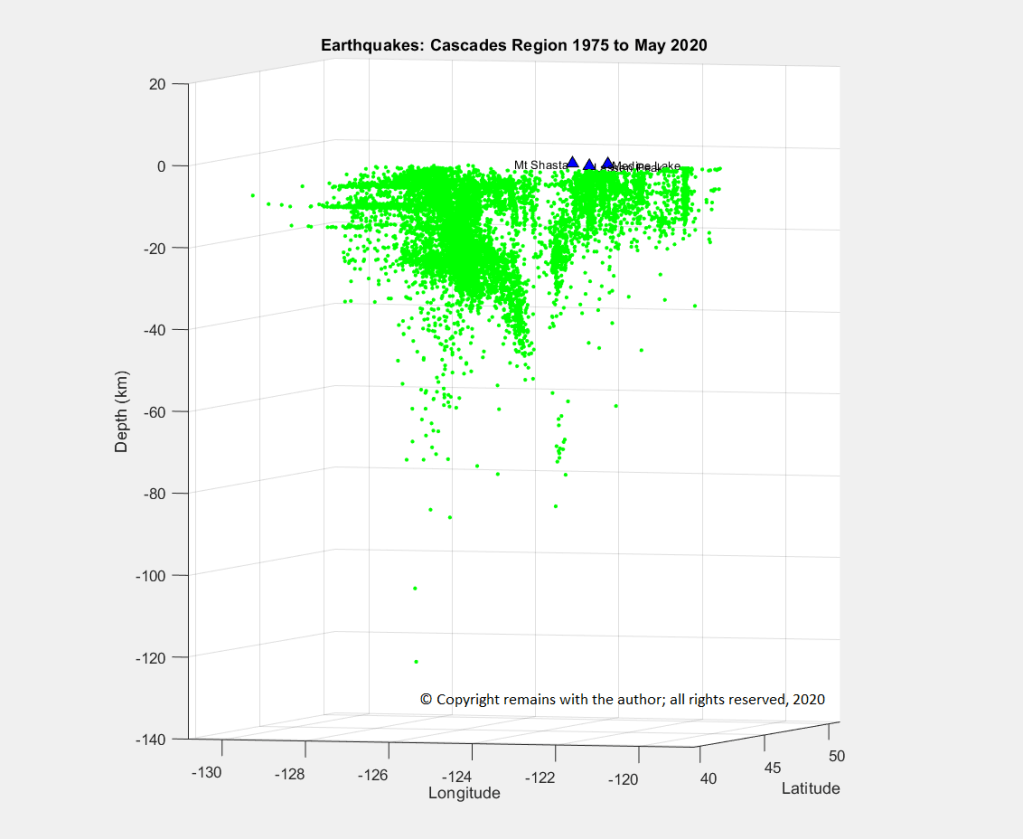
Seismicity in the Cascades

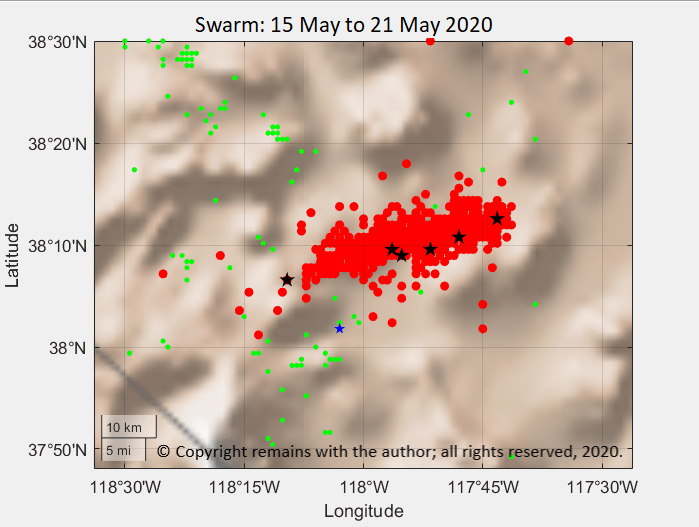
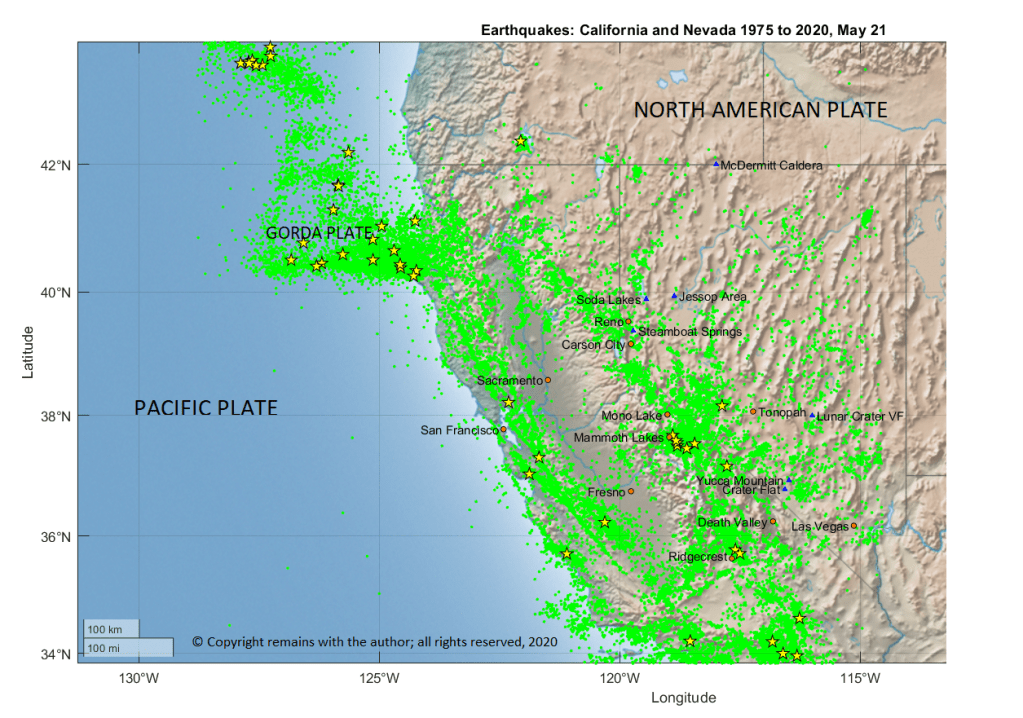
We downloaded the earthquakes between 39.470°N, 130.808°W and 50.870°N, 118.696°W from 1975 to 31 May 2020 to see what the subduction zone below the Cascades looks like.  There were 18,173 quakes over 2.5, of which 48 were between 6.0 and 7.0 and 4 had magnitudes in excess of 7.0. We found two areas where there was some evidence of subduction, one at the northern end of the region (north of latitude 45°N) and the other in the south (south of latitude 42°N), otherwise the area was relatively quiet in this period. 

Fig 2: Seismicity and some volcanoes of the Cascades plotted by the author. © Copyright remains with the author; all rights reserved, 2020.

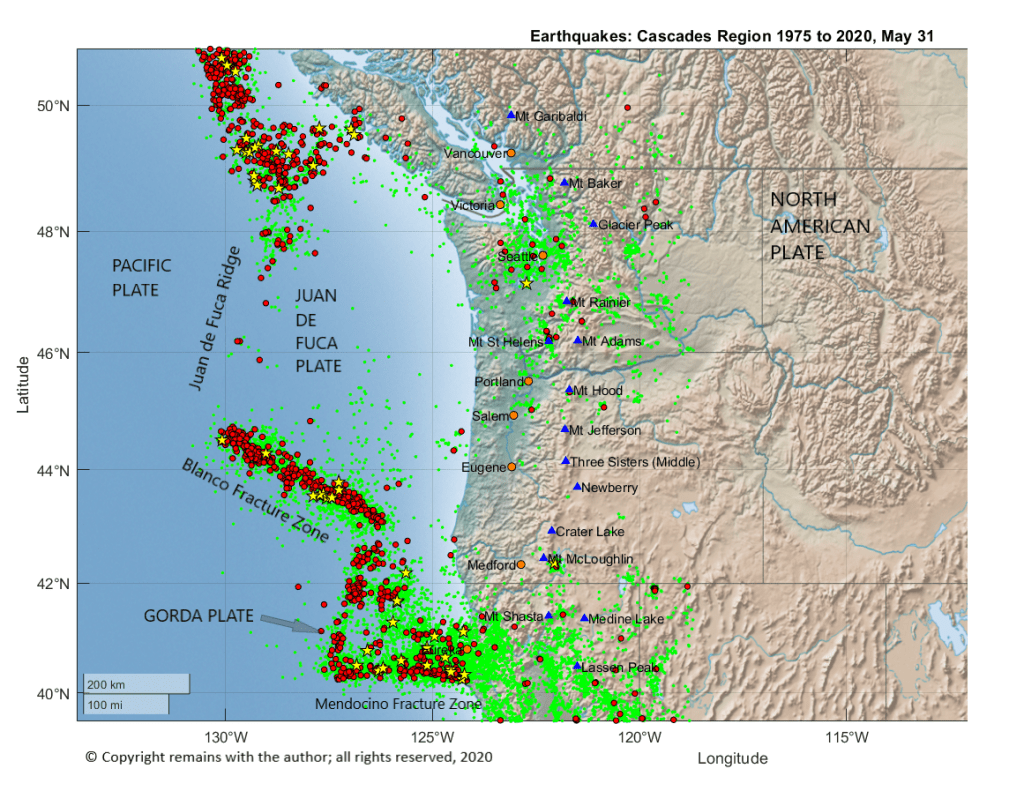
In order to see the subduction zone clearly we have had to removed the “noise” from the Blanco Fracture Zone.

Fig 3: The subduction zone north of latitude 45N from the above data set, plotted by the author.  © Copyright remains with the author, all rights reserved, 2020.
Fig 4: The subduction zone south of latitude 42N from the above data set, plotted by the author.  © Copyright remains with the author, all rights reserved, 2020.

Eruptive History

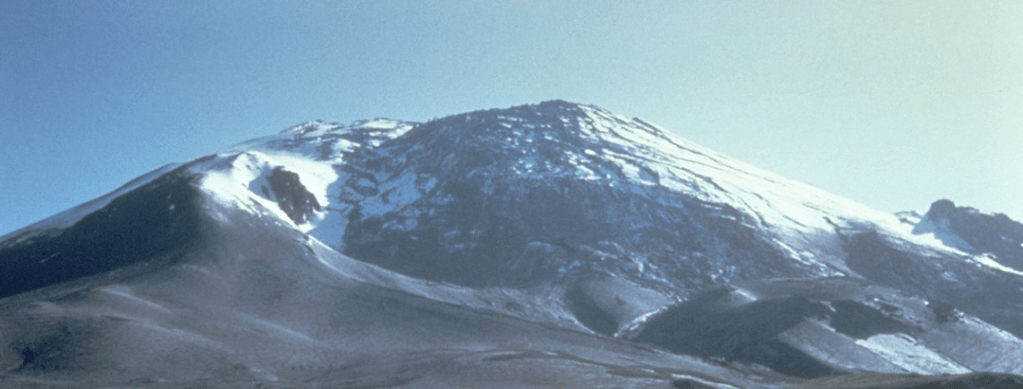
Mount St Helens is a relatively young volcano, formed around 40,000 to 50,000 years ago.  The current edifice was built in the last 2,200 years.   Before the eruption Mount St Helens was conical stratovolcano made up of lava, ash, pumice and other deposits with layers of basalt and andesite.  Dacite lava domes extruded from the summit and on the northern flank at Goat Rocks. 

Mount St Helens has had 44 Holocene eruptions according to GVP(1), of which one was VEI 6, and five were VEI 5, including the 1980 eruption.  Two years prior to the1980 eruption USGS volcanologists produced a hazard assessment, predicting an eruption with the next couple of decades. 

The 18 May 1980 Eruption

A 4.2 earthquake on 20 March 1980 and increased seismic activity showed that the volcano was reawakening.  Ash eruptions followed from 27 March 1980. A harmonic tremor, indicating magma ascent, set in.  Between the initial earthquake and to the earthquake preceding the eruption on 18 May 1980 there were 228 earthquakes over 2.5 and thousands more smaller quakes.

By the end of April, a 2 km wide cryptodome (bulge) had deformed the northern flank, swelling upwards at a rate of 1 metre per day to 150 metres above the existing topography by 12 May 1980.  Ground deformation was now presenting a serious hazard.  

Fig 5   The cryptodome on the north flank 27 April 1980, cropped from an image by Peter Lipman in  – CVO Photo Archives Mount St. Helens: A General Slide Set, Public Domain

On the morning of 18 May 1980 magma had reached a level of 2 km below the edifice. The slope failure was triggered by a 5.1 earthquake on the morning of 18 May 1980 (or vice versa).  A debris avalanche of rocks, glacier ice, soil and other debris ensued, reaching Spirit Lake and the Toutle River valley and ending up east of the Camp Baker logging base, 20 km further down the valley. 

Depressurisation of the system, resulted in the violent explosive lateral blast. The blast outran the initial avalanche, felling trees in an area of 600km2 and causing the most loss of life.  The blast included heated old lava from the volcano and left a relatively thin ash layer. 

After the blast, pumice was erupted in a vertical eruption column and pyroclastic currents covered the northern side of the volcano.  Pyroclastic deposits reached a depth of 40 metres in the Upper Toutle Valley.  It is estimated that at the time of the eruption the pyroclastic flows had temperatures in the region of 700°C.  Hot ash reaching Spirit Lake caused secondary eruptions as the water flashed to stream.

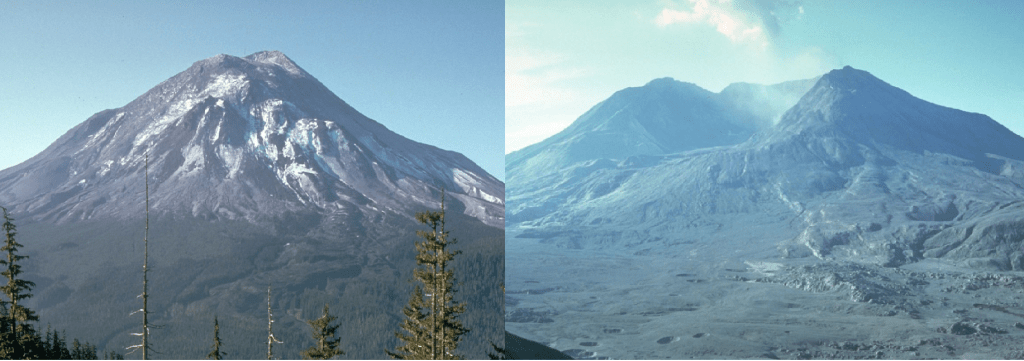
During the eruption, Mount St Helens lost its pristine cone and around 400 metres height; it was left with a 1.6 km wide crater, open on the northern side.

Fig 6 The day before the eruption and a few days later.  Both images are from Johnson’s Ridge (named after the volcanologist who lost his life in the eruption) and are by Harry Glicken – USGS Cascades Volcano Observatory, Public Domain

Post Eruption

From mid-June 1980, lava emerged into the crater forming a lava dome; subsequent eruptions have been crater-based lava dome.

Could Mount St Helens produce another catastrophic eruption? 

As she has a history of VEI 5s and a VEI 6, the answer is probably, yes.  Her lava types do produce explosive eruptions, including the dacite lava domes. If any of the remaining slopes are unstable, there could be future slope failure should ascending magma cause enough deformation but it’s possible that she may have to rebuild the cone first. 

In the meantime, a risk would be to the unwary straying too near to the crater should she have a smaller e.g. phreatic eruption, which are unpredictable. Phreatic eruptions occur when ground water in the edifice heated by hot rocks or magma flashes to steam.

GVP(1) have added a commemorative feature to its website giving a lot more information, including footage of the eruption.  We recommend that you take a look; it is well worth the visit(2).

The Armchair Volcanologist

2 June 2020

References & Further Reading

  1. Smithsonian Institution Natural History Museum Global Volcanism Program (GVP): https://volcano.si.edu/
  2. Mount St Helens 40th Anniversary, GVP: https://volcano.si.edu/projects/sthelens40/
  3. Mount St Helens, Wikipedia: https://en.wikipedia.org/wiki/Mount_St._Helens
  4. 1980 Eruption of Mount St Helens, Wikipedia, https://en.wikipedia.org/wiki/1980_eruption_of_Mount_St._Helens

© Copyright remains with the author; all rights reserved, 2020

Wobbles in the Walker Lane Deformation Belt

Good Afternoon,

An earthquake of magnitude of 6.5, 56 km west of Tonopah, Nevada, started an earthquake swarm on 15 May 2020; at the time of writing there had been 1,032 quakes.  Last year there was a large swarm to the south in the Eastern California Sheer Zone.  This prompted me to take a look at earthquake activity in both California and Nevada.

Geoscatter plot of the Tonopah swarm, May 2020
Fig 1: Latitude v Longitude plot of Nevada swarm 15 May to 21 May 2020 by the author. © Copyright remains with the author; all rights reserved, 2020

The May 2020 swarm occurred in the Walker Lane Deformation Belt.  According to USGS(1), this area has produced two dozen earthquakes with magnitude over 5.0M, mostly to the west and south.  In December 1968, there was a 6.8M quake 50 km to the north; and, in January 1934, a 6.5M 40km to the north west.

Geological Setting

The North American Plate and Pacific Plates slide past each other at the San Andreas Fault(2) on the west coast of North America.  There are small plates, the Gorda Plate(3) and Juan de Fuca Plates to the north of California, believed to be the remnants of the much larger Farallon Plate which subducted under the North American Plate.

The San Andreas Fault, a transform fault, accommodates 75+% of the relative motion between the North American and Pacific Plates.  The Walker Lane Deformation Belt(4), itself, takes up between 15% to 25% of the boundary motion.

The Mendocino Fracture Zone(5) links the junction between the San Andreas Fault and Cascadia Subduction Zone to the Gorda Ridge on the western boundary of the Gorda Plate.

The Walker Lane Deformation Belt is a roughly 800km long trough, roughly aligned with the California / Nevada state border: the northern end lies at the junction of the Honey Lake Fault Zone, Warm Springs Valley Fault Zone, the Pyramid Lake Fault Zone and the southern boundaries of the Modoc Plateau and Columbia Plateau; and, the southern end lies at the intersection of Death Valley and the Garlock Fault.  

The Eastern California shear zone is a portion of the Walker Lane Deformation Belt that links Owens Valley to the San Andreas Fault.  It is an area that has produced several quakes of 7+M:  1872 Lone Pine quake in Owens Valley; 1992 Landers Earthquake; 1999 Hector Mine earthquake; and, most recently, the 2019 Ridgecrest swarm.

Seismic Activity 1975 to May 21, 2020

This swarm is not the first in the area.  If we look at seismic activity in California and Nevada, we should see the activity from the Walker Lane Deformation Belt to the San Andreas Fault.

We downloaded earthquake data between 43.860°N, 128.786°W and 33.68°N, 114.548°W with magnitude over 2.5 from USGS’ site(1).  In the plot below, we can see earthquakes clearly delineating the plate boundaries of the Gorda Plate, Pacific Plate and the North American Plate.

Fig 2: Latitude v Longitude plot of earthquakes occurring between 1975 and May 21, 2020.  Yellow stars denote earthquakes over magnitude 6.0. Plotted by the author. © Copyright remains with the author; all rights reserved, 2020

A geodensity plot of the above data set, weighted by earthquake magnitude, shows the areas of most activity:  Mammoth Lakes, an area to the west of Sacramento, and the Mendocino Fracture Zone, east of the southern boundary of the Gorda Plate.

Fig 3: Geodensity plot of earthquakes occurring between 1975 and May 21, 2020 by the author. © Copyright remains with the author; all rights reserved, 2020

We looked through the data set to find the larger earthquake swarms; we found 17 swarms (groups of earthquakes exceeding 30 per day).  With the exception of two swarms in April 1992, this was successful.  In April 1992, there appears to be two swarms occurring at the same time so we split them based on geographic location.  

The swarms correlate with the areas of activity displayed in the geodensity plot, with the exception of the area to the west of Sacramento.  The activity to the west of Sacramento has not experienced any large swarms or quakes over 6.0.

Fig 4: Earthquake swarms occurring in California and Nevada between 1975 and 21 May 2020 plotted by the author.  The swarms are colour coded from magenta as the earliest, through red, orange, yellow, green, blue and black as the latest.  Earthquakes with magnitude over 6.0 are denoted as yellow stars. © Copyright remains with the author; all rights reserved, 2020

Mammoth Lakes(6) is located near the Long Valley Caldera and Mammoth Mountain, an area of rhyolitic, rhyodacite and dacite lava domes and hot springs.  Mammoth Mountain last erupted around 700 years ago, with a small phreatic eruption, but still produces large volumes of CO2. 

Looking more closely at the area to the west of Sacramento (38.74°N, 122.9°W to 38.86°N,122.7°W), we found that it has had 2,746 earthquakes spread consistently throughout the period from 1975 to May 21, 2020, of which the maximum magnitude was 5.01.  the activity is located near Clear Lake(7), California, and the Clear Lake Volcanic Field.  The Clear Lake Volcanic Field has not erupted for thousands of years but is not wholly inactive, with volcanic type earthquakes, hot springs and seepage of volcanic gas. 

Fig 5:  Location of the activity to the west of Sacramento by the author.  Green dots represent earthquake locations. © Copyright remains with the author; all rights reserved, 2020

Although 44 years of earthquakes feels like a long period to study, this is a very short period of time geologically-speaking so any apparent trends may not be representative and, while very interesting and worthy of investigation, may not be enough for future predictions. 

So how would geologists make predictions or update risk assessments?  In addition to the type of work above, they would look at ground deformation and movement (the ground may stretch before fracturing), and, for volcanoes, volcanic gas emissions, and gravitational and temperature changes.

The Armchair Volcanologist

21 May 2020

© Copyright remains with the author; all rights reserved, 2020

References & Further Reading

Earthquake data was downloaded from USGS; the rest from Wikipedia.

  1. USGS https://earthquake.usgs.gov/
  2. San Andreas Fault, Wikipedia: https://en.wikipedia.org/wiki/San_Andreas_Fault
  3. Gorda Plate, Wikipedia: https://en.wikipedia.org/wiki/Gorda_Plate
  4. Walker Lane, Wikipedia: https://en.wikipedia.org/wiki/Walker_Lane
  5. Mendocino Fracture Zone, Wikipedia: https://en.wikipedia.org/wiki/Mendocino_Fracture_Zone
  6. Mammoth Lakes, Wikipedia: https://en.wikipedia.org/wiki/Mammoth_Lakes,_California
  7. Clear Lake, Wikipedia: https://en.wikipedia.org/wiki/Clear_Lake_(California)

Plots are the author’s own work.