14.03.2021: The magma intrusion on the Reykjanes Peninsula appears to be edging further southward. The longer this continues, the more likely an eruption. New plots added (Figs 13 – 15).
Update 14.03.2021
We have moved updates to the beginning of this post. The original post from 9 March 2021 and the earlier update are below.
We have updated our plots to 14.03.2021 17:46 for the area between 63.83314°N, 22.55148°W to 63.96605°N, 21.8566°W . Here are the results; the magma intrusion appears to be edging slowly further southwards, if we use the Department of Civil Protection’s line that the earthquake locations are the best indicator at the moment of where the magma is.
For the current status and advice, please consult IMO.
The Armchair Volcanologist
Update 12.03.2021
Since we wrote [our original post], the earthquake swarm continues unabated with several thousand more earthquakes and some more tremor pulses.
The Department of Civil Protection report today includes the following:
“Earthquake activity now reaches up to the Nátthagi valley south of Fagradalsfjall, which suggests that the southernmost end of the magma path lies there.
The magma path continues to expand although there is some uncertainty regarding the pace of the magma flow. Data has indicated that the magma path has been moving towards the south coast in the last few days, but latest surveys do not indicate that the path has moved notably in the last 24 hours.
With view of the eruption history and geological research, a volcanic fissure opening south of Fagradalsfjall and reaching the ocean is unlikely. Given the current circumstances, an undersea eruption with associated ash eruption is therefore unlikely.
As has been stated earlier in the Science Board’s notifications, while the magma path continues to expand it must be assumed that an eruption may occur in the area. The longer the current situation lasts, the more likely an eruption becomes. “
They also note that gas measurements are being taken in the area.
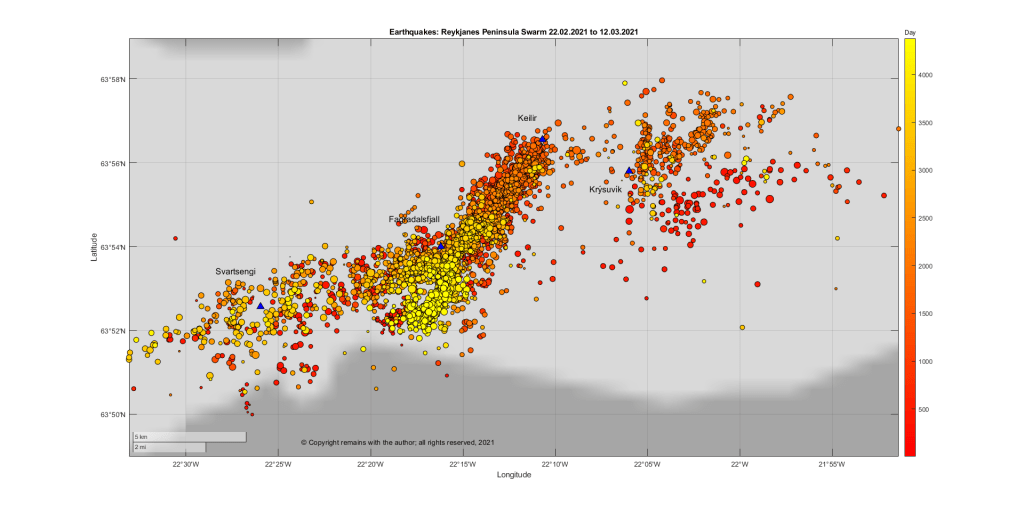
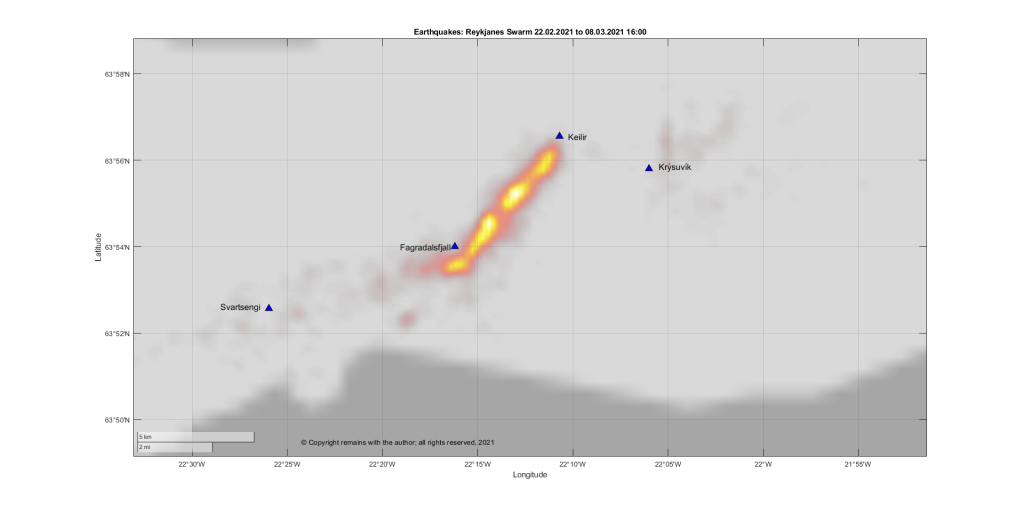
Our updated plots show the seismic activity moving further southward, notably the geodensity plot in Fig 12. There is also some parallel activity further west on a much smaller scale.
For the current status and advice, please consult IMO.
The Armchair Volcanologist
09.03.2021
An eruption considered likely; magma c. 1km below the surface.
Good Afternoon!
Despite the earlier tremor pulses, the Krýsuvík Volcanic System has not yet erupted. However, as seismicity continues to be intense, with well over 34,000 earthquakes recorded by Iceland’s SIL system now since 24 February 2021, it is thought that an eruption is likely.
The latest report from Iceland’s Civil Protection Service Council on March 8, 2021, states that if an eruption occurs, the most likely scenario is still a fissure eruption between Fagradalsfjall and Keilir. A magma intrusion (they use the term tunnel) is forming in the region, with most recent activity at its southern end. Magma has now reached an upper depth of c. 1 km. GPS and satellite readings indicate that the magma flow has decreased in the past week. If the intrusion continues to grow, further surges in seismic activity can be expected.
The earthquakes trending westward from the vicinity of the magma intrusion are thought to be the result of the crust accommodating the intrusion. No other magma movement has been detected during this swarm.
So where are Fagradalsfjall and Keilir? Here is a map (with directions on how to drive from one to the other, not that we would recommend that at the moment).
Fig 1: Extract from Google Maps showing the location of Fagradalsfjall and Keilir.
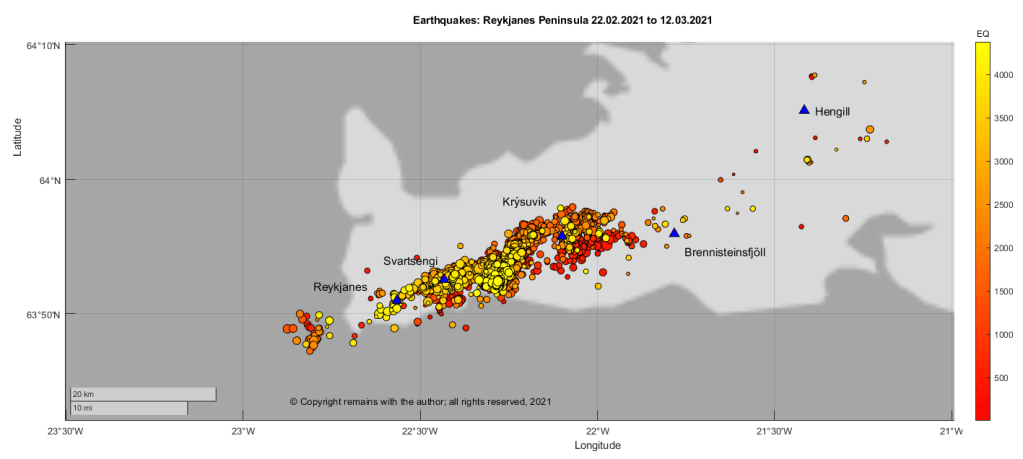
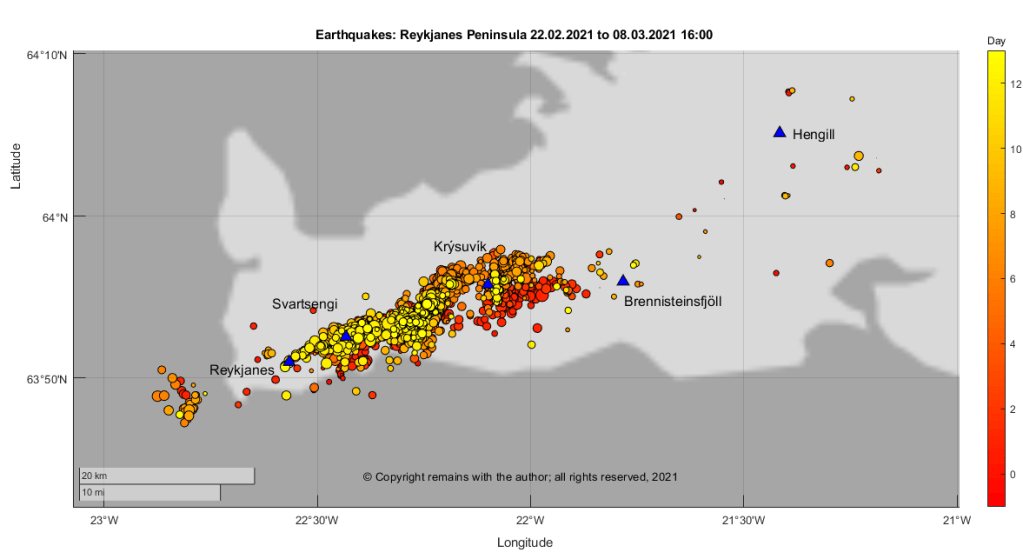
We have plotted the confirmed earthquakes for week 8 and week 9 2021, plus a few hours of yesterday, between 63.7°N, 21.0°W to 64.4°N, 23.0°W download from IMO’s site. Here are the latest plots for the Reykjanes Peninsula, 63.7°N, 21.0°W to 64.4°N, 23.0°W:
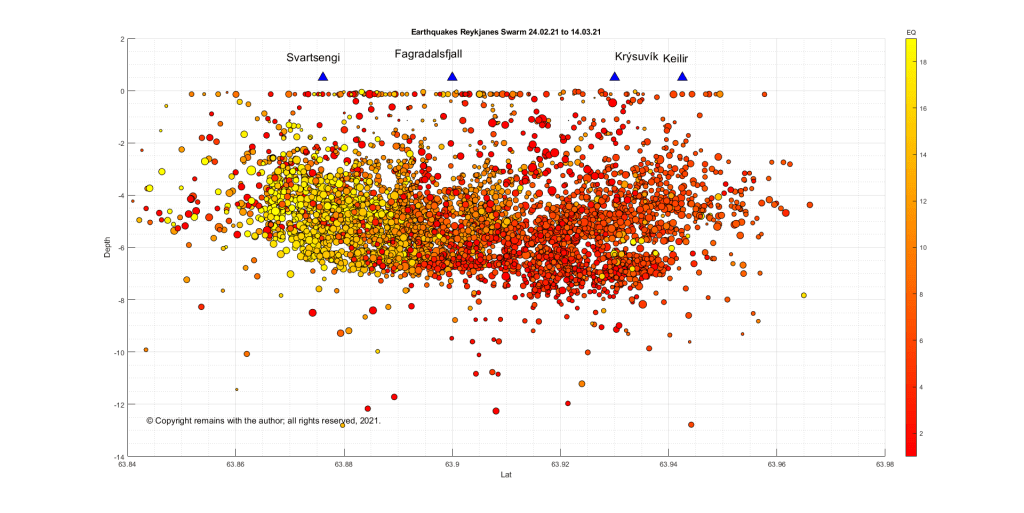
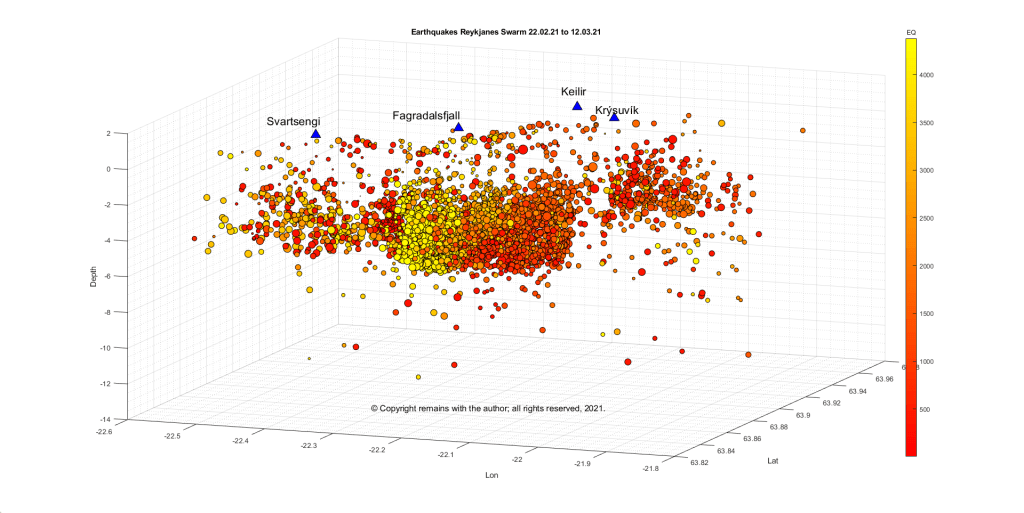
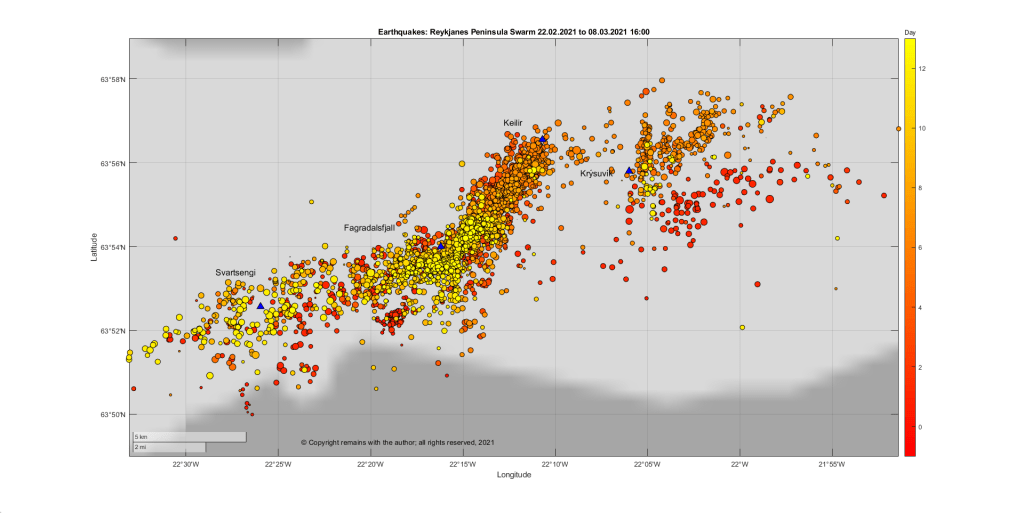
If we zoom in on the area between 63.83314°N, 22.55148°W to 63.96605°N, 21.8566°W we can take a closer look at the intrusion, itself, (or the earthquakes magma movement is causing). The area was selected to take in Svartsengi, Fagradalsfjall, Keilir and Krýsuvík.
Since we downloaded the data for the above plots, IMO have reported another short-lived burst in seismic activity at 05:20 this morning with a seismic tremor Mt. Fagradalsfjall, south of the intrusion.
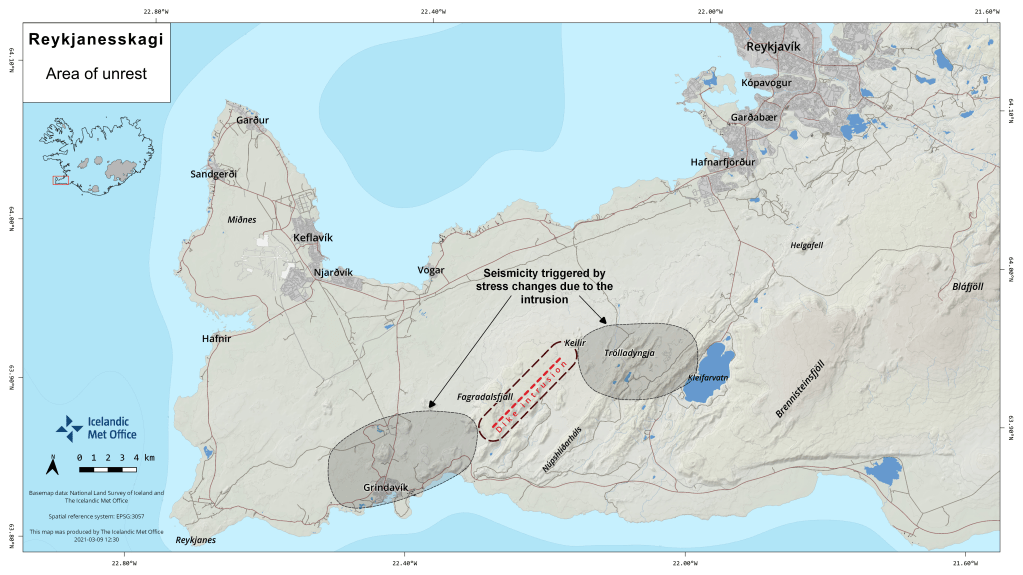
IMO have produced a map of the dike intrusion and the areas of seismic activity that are arising due to the increased tension in the crust caused by the intrusion.
Fig 8: Map by the Icelandic Met Office showing the dike intrusion and the areas of stress.
For the current status and advice, please consult IMO.
Having visited Katla, let’s go further north to the Eastern Volcanic Zone and take a look at Hekla.
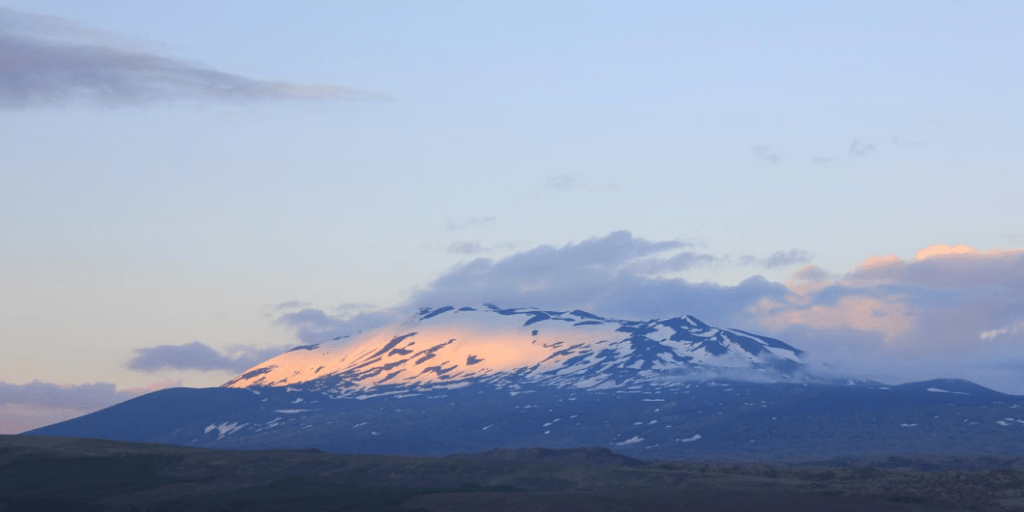
Hekla is an active snow-covered elongated stratovolcano, lying at the southern end of the Eastern Volcanic Zone in Iceland in a rift transform junction. Following the 1104 AD eruption, Hekla was called “The Gateway to Hell” – a name that stuck until the 19th century.
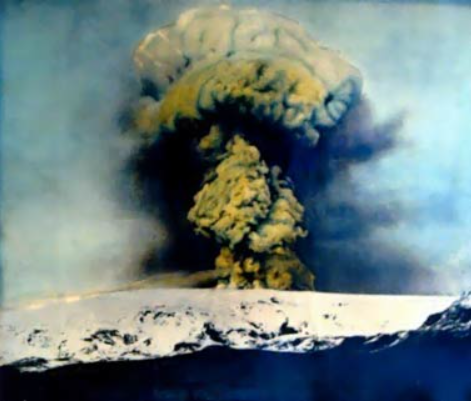
Fig 1: Hekla 22 June 2014; photo by Evgenia Ilynskya (see below for source).
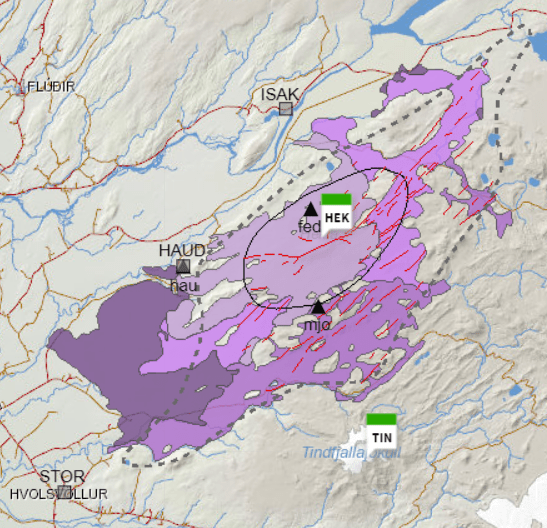
The Hekla volcanic system comprises a 1490m high central volcano and a 60 km fissure swarm. The Heklugjá fissure, 5.5 km long cutting across the central volcano, is the site of many eruptions and gives Hekla its elongated shape. The Vatnafjöll fissure system, 40 km long and 9 km wide is considered part of the Hekla volcanic system. Hekla may have a small magma reservoir 4 km below the surface. She has permanent snow cover but no large glacier.
Fig 2: Hekla’s central volcano, fissure system and some lava flows. Retrieved from Icelandic Volcanoes (see Sources below). GPS and seismic stations are included so we can identify earthquake locations in later plots.
Hekla’s lavas differ from the rift zone volcanoes; her lavas are andesite, basaltic andesite, basalt / picro basalt, rhyolite and dacite. She erupts tephra and silicic to intermediate lavas from the central volcano. Eruptions tend to be a short plinian / subplinian phase followed by lava flows. Larger explosive silicic eruptions have produced enough tephra for the deposits to act as time markers in dating other eruptive activity in Iceland. She is a large fluorine producer which is hazardous to livestock. The hazards listed are tephra fallout, fluorine gas, pyroclastic flows and lava flows; the absence of a large glacier means that jökulhlaups are not a major hazard for Hekla.
The fissure system produces basaltic lavas and a small amount of tephra; its hazards are listed as lava flows and volcanic gas pollution.
Eruptive History
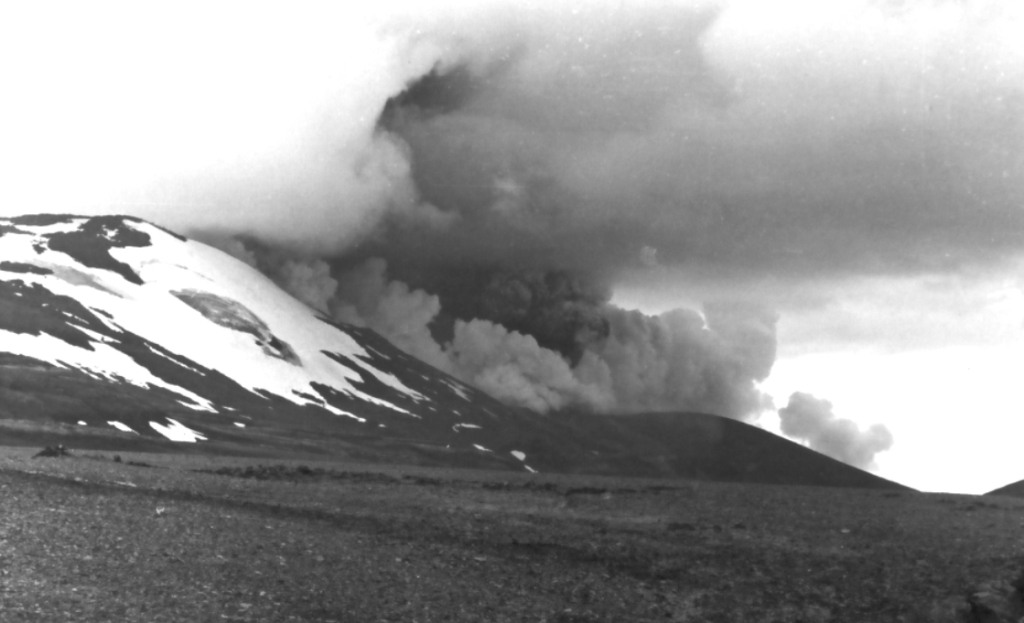
Fig 3: 1980 Eruption of Hekla by oxonhutch at English Wikipedia: Hekla,shared under CC-BY-2.5
According to GVP, Hekla has had 65 Holocene eruptions ranging from VEI 1 to 5. Larsen and Thordarson state that there have been 100 eruptions in the past 9000 years, 23 of which occurred in the last millennium with VEIs ranging from 0 to 5. The central volcano produces eruptions of VEI 2 to 6, VEI 3 to 4 being the most frequent; the longer the repose time between eruptions, the larger the ensuing eruption. The fissure system produces less explosive eruptions (VEI 1 to 2). Hekla’s largest known eruption, a VEI 6, occurred between 3000 to 4300 years ago. Traces of ash from Hekla have been found in Scandinavia, Germany, Ireland and the UK.
Hekla’s eruptive style has changed over time: from effusive basalt 9000 to 7000 years ago; to large explosive silicic eruptions between 7000 to 3000 years ago; and, then smaller more frequent mixed silicic and basaltic eruptions from 3000 years ago to the present day.
The most recent eruption was in 2000, with a VEI 2 to 3, 0.01km3 of airborne tephra 0.01km3 and 0.12km3 of lava; it thought that magma rose through a conduit from a depth of more than 10km to 1km below before heading towards a fissure on the Hekla ridge.
Hekla has an unusually low level of seismic activity. Her largest earthquakes are in the order of 2M when dormant and 3M during an eruption. She does not give much warning of an eruption: known precursors are earthquakes 25 to 90 minutes beforehand. Monitoring has increased since the last eruption so there should be more information about any precursors to future eruptions.
Recent Seismic Activity
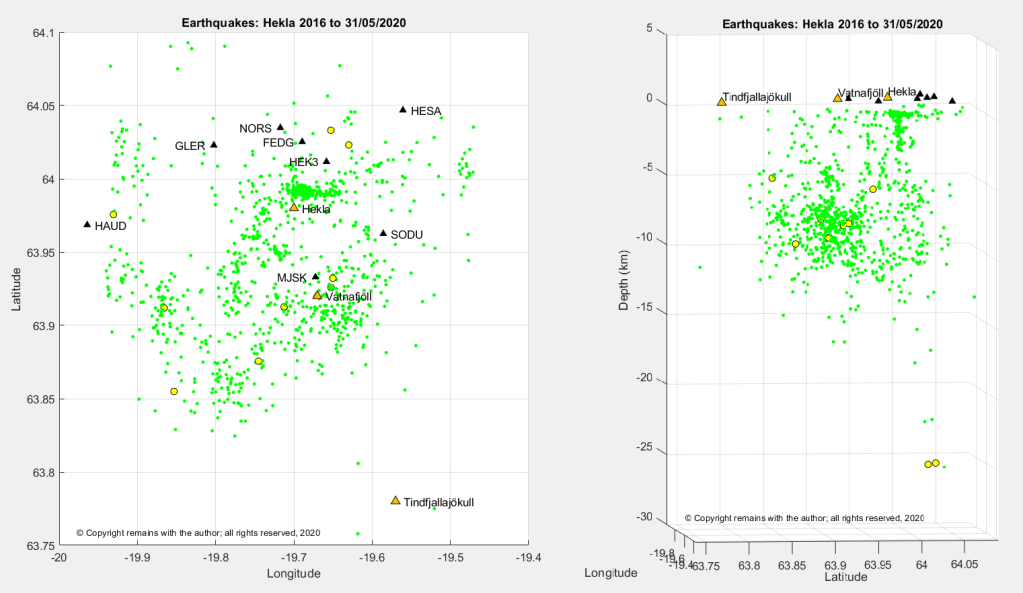
From the data set of earthquakes downloaded from IMO’s site for period 1 January 2016 to 31 May 2020, we extracted those for the Hekla – Vatnafjöll area: 63.7578°N, 19.4687°W to 64.0952°N, 19.9399°W. We found 1,018 earthquakes, compared to Katla’s 6,505 for the same period. The largest quake was 2.62 and the deepest 25.11km.
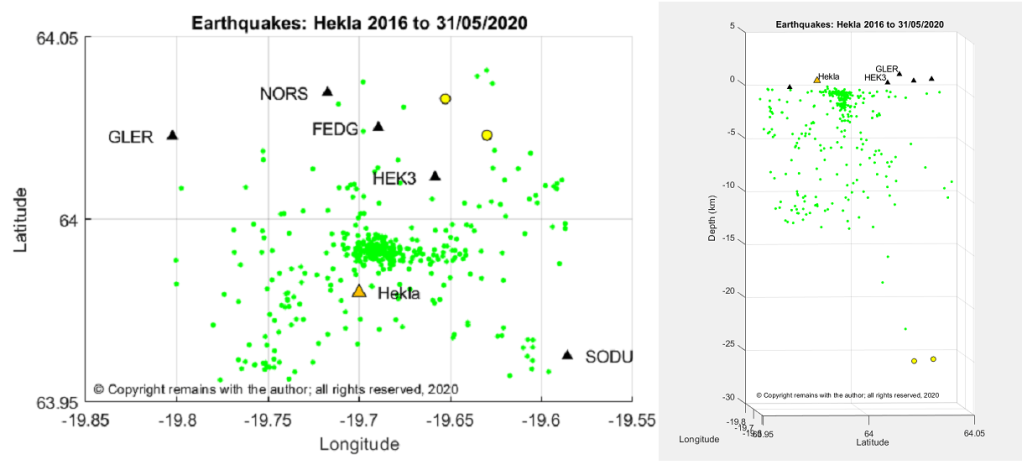
In our latitude v longitude scatter plot we can see that most earthquake activity is scattered along the fissure systems, with an E-W “cluster” to the south of GPS station HEK3, north of Hekla. The latitude v depth plot shows the activity near Vatnafjöll is occurring in the lithosphere, whereas there appears to be a conduit under Hekla. A close up of the cluster confirms this impression.
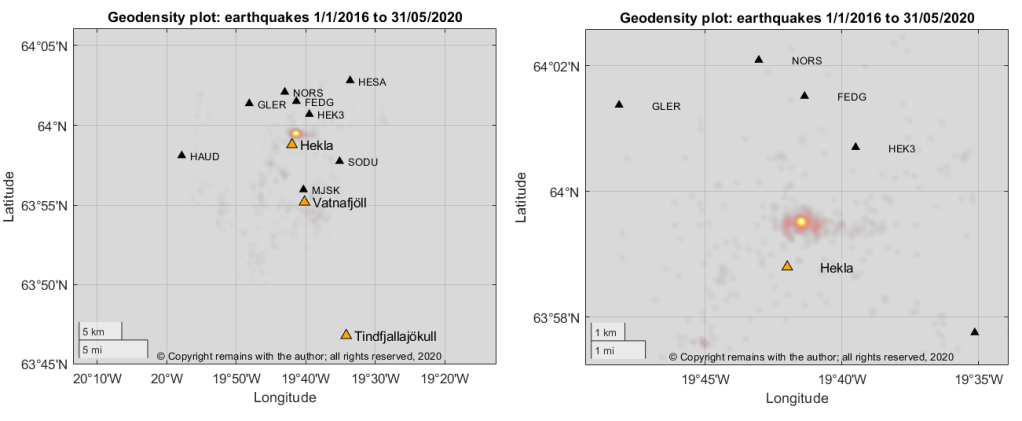
We looked for swarms in the data set to see if these account for the hot spot but did not find any large ones; the hot spot appears to be an accumulation of activity over the period. Hekla seems to have a slow magma feed.
“Hekla”, Guðrún Larsen (Institute of Earth Sciences – Nordvulk, University of Iceland) and Thor Thordarson (Faculty of Earth Sciences, University of Iceland). In: Oladottir, B., Larsen, G. & Guðmundsson, M.T., Catalogue of Icelandic Volcanoes. IMO, UI and CPD-NCIP. Retrieved from Icelandic Volcanoes: http://icelandicvolcanos.is/?volcano=HEK
Fig 2: Map: After Jóhannesson and Einarsson (1992), Jóhannesson and Saemundsson (1998a), Larsen et al (2013a), Base data, Iceland Geo Survey, IMO, NLSI | Base map: IMO. In: Oladottir, B., Larsen, G. & Guðmundsson, M.T., Catalogue of Icelandic Volcanoes. IMO, UI and CPD-NCIP. Retrieved from Icelandic Volcanoes: http://icelandicvolcanos.is/?volcano=HEK
Smithsonian Institution Natural History Museum Global Volcanism Program (GVP): https://volcano.si.edu
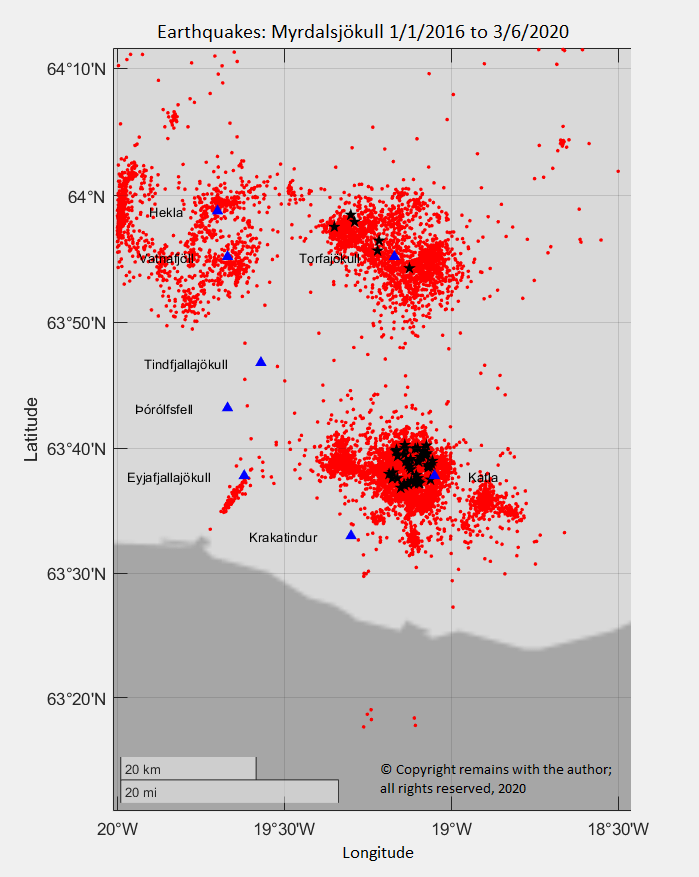
Continuing our theme of seismicity in Iceland, we have now reached the Mýrdalsjökull Region and are heading towards the Fire Districts in the Eastern Volcanic Zone.
We took a slight detour to set up a Glossary to explain some of the terms used here to help out. You can find it on the Menu bar.
Mýrdalsjökull lies at the southern end of the Eastern Volcanic Zone, near its junction with the South Iceland Seismic Zone. The South Iceland Seismic Zone is a transform fault system that links the West and East Volcanic Zones. The Eastern Volcanic Zone accommodates 40 to 100% of the spreading between the North American and the Eurasian Plates; the Western Volcanic Zone takes up the remainder. Active rifting on the Eastern Volcanic Zone terminates at Torfajökull volcano at the rift’s southern end. Katla, Eyjafjallajökull and more southerly volcanoes are on the Eurasian Plate.
Fig 1: Katla 1918 eruption. Image by RicHard-59 Public Domain
We updated our earthquake dataset so we are now looking at the period from 1 January 2016 to 31 May 2020. Apart from the continued swarm on the Reykjanes Peninsula, there has not been any unusual activity (to the untrained eye, at least). We used IMO’s latest earthquake map for Mýrdalsjökull as an indicator for the coordinates to extract the data for the region. This picked up five seismically active volcanic systems (Eyjafjallajökull, Hekla, Katla, Torfajökull and Vatnafjöll) and three inactive areas (Krakatindur, Þórólfsfell and Tindfjallajökull).
Let’s start by taking a closer look at Katla; the other volcanic centres will be covered in later posts.
The Katla Volcanic System
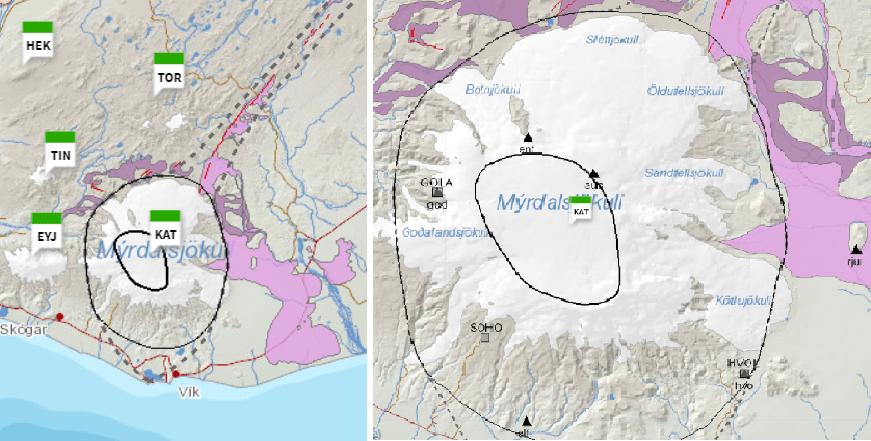
Katla is one of Iceland’s most active volcanoes. The volcanic system is 80 km long, made up of a 30 km wide central volcano and fissure systems. The central volcano has a 10km by 14km wide, 600m to 750m deep caldera with a 5km wide magma reservoir at a depth of 1.5 km. The Katla fissure, Kötlugjá, is located in the caldera. At the north west of the system is the Hólmsá fissure and to the north east, the Eldgjá fissure. There are also inactive fissures to the south. The Mýrdalsjökull ice cap covers most of the central volcano.
Fig 3: Images of the Katla Volcanic System retrieved from the CatalogueofIcelandicVolcanoes (see Sources below) showing the caldera rim, the outline of the central volcano and the north east fissure system. EYJ, TIN, HEK and TOR are other volcanic centres which may be covered in later posts.
Katla’s lavas are basalt/picro basalt, rhyolite and dacite, with a few intermediate hybrids, andesite and basaltic andesite. The basaltic eruptions are the most voluminous , sourced from the mantle via a spreading rift. She has also had many dacite eruptions. Lavas from the Eldgjá fissure are basaltic.
Eruptive History
Volcanism at Mýrdalsjökull began over 800,000 years ago and at Katla, 200,000 years ago. Studies of tephra have identified 200 basaltic and 14 silicic eruptions in the last 8,500 years; unfortunately, no more is known about what happened before the end of the last ice age.
Katla’s largest known eruption was a rhyolitic VEI 6 in 10600 BC which produced more than 10 km3 of rhyolite in pyroclastic flows and airborne tephra that reached 1,300 km from the volcano. The Sólheimar ignimbrite formed from the pyroclastic flows; and the tephra is referred to as the Skógar tephra (Iceland) or Vedde Ash (Norway, after the place where it was discovered).
GVP notes 132 Holocene eruptions for Katla, which range from VEI 3 to VEI 5. All Holocene eruptions occurred in the caldera, except for the 934 AD to 940 AD eruption of the Eldgjá fissure to the north east and the Hólmsá Fires in 6600 BC. Her recent eruptive style tends to be explosive basaltic eruptions from the caldera with tephra volumes up to 2km3, accompanied by jökulhlaups (glacial outburst floods). Water from melting ice cap contributes to the explosivity of the eruptions.
The last eruption to break the ice-cap was a VEI 4 in 1918 which produced an ash column up to 14 km in height, 0.7 km3 of airborne tephra, 1 km3 of debris from jökulhlaups and a small volcanic fissure; no lava emission was reported. The 1625 and 1755 eruptions, both VEI 5s, produced more tephra which reached further than 1,000 km from the central volcano.
The average time between eruptions has been cited as between 40 and 80 years on average. On that basis, Katla is expected to be gearing up for another eruption in the near future.
A period of unrest started in 1999 with a jökulhlaup, seismic tremors, geothermal activity and cauldron formation. There have been more recent subglacial eruptions: a jökulhlaup occurred in 2011, accompanied by a harmonic tremor and the formation of several ice-cauldrons, was thought to be indicative of a sub-glacial eruption; and the most recent jökulhlaup was in 2017, it is not clear if this was accompanied by a harmonic tremor.
Recent Seismicity
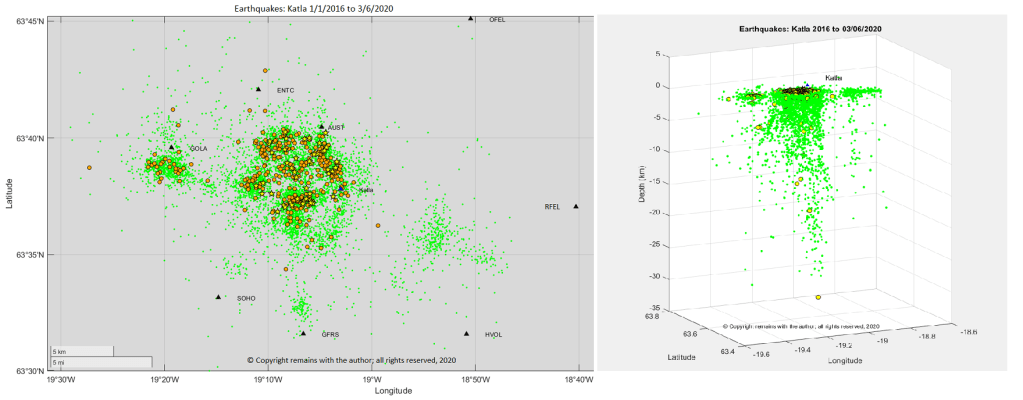
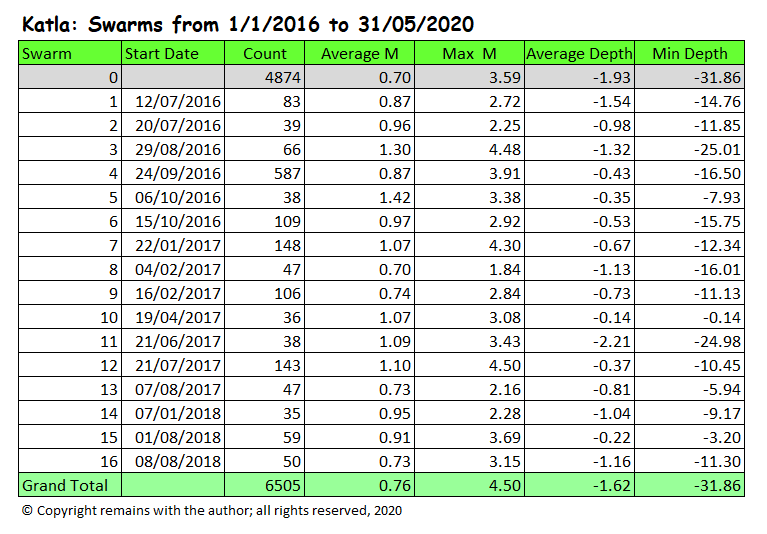
We extracted the earthquakes for Katla from the above data set using the coordinates 63.785°N, 19.4987°W to 63.4547°N,18.6608°W. This produced 6,505 earthquakes for the period 1 January 2016 to 31 May 2020.
Our plots show most activity in the caldera, some at the Goðabunga cryptodome and a low level of activity to the south and east of the caldera. Activity in the caldera is fed from a depth of 32km.
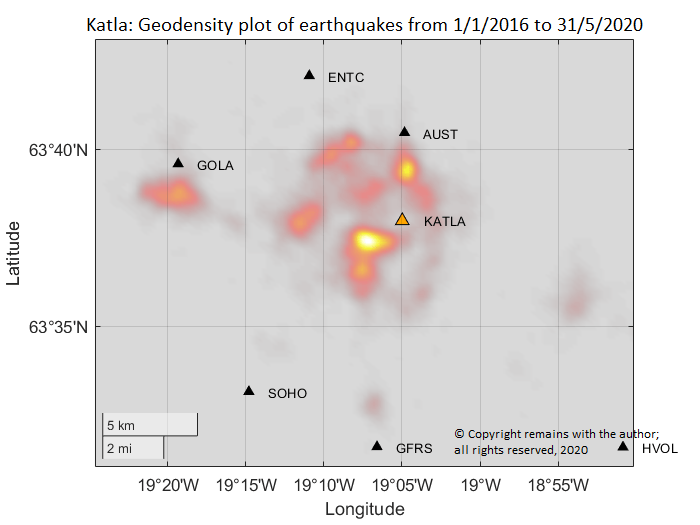
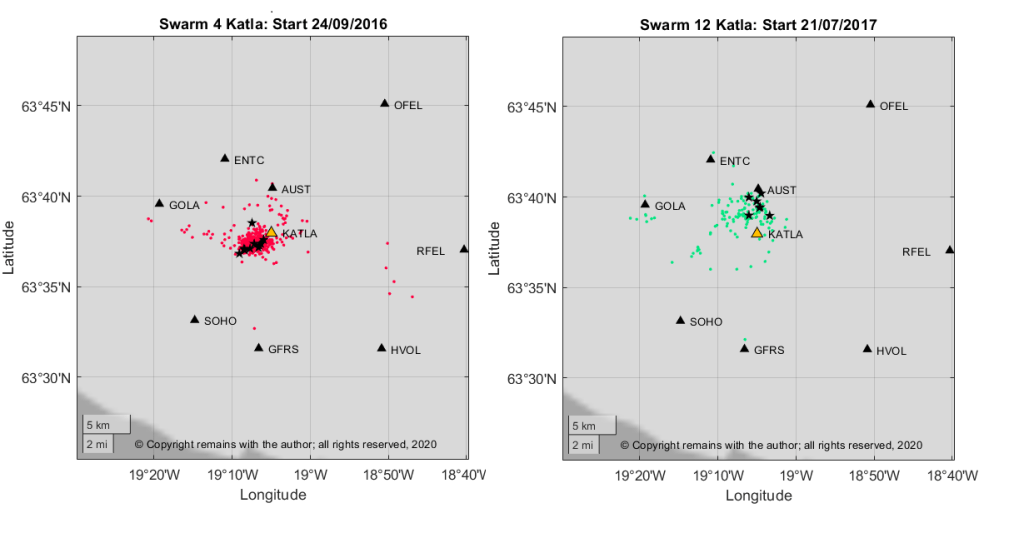
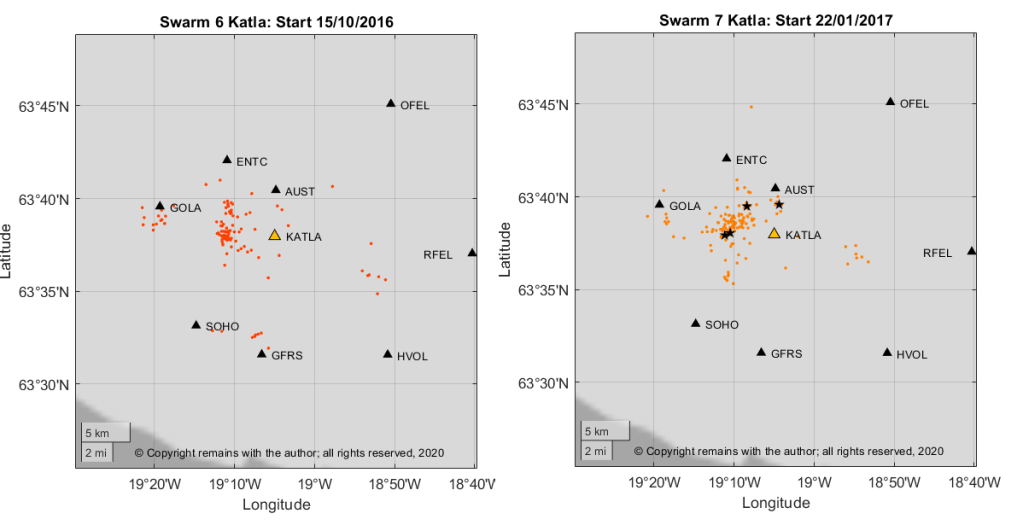
So what is causing the hot spots? We looked for earthquake swarms to see whether they are the cause of the hot spots in the geodensity plot. We used the criterion of 30 or more earthquakes in one day or in two consecutive days, which is a higher level of activity than Mýrdalsjökull’s “normal” activity. This showed 16 swarms (ref Appendix), of which five had more than 100 earthquakes; four of the five swarms were clustered (Swarms 4, 6, 7 and 12, shown below) and one was more spread out. Note: our analysis of swarms is not intended to pick up any small magma intrusions that have fewer than 30 earthquakes attached to them.
We see that Swarm 4 and Swarm 12 contributed to the hotter spots in the geodensity plots; the remaining hot spots seem to be caused by an accumulation of activity over four plus years in the data set. Without a clear map of the fissures within the caldera (Googling around did not find one), we cannot tell if the swarms coincide with known fissures. However, swarm 12 coincides with the 2017 jökulhlaup. Most of the swarms in the set appear to be part of the run up to a potential subglacial eruption. It is interesting to note that there do not appear to be any larger swarms after July 2017.
Earthquake swarms are precursors to eruptive activity. Unfortunately, as the last eruption to break through the ice-cap preceded any modern volcano monitoring, there is less certainty over what would precede another subaerial eruption, notably in respect of the intensity of swarms, magnitude of the earthquakes, jökulhlaups, and the time-frames.
It has been a while since Katla produced a large eruption. Let’s hope she sleeps for a bit longer; the world has enough to contend with at the moment.
Smithsonian Institution Natural History Museum Global Volcanism Program (GVP): https://volcano.si.edu/
“Iceland”, Thor Thordarson & Armann Hoskuldsson, Classic Geology in Europe 3, Terra Publishing, Third Impression, 2009
“Katla”, Guðrún Larsen and Magnús T. Guðmundsson (2016 March 7). In: Oladottir, B., Larsen, G. & Guðmundsson, M.T., Catalogue of Icelandic Volcanoes. IMO, UI and CPD-NCIP. Retrieved from Icelandic Volcanoes: http://icelandicvolcanos.is/?volcano=KAT
Fig 3: Map: After Jóhanneson and Saemundsson (1998a), Björnsson et al (2000) and Larsen (2000), Base data, Iceland Geo Survey, IMO, NLSI | Base map: IMO. In: Oladottir, B., Larsen, G. & Guðmundsson, M.T., Catalogue of Icelandic Volcanoes. IMO, UI and CPD-NCIP. Retrieved from Icelandic Volcanoes: http://icelandicvolcanos.is/?volcano=KAT
“Katla and Eyjafjallajökull Volcanoes”, Erik Sturkell, Páll Einarsson, Freysteinn Sigmundsson, Andy Hooper, Benedikt G. Ófeigsson, Halldór Geirsson and Halldór Olafsson, Developments in Quaternary Sciences, Volume 13, ISSN 1571-0866


