Good Morning!
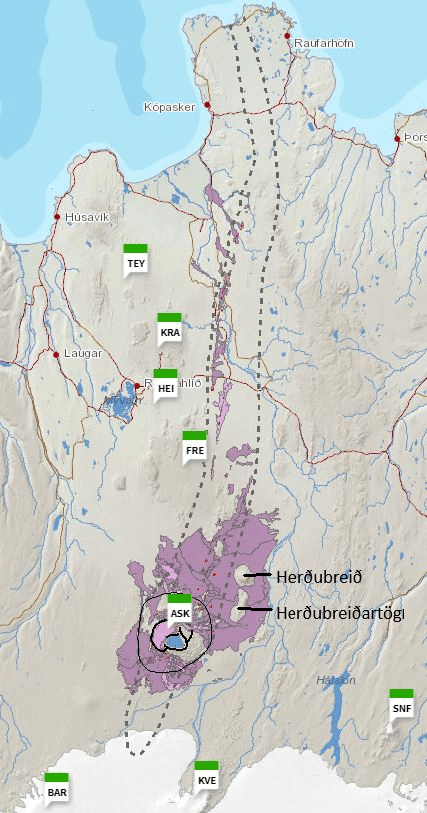
As the new volcano at Geldingadalur continues to grow, opening and closing new fissures, we have returned to our tour of Iceland. We have now reached the Northern Volcanic Zone, where the plate boundary heads northwards from Kverkfjöll to meet the Tjörnes Fracture Zone. Active volcanoes in the zone are Kverkfjöll, Askja, Fremrinámur, Heiðarsporðar, Krafla and Þeistareykir; Herðubreið, itself, is Pleistocene palagonite table-mountain.
We are starting with the currently most seismically active volcanoes, Askja and Herðubreið, located where the Eastern Volcanic Zone meets the Northern Volcanic Zone, north of the Vatnajökull ice-cap. The mantle plume, itself, is thought to be located to the north west of the Vatnajökull ice-cap.
Askja
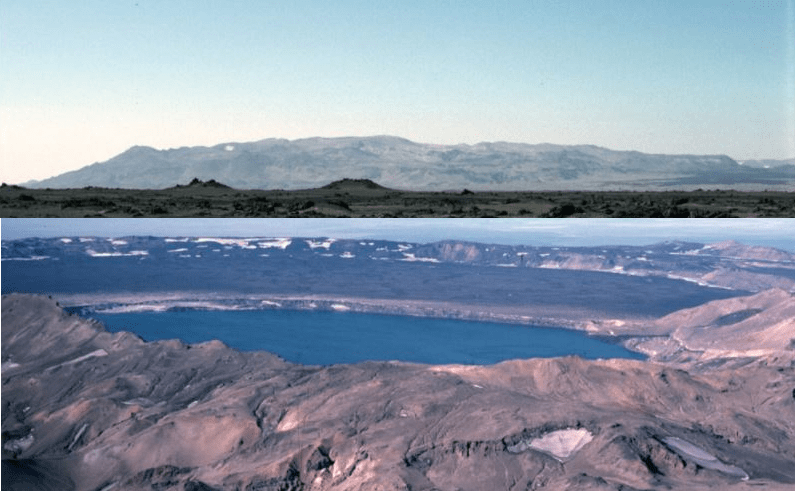
The Askja volcanic system comprises a 1,516 m high central volcano and 190 km long fissure system, the central volcano being the Dyngjufjöll massif. It has three nested calderas, the latest of which formed in a rhyolitic eruption in 1875. The central volcano, itself, is made up of Pleistocene glacio-volcanic tuffs, hyaloclastites, pillow basalts and intercalated sub aerial lava and capped by Holocene sub aerial lavas and pumice. The fissure system, itself, extends from beneath the Vatnajokull ice-cap to the north coast of Iceland and includes small shield volcanoes.
This volcanic system does not erupt frequently; GVP records 14 Holocene eruptions which range from VEI 0 to VEI 5, the VEI 5s occurred in c. 8910 BC and 1875. Askja’s lava types are tholeiitic basalt / picro-basalt and rhyolite. Her main eruption types are effusive basalt with occasion explosive basalt or rhyolite. The 1875 eruption created a 4.5-km-wide caldera which is now filled by Öskjuvatn lake. The most recent eruption in 1961 was a VEI 2 effusive basalt one.
The Askja Fires, 1874 to 1929
Askja was little known before the Askja Fires. The area is sparsely inhabited, sited in lava fields and ash deserts. The Fires occurred during a volcano-tectonic episode between 1874 to 1929.
A steam column rising from the central volcano in February 1874 was the first observed sign that the volcano was active. Northern Iceland was rocked by many large earthquakes in December 1874. Steam and ash were seen in early January 1875 and light ashfall was noted south of Öxarfjörður. By 15 February 1875, 10m subsidence had occurred in the main caldera along with the formation of a crater erupting mud. A basalt lava flow at Holuhraun to the south of Askja occurred around this time.
On 18 February 1875, a fissure eruption started on the Sveinagjá fissure north of the volcano; this generated 0.2 to 0.3km3 of basaltic lava over the course of several months.
On 29 March 1975, the Plinian eruption at the central volcano started in earnest. The initial output was a wet and sticky tephra. Shortly after 05:30, pumice was erupted, reaching as far as Scandinavia; this phase lasted until the following day. The Víti crater was formed later in a short hydro-magmatic episode. The caldera, itself, formed over a period of 40 to 50 years, is now filled by Öskjuvatn lake. As the volume of the new caldera is greater than the calculated erupted volume of lava and ash, it is thought that the excess lava is stored in the fissure system.
In 1929 to 1930, five eruptions occurred on ring faults around the Öskjuvatn caldera, with a 6 km long fissure eruption occurring on the southern side of the volcano that created the Þorvaldsraun lava.
The 1875 eruption is not the first time Askja has erupted rhyolite. Two other instances have been occurred: the c.10ka Skolli eruption and one around 2.1ka; these deposited thick layers of tephra and ash from the latter reached as far afield as Scotland and Sweden.
Holuhraun, which should be familiar to those interested in volcanology, is the area where a fissure eruption occurred in 2014. This time the central volcano responsible was Barðarbunga. At the time there was some concern at the time that the activity in Holuhruan would extend to Askja, triggering a rhyolitic eruption. Fortunately, that did not happen.
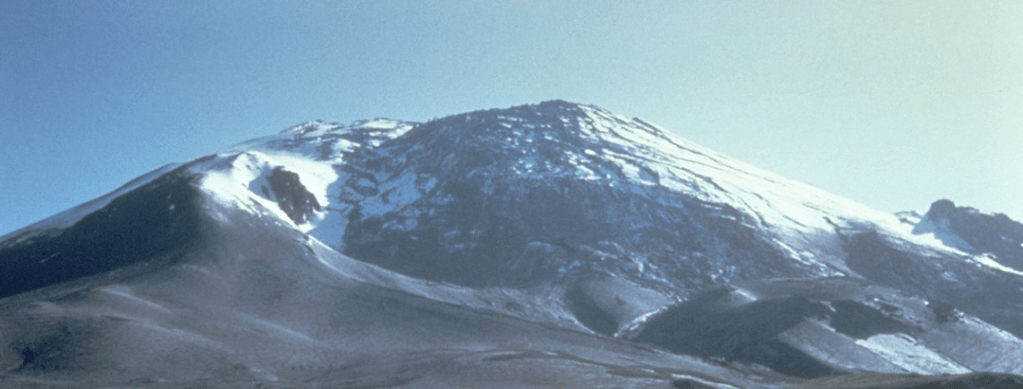
Herðubreið
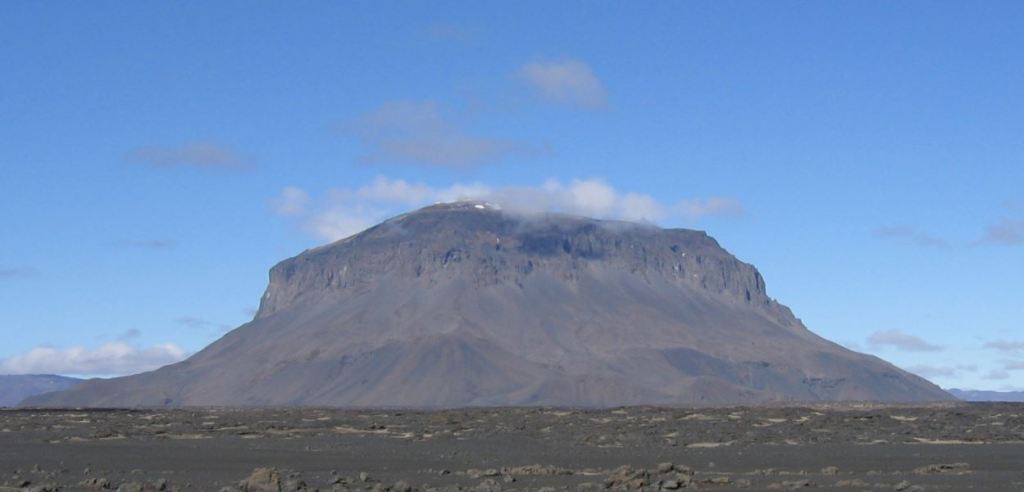
Herðubreið is a 1,682m high Pleistocene palagonite table-mountain (tuya) made up of pillow lavas, hyaloclastite, capped by a 300m thick lava shield. Herðubreiðartögl, a small ridge extending from the south of Herðubreið, may be part of the same system. Although Herðubreið is close to the Askja and Kverkfjöll volcanic systems, in the absence of any post glacial activity it not known if it belongs to either system. We are including the volcano here as it is difficult to allocate the seismic activity in the area to each volcano without more local knowledge.
Herðubreið has been studied as an indicator of climate change during the last glacial periods. Werner et al, (1996) proposed that Herðubreið developed in stages from initial sub-aerial, sub-aqueous, subglacial to sub-aerial. The first sub-aerial activity occurred during an interglacial, creating an olivine tholeiitic shield volcano in the vicinity of Herðubreiðartögl. A lull in volcanic activity coincided with the onset of the last ice-age. Activity resumed with the deposition of olivine tholeiites, followed by hyaloclastites in a lake environment until the volcano breached the lake surface to produce subaerial lavas. The tuya, itself, was formed during the last glacial maximum when the volcano erupted pillow lavas under hyaloclastite deposits in the ice-cap; these were later topped by subaerial lavas when the volcano broke through the ice-sheet. At the end of the last ice-age, activity at Herðubreið had ceased, however, Herðubreiðartögl produced some later olivine tholeittic lava flows and ash deposits.
Recent Seismicity
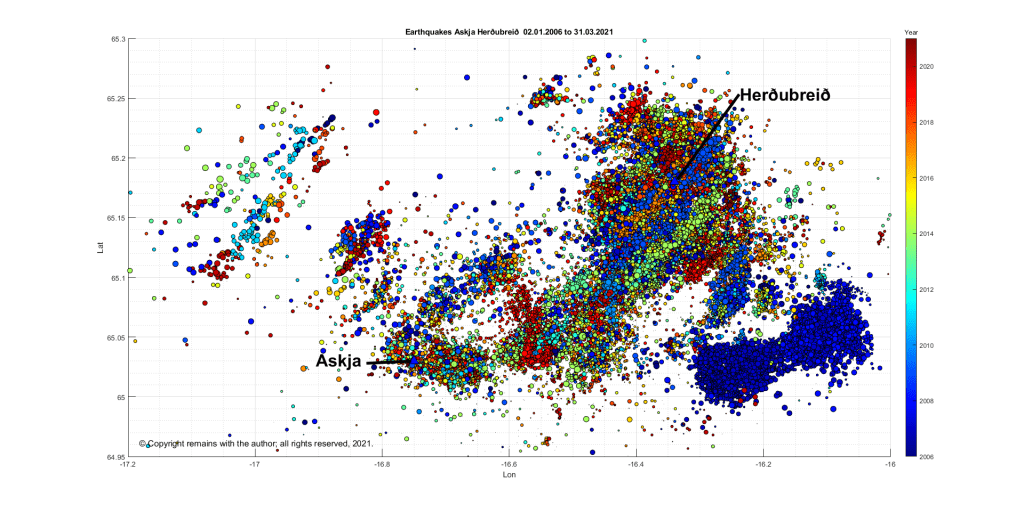
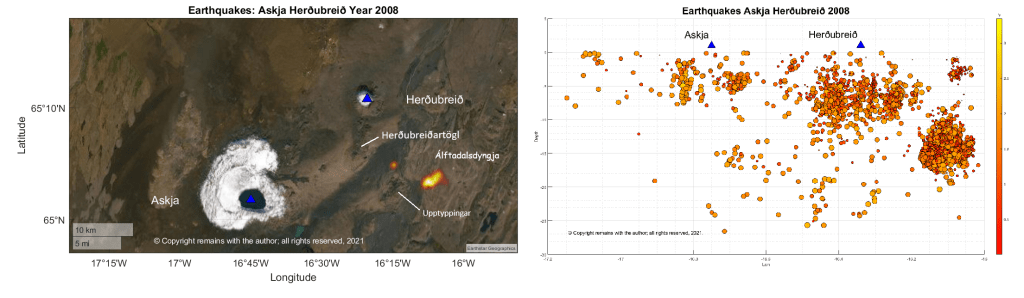
We plotted the area between 64.95°N,17.2°W and 65.3°N,16.0°W, a total of 45,899 earthquakes. As you can see from Fig 4, the area is very active (although perhaps we should not have used green dots in retrospect– Askja looks very unwell as a result).
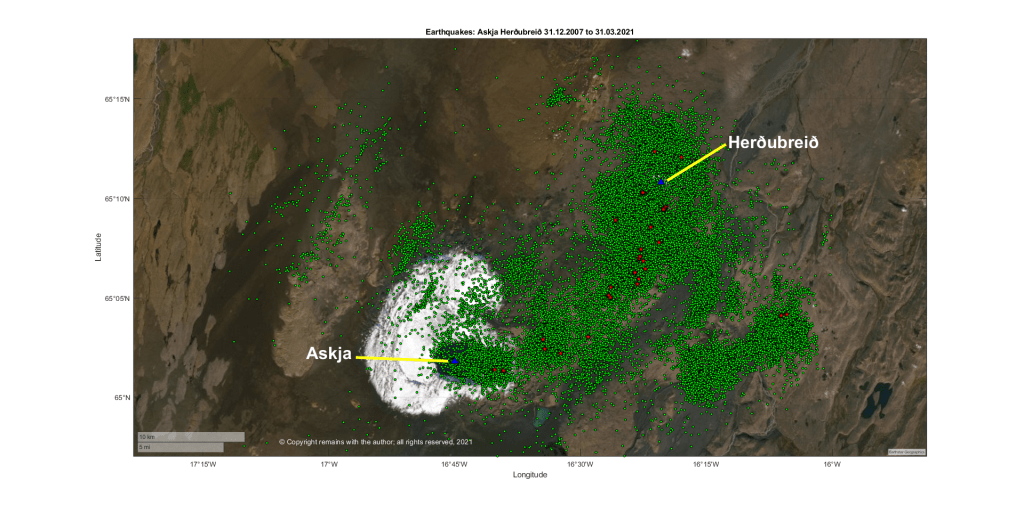
The latitude v longitude scatter plot shows that activity follows a NE-SW pattern around Herðubreið, with a swarm to the south east; activity around Askja is focussed on the SE section of the caldera with some further east. The plots are data-heavy so we have broken these down by year.
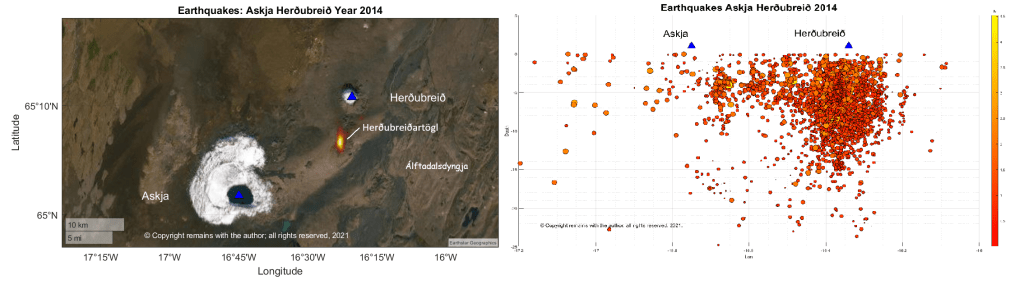
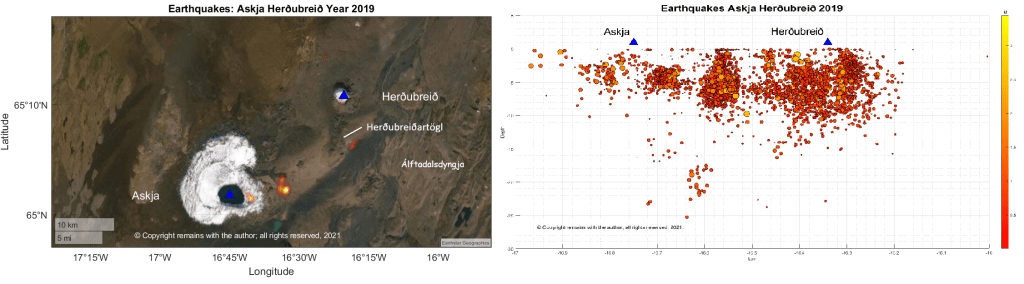
The years with most seismic activity in the sequence are: 2007, 2008, 2014 and 2019.
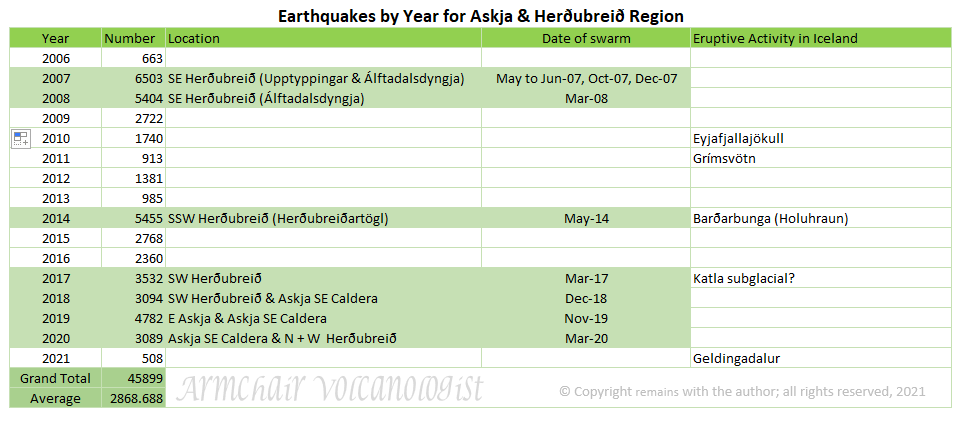
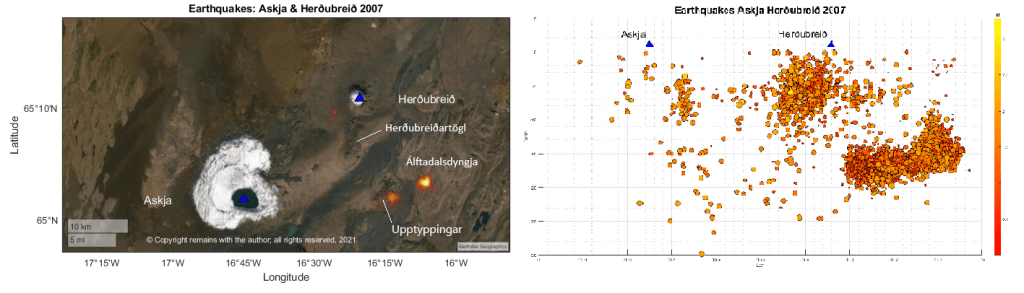
In 2007 and 2008, there was a swarm that started in Upptyppingar and progressed to Álftadalsdyngja; this is thought to be due to magma movement. 2014 is the same year as the Barðarbunga eruption at Holuhraun; perhaps some of the seismicity is the result of the crust accommodating magma movement in the region, although the swarm here preceded the swarms at Barðarbunga. In 2019, there was a swarm to the east of the Askja caldera.
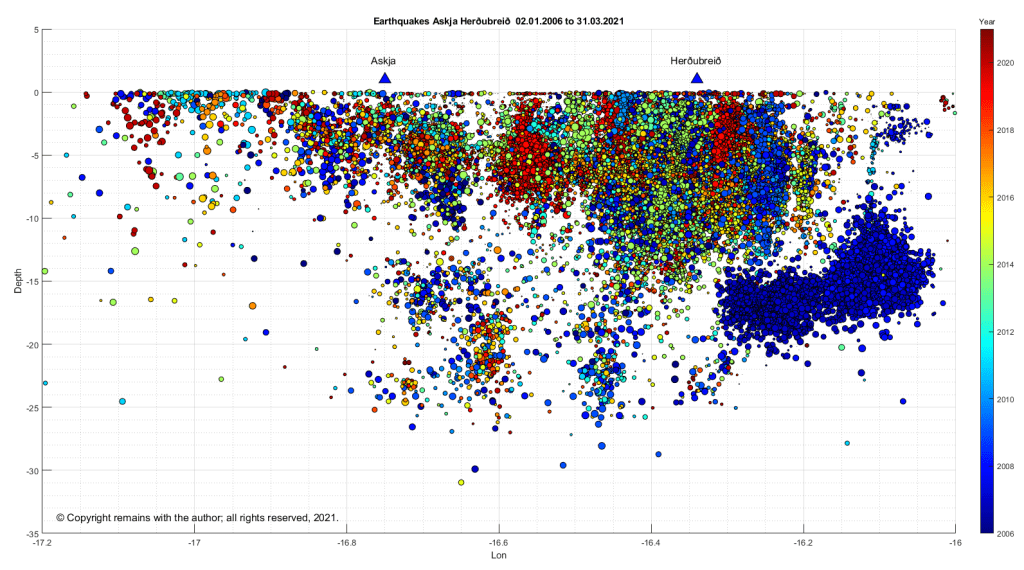
The earthquake density plots and depth v longitude plots for these years are set out in Figs 8 to 11 below.
Let’s see what the scientists have said. Greenfield et al (2016) have noted from seismic studies that there is considerable melt storage and transportation (movement) under the lower crust in the region (which may or may not be typical of Icelandic volcanoes – more study would be needed); there is likely to be a magma intrusive complex in the shallow crust round Askja; and, the activity round Herðubreið is caused by fracturing in the region.
The region is well monitored due to the risk of another rhyolitic eruption from Askja; this time around one may cause some disruption to aviation and communication systems, by how much would depend on the size and length of the eruption. In the light of the reawakening of Fagradalsfjall on the Reykjanes Peninsula, perhaps the Pleistocene volcanoes should be added to the watch list, although the monitoring of Holocene volcanoes is likely to pick up unusual activity.
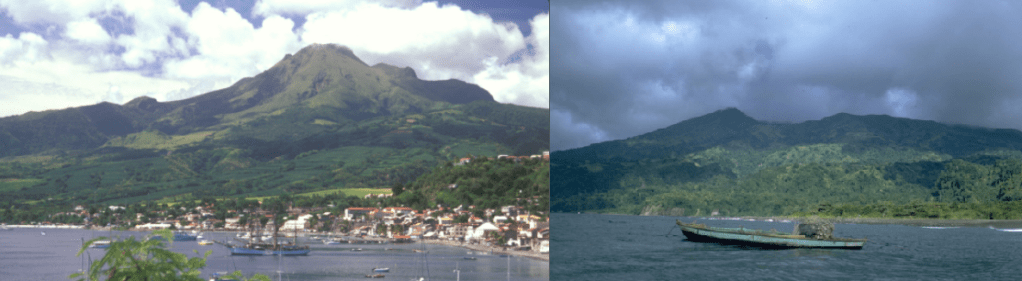
La Soufrière St. Vincent
We have not forgotten La Soufrière St. Vincent; our thoughts are still with the islanders. We will do a fuller update soon. In the meantime, the volcano is still erupting and a new lava dome is forming in the crater. The island has lost up to 50% of its GDP. More aid is now reaching the island. For updates, we use News 784 (link below).
Barbados continues to clear up the volcanic ash; this is putting strain on local water supplies. For updates, we use Nation News Barbados.
The Armchair Volcanologist
© Copyright remains with the author; all rights reserved, 2021.
Sources and Further Reading:
R. Werner, H. U. Schmincke, G. Sigvaldason ,“A new model for the evolution of table mountains: volcanological and petrological evidence from Herðubreið and Herðubreiðartögl volcanoes (Iceland)”, Geologische Rundschau 85, Article number: 390 (1996). https://link.springer.com/article/10.1007/BF02422244
T. Greenfield, R. S. White, S. Roecker, “The magmatic plumbing system of the Askja central volcano, Iceland, as imaged by seismic tomography”, Journal of Geophysical Reseach: Solid Earth, AGU Publications https://agupubs.onlinelibrary.wiley.com/doi/full/10.1002/2016JB013163
Thor Thordarson (Faculty of Earth Sciences, University of Iceland) and Al Margaret Hartley (University of Manchester (November 2019). Askja. In: Oladottir, B., Larsen, G. & Guðmundsson, M. T. Catalogue of Icelandic Volcanoes. IMO, UI and CPD-NCIP. Retrieved from http://icelandicvolcanoes.is/?volcano=ASK
“Classic Geology in Europe 3: Iceland”, Thor Thordarson & Armann Hoskuldsson, Terra Publishing, Third Edition, 2009.
The Smithsonian Institution’s Global Volcanism Program (GVP): https://volcano.si.edu/
Earthquake raw data: IMO: https://en.vedur.is/
For updates on La Soufriere St Vincent:
News 784: https://news784.com/
Nation News Barbados: https://www.nationnews.com/
For updates on the new volcano at Geldingadalur:
Icelandic Met Office: https://en.vedur.is/ (English site)
Icelandic Met Office: https:// vedur.is/ (Icelandic site)
Reykjavik Grapevine: https://grapevine.is/
Department of Civil Protection and Emergency Management | Almannavarnir

