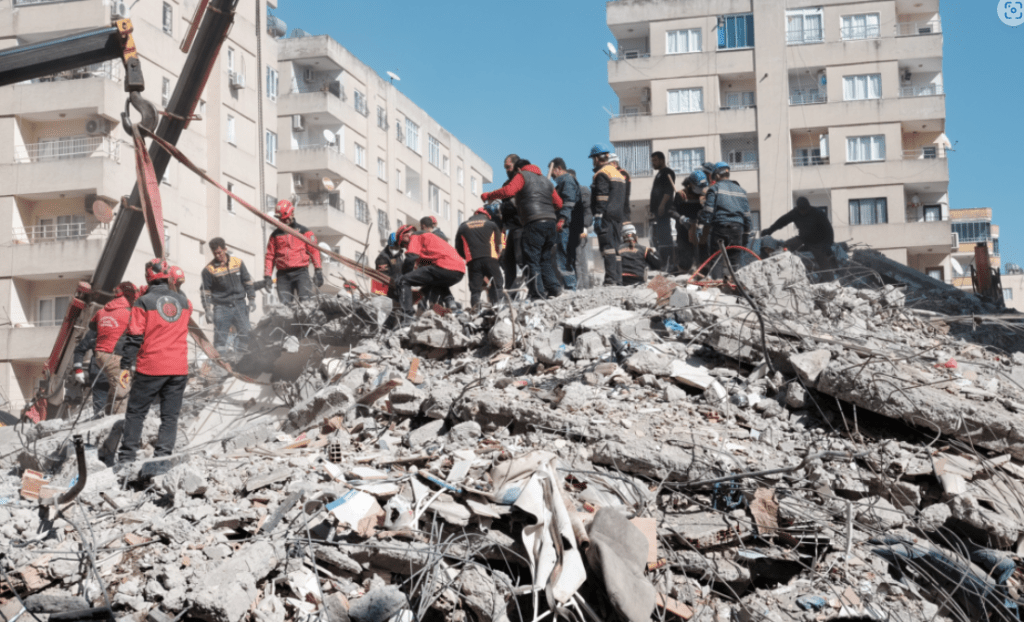
Fig 1: Rescue workers in in Osmaniye, Turkey. Cropped from image by Onur Erdoğan, Public Domain, Wiki Commons
It’s approximately one month on from 6th February 2023 when a 7.8 magnitude earthquake struck on the south western end of the East Anatolian Fault Zone at 01:18 UTC (04:18 local time) 32.4km west northwest of the town of Gaziantep. This, followed by large aftershocks, including a very shallow 7.5 magnitude earthquake to the north of the first quake, caused catastrophic damage in central and southern Turkey, and northern and western Syria. The 7.5 earthquake signalled the rupturing of a second fault zone, the Sürgü-Misis Fault. The final fatality number is not yet available but, at the time of writing, fatalities exceeded 50,000, with hundreds of thousands injured and millions displaced. Our thoughts are with the victims, including those facing a long road to recovery.
We have taken a look at the earthquakes surrounding the Anatolian Plate from the start of January 2023 to 1st March 2023.
Tectonic Settings
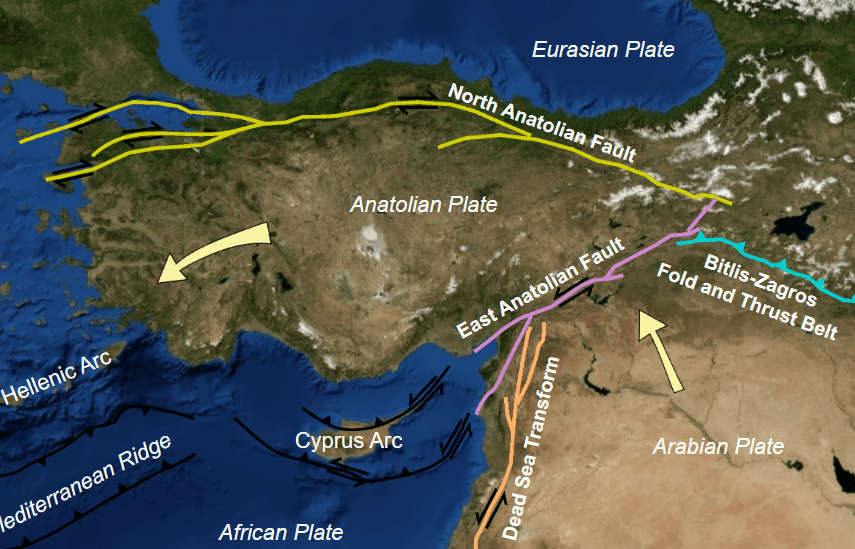
The Anatolian Plate lies between the Eurasian Plate, Arabian Plate and African Plate. The African Plate is moving at a rate of 2.15cm per year in a north easterly direction, the Eurasian Plate is moving south, relative to the African Plate, at a rate of 7-14mm per year, the Arabian Plate is moving northward at a rate of 15-20mm per year and the Anatolian Plate is moving south west at the rate of 21mm per year. The relative motions are accommodated by the North Anatolian Fault, East Anatolian Fault, Bitlis – Zagros Fold and Thrust Belt and Dead Sea Transform Fault System.
Fig 2: Image by Roxy – Own work, CC BY-SA 3.0, Wiki Commons
The East Anatolian Fault is a 500km long fault zone which marks the plate boundary between the Anatolian and Arabian Plates; the boundary is a transform one with left lateral strike slip seismic activity and a slip rate of 10mm per year. The Anatolian Plate is pushed westward by the Arabian Plate moving northwards towards the Eurasian Plate.
The East Anatolian Fault is a single fault between Karliova and Çelikhan. After Çelikhan the fault zone splits into north and south strand, both of which include multiple faults. The Sürgü-Misis Fault makes up the northern strand; it is a 380km long stretching between Çelikhan and Karataş; the eastern parts of the east-west section are made up of the Çardak and Sürgü faults; the sytem changes direction at the Göksun bend dividing into seven north east trending fault systems – the Karataş, Yumurtalık, Toprakkale, Savrun, Misis, Çokak and Düziçi-İskenderun faults. The Sürgü-Misis Fault system connects to the Cyprus Arc via the Misis-Kyrenia fault system. The southern strand of the East Anatolian Fault is less certain; the East Anatolian Fault may extend to the north of Cyprus; and, the NNE trending Türkoğlu-Amik section (the Karasu Fault Zone) may be a separate fault, linking the Dead Sea Transform to the East Anatolian Fault. The Karasu Rift has had Quaternary volcanic activity on northern part and sides of the rift between Kirikhan, Reyhanli and Fevzipaşa in an area 94km long and 12-25km wide.
The North Anatolian Fault, another strike slip fault, accommodates the relative motion between the Anatolian Plate and the Eurasian Plate. The North Anatolian Fault and the East Anatolian Fault meet the Bitlis – Zagros Fold and Thrust Belt, where the Arabian Plate subducts under the Eurasian Plate, at the Karliova Triple Junction.
Not very far to the west, the African Plate is subducting under the Anatolian Plate at the Cyrpus Arc. The Dead Sea Transform Fault System to the south marks the transform boundary between the Arabian and African Plates. The East Anatolian Fault meets the Dead Sea Transform Fault System at the Maras Triple Junction.
Earthquake Plots
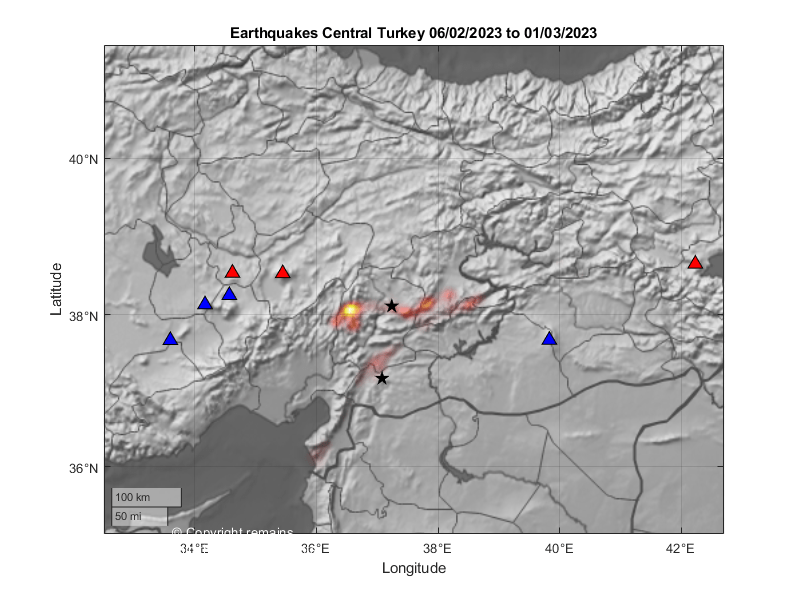
We initially plotted the earthquakes from 1 January 2023 to 25 February 2023 for the area 34.47361°N, 25.22222°E to 42.25833°N, 44.45056°E. We then looked at 35.3122°N, 32.50944°E to 41.21667°N, 42.70056°E, focussing on the East Anatolian Fault. The results are shown in the following videos and earthquake density plot.
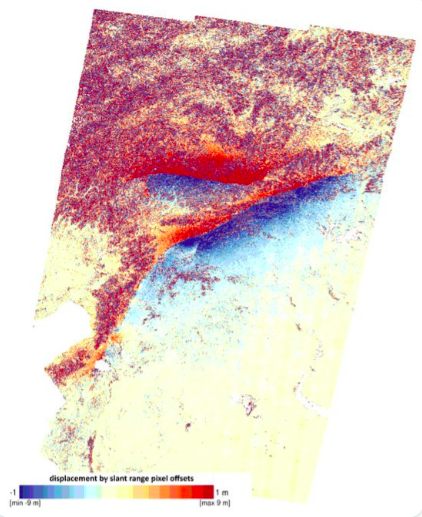
Fig 7: Surface rupture from the two earthquakes as shown by analysing before and after satellite images. The first rupture on the East Anatolian Fault was 190km long and the second on the Sürgü-Misis Fault was 38km long (Image credit: Copernicus/NERC/COMET)
Most of the faults within the East Anatolian Fault Zone seem to have moved in the period we looked at. However, the scale of our plots may be misleading. Our plots do show a tenuous link between the East Anatolian Fault and the Cyprus Arc. There was some activity on the Arc preceding the 7.8 earthquake. After shocks have migrated through the fault system towards the Arc. There is no obvious link with the Dead Sea Transform Fault in the time period selected but geologically-speaking that is a very short period.
“Paleoseismology of the western Sürgü–Misis fault system: East Anatolian Fault, Turkey”, Tamer Y. Duman, Hasan Elmacı, Selim Özalp, Akın Kürçer, Meryem Kara, Ersin Özdemir, Ayhan Yavuzoğlu & Çağıl Uygun Güldoğan, Mediterranean Geoscience Reviews volume 2, pages411–437 (2020) https://link.springer.com/article/10.1007/s42990-020-00041-6
Time to check out the current status of the volcanoes we have been following, especially as the situation has changed for some.
Askja
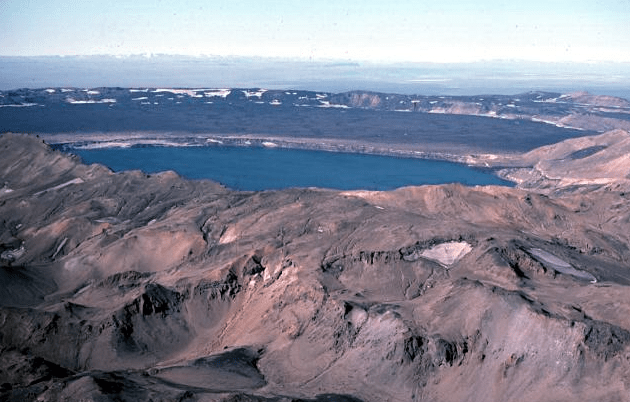
Fig 1: Image of Askja caldera by M Ryan, USGS, public domain.
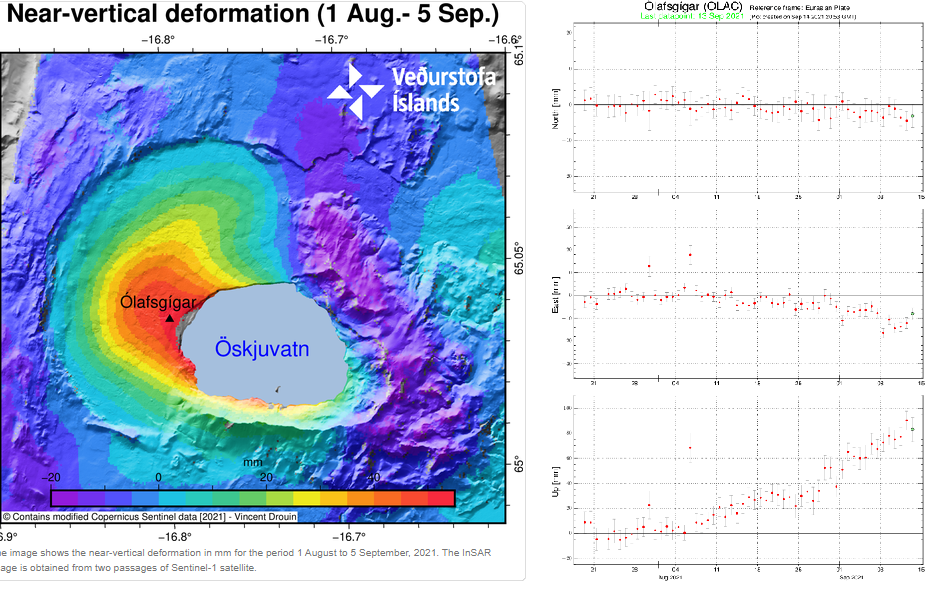
Inflation, thought to be caused by a magma intrusion at a depth of 2km-3 km, started in early August. GPS data and satellite images detected uplift of 5cm per month; the uplift centred on the western edge of the Öskjuvatn caldera.
The aviation code was raised to yellow on 9 September 2021, following near vertical uplift of 7cm.
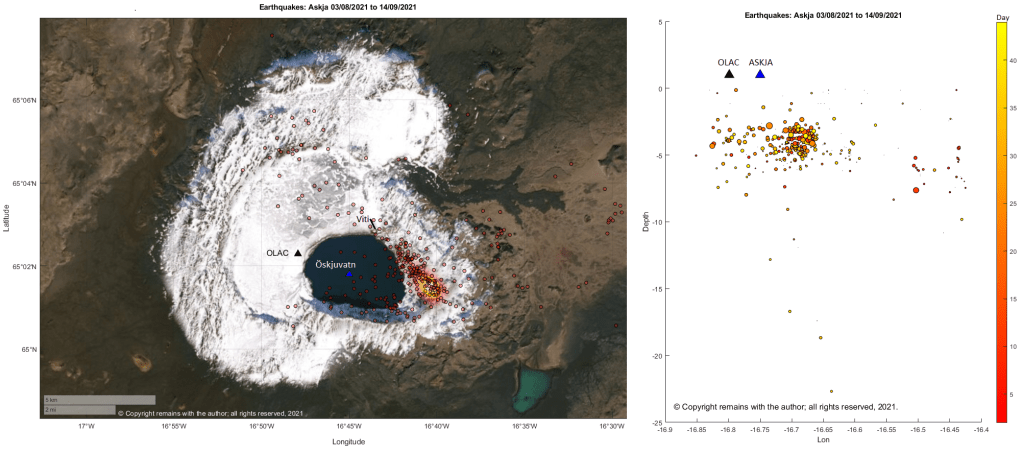
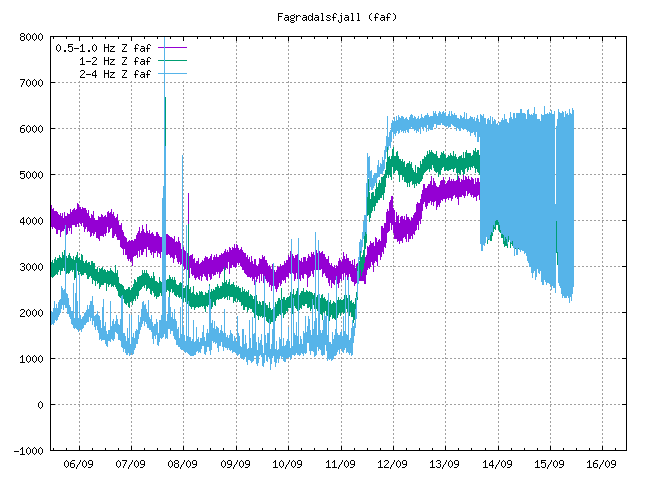
The epicentres of current earthquake swarm are mostly to the east of the Öskjuvatn caldera following a near linear route, starting at, or near, the area of maximum earthquake density for the period 1995 to 09.09.2021, and heading for the Viti explosion crater; seismic activity is on the opposite side from the area of maximum uplift.
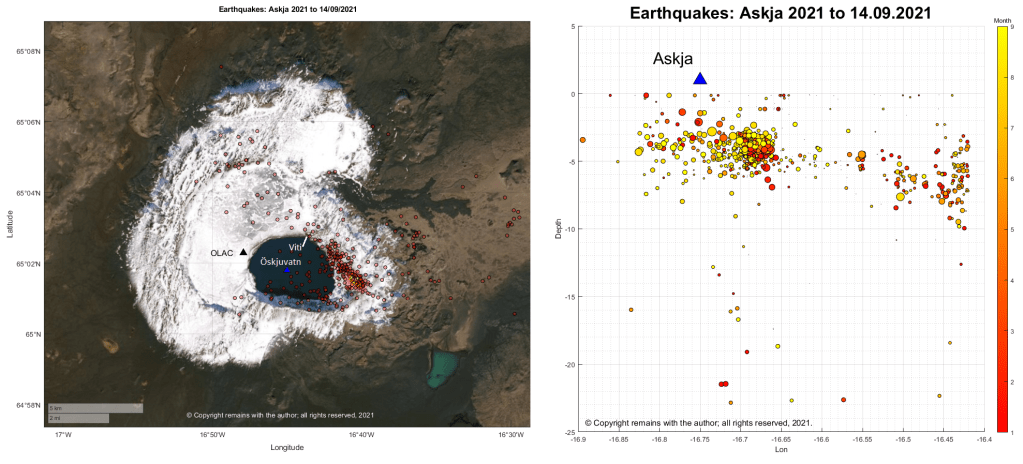
Seismicity for 2021 looks pretty similar; the current swarm follows the pattern of earlier seismicity.
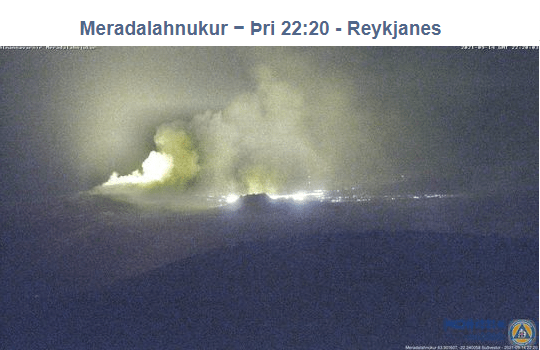
Fig 4a: Crater at Fagradalsfjall erupting on 14 September 2021.
The crater at fissure 5 has grown considerably since we last posted about it; it now dominates the surround hills. The eruption paused on 2nd September 2021, taking a well-earned break; steam and gas emissions continued. The eruption resumed a couple of days ago. The aviation code remains orange.
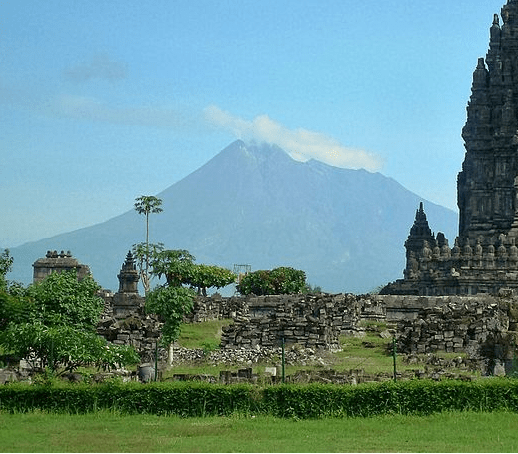
Fig 5: Merapi 2011 with Prambanan in the foreground, cropped from an image of Prambanan by Arabsalam, published under CC BY-SA 4.0. Source: Prambanan Java243. Prambanan is an 8th Century Hindu temple compound located approximately 17 kilometres (11 mi) northeast of the city of Yogyakarta and designated a UNECSO World Heritage Site.
Both lava domes situated below the south west caldera rim continue to grow, producing numerous pyroclastic flows and avalanches.
The alert level remains at thee and there is a 3km – 5km exclusion zone.
Grímsvötn
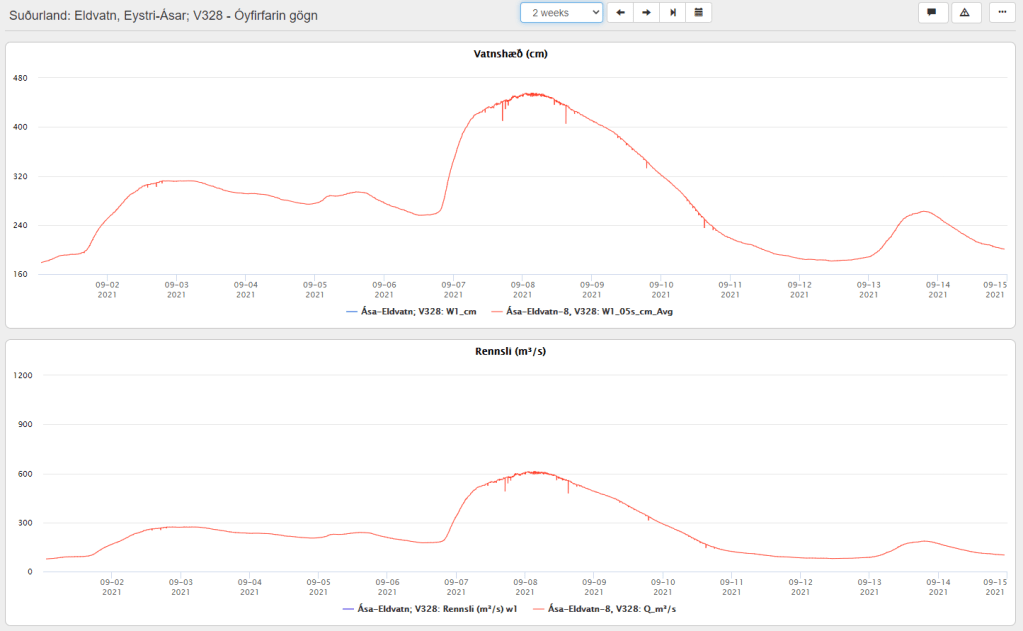
A jökulhlaup started on 1 September 2021 from the western Skaftlá caldera; the peak flow rate reached 520 m3/s on 2 September 2021. Warnings were issued of the hazard from H2S from water draining from the caldera lake. The ice-shelf had subsided 1m by 5 September 2021.
On 6 September 2021, the peak flow rate increased to 610 m3/s, thought to be due to a second release of water from the caldera lake – this time on the eastern side.
The aviation code remains at yellow.
Fig 6: Top image shows the water levels reached at Eldvatn and the lower one, flow rate. Source: IMO
La Soufrière St. Vincent
The last ash emissions were on 22 April 2021. Seismicity has since remained low. Gas and steam plumes have been observed rising from the crater.
The alert level remains at orange.
Mount Pelée
Volcano-tectonic earthquakes are still occurring in the edifice at depths between 0.2km to 1.2km. The area of discoloured, downgraded, burned and dead vegetation remains on the south west flanks.
At the end of July 2021 underwater gas emissions started between St Pierre and the Prêcheur. This will be investigated to ascertain how it links with the volcano.
The aviation code remains at yellow.
Mount Nyiragongo
The volcano is still active. A [gravitational] collapse in the crater caused and ash plume; ash reached Goma. Incandescence was seen on 26th July 2021 and a gas and ash plume emerged on 4th August 2021.
The recent eruption Mount Nyiragongo has taken us away from Iceland and the ongoing eruption at Geldingadalur, Fagradalsfjall, Iceland, to look at the East African Rift System. Unlike the current benign eruption in Iceland, there are 32 known fatalities from Mount Nyiragongo’s eruption, 3,629 homes and buildings destroyed, more than 20,000 displaced, many unaccounted for and several hundred thousand evacuated from parts of Goma to Sake. The current alert status for the volcano is orange. Our thoughts are with all those affected by the eruption.
As we refer to different lavas in more detail than originally anticipated, we will explain them in future posts; please bear with us for the moment.
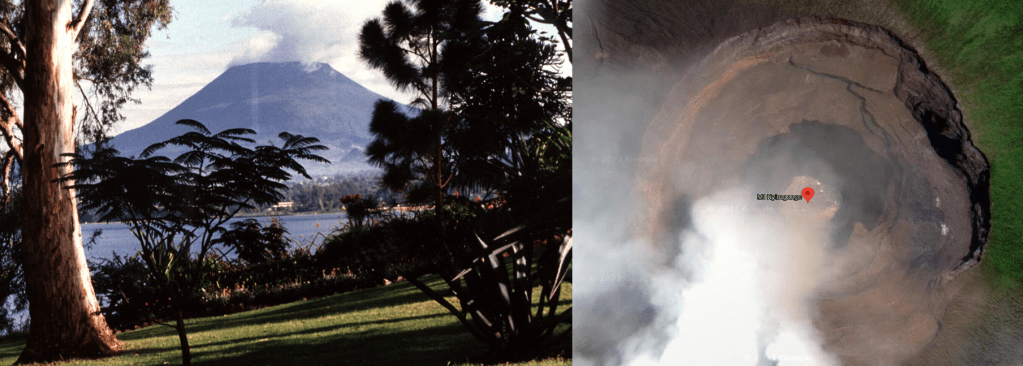
Fig 1: Photo of Mount Nyiragongo by B. Martinelli, 1994 (courtesy of Jack Lockwood, U.S. Geological Survey) (left) and screenshot of the Nyiragongo crater with lava lake pre 2021 eruption from Google Maps (right).
It has been reported that the volcano had not been fully monitored for several months due to lack of funding for the Goma Volcano Observatory. Monitoring improved in May 2021 when an American partner helped to get the internet connection to seismometers restored. This, and the ensuing eruption, must have been worrying times for the Observatory.
2021 Eruption
Run Up to the 2021 Eruption
Reports on GVP for Mount Nyiragongo note that strong thermal anomalies and gas emissions were observed in the period June 2018 to May 2020, along with incandescence, seismicity and gas / steam plumes.
In the period from June 2020 to November 2020, daily thermal activity was observed, indicating the presence of a large lava lake; levels of SO2 emissions fluctuated during the period.
Eruption May 2021
Mount Nyiragongo erupted on 22 May 2021 at around 18:15 local time, sending torrents of low viscosity lava down the side of the volcano, reaching as far as the outskirts of Goma. The following account of the eruption is summarised from bulletins on GVP.
The crater lava lake drained followed by the opening of at least two fissures on the south flank of the volcano. The first fissure’s lava originated near the Shaheru crater flowing eastwards over a main road; lava flows from the second fissure reached villages north of Goma destroying around 3,629 homes and buildings, displacing 20,000 to 25,000 people, and cutting off electricity and water supplies to parts of the city. Ash plumes, caused by collapse in the summit crater, rose initially to 45,000 feet then 20,000 to 30,000 feet.
Eye witnesses report that no felt earthquake preceded this eruption, which is consistent with instrument monitoring. Between 22 and 24 May 2021 earthquakes occurred between the summit and Lake Kivu. Tremors were felt in Goma every 30 minutes from midday 23 May 2021. Cracks appeared in different parts of the city, stretching several hundred metres southwards to the lake, some emitting gases and flames. A 5.1 M earthquake occurred beneath Lake Kivu at 10:37 on 24 May 2021. Seismicity remained intense on 25 May with more than 130 earthquakes between 2M and 5M recorded in a 24-hour period. News reports indicated hundreds of damaged buildings in neighbouring Rwanda. Rwanda suffered 13 earthquakes in excess of 4.0 between 23 May to 27 May 2021. Seismicity has since decreased, although there is some evidence suggesting magma movement beneath the city of Goma.
The volcano is monitored by the Observatoire Volcanologique de Goma (OVG). OVG have given four possible scenarios as to how the eruption could progress:
A new fissure eruption on the southern flanks of the volcano;
A new eruption with fissures in or extending to the cities.
A new eruption with fissures extending to Lake Kivu.
Activity subsides.
Lake Kivu contains dissolved gases, including CO2. Heat or other disturbance from fissure activity beneath the lake may release dissolved CO2 in a cloud that could kill at lower elevations in its path. Although the 2002 eruption did not cause a large gas release from the lake, you can never say never.
Background
Tectonic Setting
Nyiragongo is 3,470 m high stratovolcano with a 1.2 km wide summit crater which contained a small active cone and lava lake, located in the Virunga Mountains in the Kivu Rift on the western arm of the East African Rift. The volcano’s edifice is built of lava flows and pyroclastics. Goma, with a population of 670,000 is located on the shores of Lake Kivu 12 km south of the volcano.
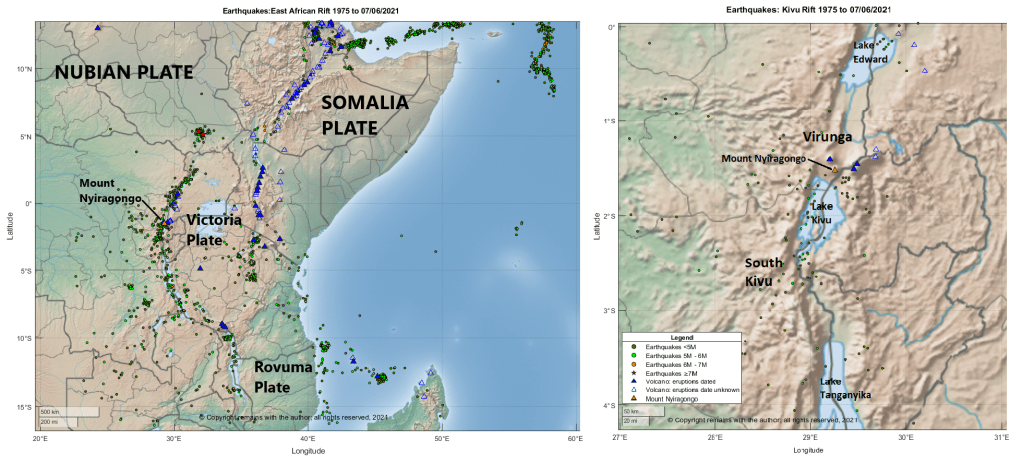
Volcanic and tectonic activity in the area is complex, influenced by to the opening of the East African Rift System in the midst of pre-existing areas of crustal weakness. The East African Rift System is a 3,000 km long continental rift extending from the Afar Triple Junction to western Mozambique. The Nubian Plate is moving away from the Arabian and Somalia Plates. Mantle plumes are thought to be the cause of doming and rifting. Rifting occurs at rates of 1 to 4mm a year, increasing north to south on the western arm of the rift and increasing south to north on the eastern arm. The slower rate of rifting in the continental lithosphere results in different volcanism than oceanic crust settings.
The Kivu Rift was created c. 5 Ma; it extends between Lake Tanganyika to Lake Albert in the central part of the western branch of the East African Rift System in an area of uplift called the Kivu Dome. There are two areas of volcanism associated with the rift, the South Kivu Volcanic Province and the Virunga Volcanic Province. Lake Kivu, itself, is a complex series of basins, the result of a rift depression whose waters drained northward until blocked by volcanic activity in the Virunga Volcanic Province c. 11,000 years ago, after which they flowed southwards. We will focus on the Virunga volcanism.
The Virunga Mountains comprise eight volcanoes on the border between the Democratic Republic of the Congo, Rwanda and Uganda. The volcanoes are: Mount Karisimbi, a 4,507m a complex basanitic-to-trachytic volcano , last known eruption 8050 BC; Mount Mikeno, a dormant 4,437m volcano; Mount Muhabura, 4,127m basanitic-to-trachyandesitic stratovolcano; Mount Bisoke, a 3,711m trachyandesitic stratovolcano, last eruption1957 ; Mount Sabyinyo, an extinct 3,674m volcano and the oldest in the range; Mount Gahinga, an extinct 3,474m volcano; Mount Nyiragongo, a 3,470m foidite stratovolcano, last eruption 2021 ; and Mount Nyamuragira, a 3,058m high-potassium basaltic shield volcano, last eruption 2021.
In the Virunga Volcanic Province, volcanic activity occurred in two stages: 1) pre-rift doming which produced alkali basalts in west Virunga c. 13 Ma to 9 Ma, after which volcanic activity ceased; and, 2) the opening of a trans extensional fault zone with ENE-WSW displacement c. 2.6 Ma.
Mount Nyiragongo’s Lavas
The Virunga Volcanic Province lavas are leucite basanite (e.g., Nyamuragira) from primitive mantle at depths of between 80km to 150km, or a more enriched leucite-melilite nephelinite (e.g., Nyiragongo) from mantle source at the same depth which has been enriched by contact with a carbonatite source. The source for the carbonatite is thought to be either from contact between rising magma and carbonate containing fluids or melt addition before or during magma generation 500 ma to 800 ma.
Nyiragongo’s melilite leucite nephelinite lavas are classed as foidite with minor basalt / picro basalt. It is the low silica foidites that make her lava’s so fluid, despite the volcano being a stratovolcano. These lavas can reach a speed of 60 – 100 km per hour and, unlike most lavas, cannot be outrun. The edifice, itself, is built of lava flows interspersed with pyroclastics.
Mount Nyiragongo’s Historic Eruptions
Recording of Nyiragongo’s eruptions started in 1884. GVP records 20 Holocene eruptions, all of which are VEI 1, except for the VEI 2 January 2002 eruption. The most recent eruptions were in 1977, 1994, 2002 and now 2021.
In 1991, Mount Nyiragongo was designated a Decade Volcano, worthy of study.
1977 Eruption
On January 10, 1977, a system of N-S fissures opened near the Baruta and Shaheru craters and the lava lake drained. Initial lava flows reached speeds of 100 km per hour due to the altitude of the fissures between 1,500m and 2,000m, combined with the low viscosity of the lava. The lava flow reached 20 km from the fissures. 600 people were killed. A herd of elephants unfortunate enough to be caught up in the flow were preserved as lava formed moulds.
2002 Eruptions
Run Up to the 2002 Eruption
The 2002 eruption was preceded by seismic and fumarolic activity enabling warning to be given and the 400,000 residents in the hazard zone to be evacuated. Initial long period events and volcanic tremors were recorded between December 2000 and January 2002. Mount Nyamuragira erupted in February 2001 for two weeks but the seismicity remained high. In October 2001, seismic activity increased and a tectonic earthquake between 3.5M and 4M was felt, followed by a high amplitude volcanic tremor. White plumes were observed in the Shaheru and central craters and a dark plume was visible from the spatter cone accompanied by new fumarolic activity. In January 2002, seismic activity increased again, along with a >4M earthquake and the resumption of fumarolic activity; an eight-hour lull in seismic activity preceded the onset of the eruption.
Eruption January 2002
On 17 January 2002, a 13 km fissure system opened on the south side of the volcano which reached Lake Kivu; lava reached Goma, itself, covering part of the local airport’s runway and reaching the lake. Again, the initial speed of the lava was high at altitude but much lower in the vents nearer to Goma (0.1 to 1km per hour). Lava erupted from the higher parts of the fissure is thought to have temperatures of c.1370°C with little or no crystal content, whereas that closer to Goma was thought to have cooled to 1,320°C causing some crystallisation and increasing its viscosity. Lava covered 4.7 km2, leaving 120,000 people homeless. 245 fatalities were caused by CO2 and buildings collapsing from lava and seismic activity. A three-month seismic swarm which followed caused more building damaged.
Six months after the first eruption the volcano erupted again in 2002.
A. Pouclet, H. Bellon, K. Bram, “The Cenozoic volcanism in the Kivu rift: Assessment of the tectonic setting, geochemistry, and geochronology of the volcanic activity in the South-Kivu and Virunga regions”, Journal of African Earth Sciences, 121, (2016), 219-246: https://www.sciencedirect.com/
R. Gill, “Igneous Rocks and Processes A Practical Guide”, Wiley-Blackwell, 2010
P. Francis, C. Oppenheimer, “Volcanoes”, Second Edition, Oxford University Press, 2004
R. V. Fisher, G. Heiken, J. B. Hulen, “Volcanoes Crucibles of Change”, Princeton University Press, 1997
