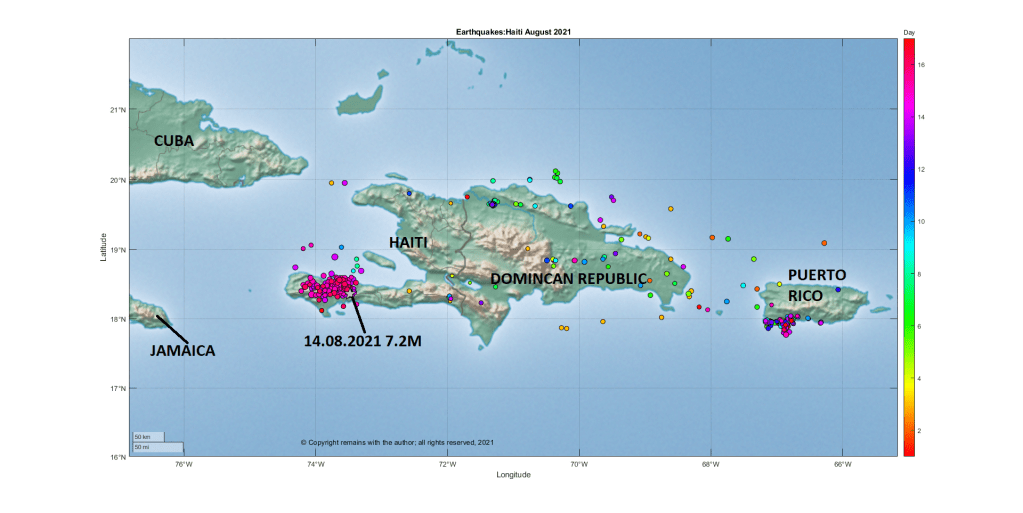
Our thoughts are with Haiti. Tragically, on 14 August 2021 at 8:29am (local time), a shallow (10km) earthquake of 7.2M occurred on the South West peninsula of Haiti 13 kilometres southeast of Petit Troup de Nippes. The earthquake was felt across the region, including Haiti, Dominican Republic, Jamaica, Cuba, and Puerto Rico. Over one million people may have been exposed to very strong or severe shaking.
A one-month state of emergency has been declared for Haiti. As of 16 August 2021, 1,419 are believed to have lost their lives, more than 6,000 injured and many thousands displaced. Tropical Depression Grace is likely to pass over the stricken area at the time of writing, bringing with it the risk of heavy rains, flooding, landslides and further loss of life.
Aftershocks are occurring, and may do so for some time. There is a small risk that this event is a foreshock to another event.
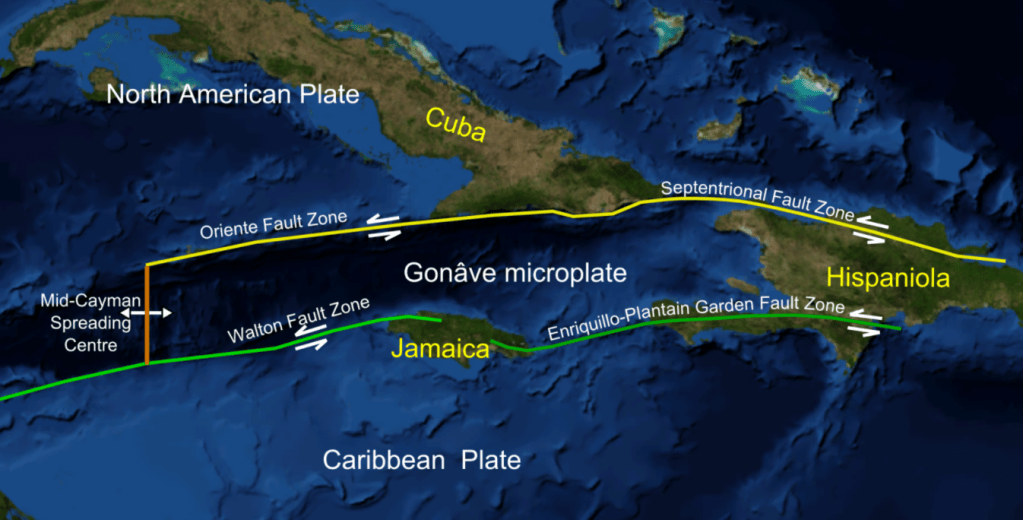
Haiti is located on the western side island of Hispaniola in the Greater Antilles Archipelago; the Dominican Republic occupies the eastern side of the island. Two large fault zones cross the island: the Septentrional-Orient fault in the north and the Enriquillo-Plantain Garden Fault Zone in the south.
Fig 2: Cropped image from one digitally altered by Mikenorton of the Gonâve Microplate (plate boundaries, main faults, islands and plates were added). Source: Gonâve microplate.
Hispaniola was formed from the collision of volcanic arcs with the North American Plate; the island is made up of 11 former island arcs. Haiti has an estimated population of 11.4 million (2018). The country is poor, politically unstable and yet to recover from the 2010 earthquake.
While the island has a volcanic past, there has not been any reported volcanic activity in the Holocene. There are two Pleistocene volcanoes in Haiti, the nepheline basalt scoria cones of Morne la Vigie, north of Port au Prince, and Thomazeau, east north east of Port-au-Prince, both of which were active around 1.5 million years ago; and, three in the Dominican Republic, the basaltic cinder cones of San Juan, trachyandesite lava domes and flows of the Dos Hermanos volcanic field and the rhyolitic to basalt Valle Nuevo volcanic field. The presence of picrite in the Duarte Complex in central Hispaniola and enriched basalts in southern Haiti are thought to be indicative of earlier hotspot activity
Tektites have been found in the Beloc Formation, Haiti, which are thought to have originated from the asteroid impact in Yucatán Peninsula, Mexico, which caused the K-Pg mass extinction event 66 million years ago.
2021 7.2 M Earthquake
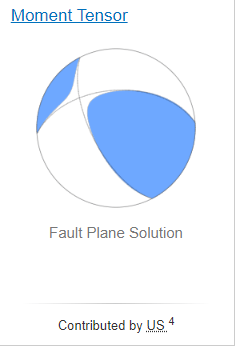
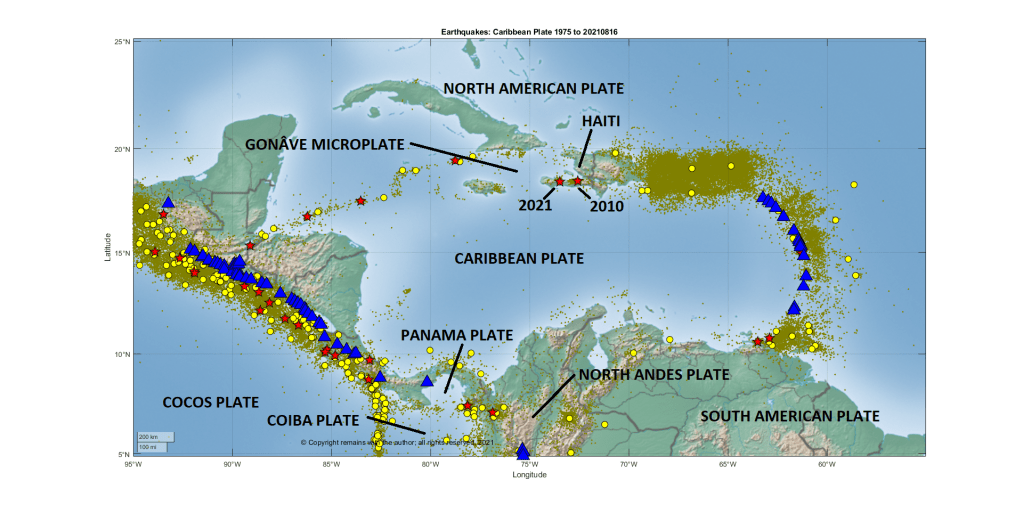
The earthquake occurred in the Enriquillo-Plantain Garden Fault zone on the transform plate boundary between the Caribbean Plate and the North American Plate. The faulting mechanism for this earthquake indicates oblique thrust faulting along the fault zone. This fault zone accommodates 7mm per year of the 20mm per year of the relative plate motion. It is likely that this earthquake occurred in the same fault system as the devastating January 2010 7.0M earthquake which occurred near Port-au-Prince, the capital.
According to the DEC, the January 2010 earthquake not only caused significant loss of life and damage but also severally impacted Haiti’s government and infrastructure: 25% civil servants died, 60% government buildings, 80% schools in Port-au-Prince and 60% schools in the South and West departments were destroyed. In all, over 220,000 were killed, more than 300,000 injured and around 300,000 homes damaged or destroyed.
USGS note that four other large earthquakes are known to have occurred in the region: October 1751 in the Gulf of Azua at the eastern end of the Enriquillo-Plantain Garden fault zone; November 1751 at Plaine du Cul-de-Sac which destroyed Port-au-Prince; June 1770 which also destroyed Port-au-Prince; and, April 1860 which also caused a tsunami.
It is expected that there will be a request for international aid. If you wish to help / donate to the aid effort, refer to your favourite international aid agency, in the first instance.
The recent eruption Mount Nyiragongo has taken us away from Iceland and the ongoing eruption at Geldingadalur, Fagradalsfjall, Iceland, to look at the East African Rift System. Unlike the current benign eruption in Iceland, there are 32 known fatalities from Mount Nyiragongo’s eruption, 3,629 homes and buildings destroyed, more than 20,000 displaced, many unaccounted for and several hundred thousand evacuated from parts of Goma to Sake. The current alert status for the volcano is orange. Our thoughts are with all those affected by the eruption.
As we refer to different lavas in more detail than originally anticipated, we will explain them in future posts; please bear with us for the moment.
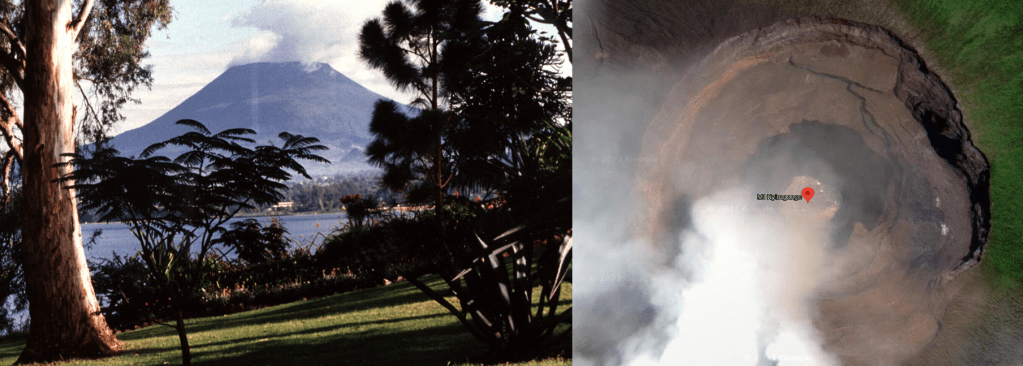
Fig 1: Photo of Mount Nyiragongo by B. Martinelli, 1994 (courtesy of Jack Lockwood, U.S. Geological Survey) (left) and screenshot of the Nyiragongo crater with lava lake pre 2021 eruption from Google Maps (right).
It has been reported that the volcano had not been fully monitored for several months due to lack of funding for the Goma Volcano Observatory. Monitoring improved in May 2021 when an American partner helped to get the internet connection to seismometers restored. This, and the ensuing eruption, must have been worrying times for the Observatory.
2021 Eruption
Run Up to the 2021 Eruption
Reports on GVP for Mount Nyiragongo note that strong thermal anomalies and gas emissions were observed in the period June 2018 to May 2020, along with incandescence, seismicity and gas / steam plumes.
In the period from June 2020 to November 2020, daily thermal activity was observed, indicating the presence of a large lava lake; levels of SO2 emissions fluctuated during the period.
Eruption May 2021
Mount Nyiragongo erupted on 22 May 2021 at around 18:15 local time, sending torrents of low viscosity lava down the side of the volcano, reaching as far as the outskirts of Goma. The following account of the eruption is summarised from bulletins on GVP.
The crater lava lake drained followed by the opening of at least two fissures on the south flank of the volcano. The first fissure’s lava originated near the Shaheru crater flowing eastwards over a main road; lava flows from the second fissure reached villages north of Goma destroying around 3,629 homes and buildings, displacing 20,000 to 25,000 people, and cutting off electricity and water supplies to parts of the city. Ash plumes, caused by collapse in the summit crater, rose initially to 45,000 feet then 20,000 to 30,000 feet.
Eye witnesses report that no felt earthquake preceded this eruption, which is consistent with instrument monitoring. Between 22 and 24 May 2021 earthquakes occurred between the summit and Lake Kivu. Tremors were felt in Goma every 30 minutes from midday 23 May 2021. Cracks appeared in different parts of the city, stretching several hundred metres southwards to the lake, some emitting gases and flames. A 5.1 M earthquake occurred beneath Lake Kivu at 10:37 on 24 May 2021. Seismicity remained intense on 25 May with more than 130 earthquakes between 2M and 5M recorded in a 24-hour period. News reports indicated hundreds of damaged buildings in neighbouring Rwanda. Rwanda suffered 13 earthquakes in excess of 4.0 between 23 May to 27 May 2021. Seismicity has since decreased, although there is some evidence suggesting magma movement beneath the city of Goma.
The volcano is monitored by the Observatoire Volcanologique de Goma (OVG). OVG have given four possible scenarios as to how the eruption could progress:
A new fissure eruption on the southern flanks of the volcano;
A new eruption with fissures in or extending to the cities.
A new eruption with fissures extending to Lake Kivu.
Activity subsides.
Lake Kivu contains dissolved gases, including CO2. Heat or other disturbance from fissure activity beneath the lake may release dissolved CO2 in a cloud that could kill at lower elevations in its path. Although the 2002 eruption did not cause a large gas release from the lake, you can never say never.
Background
Tectonic Setting
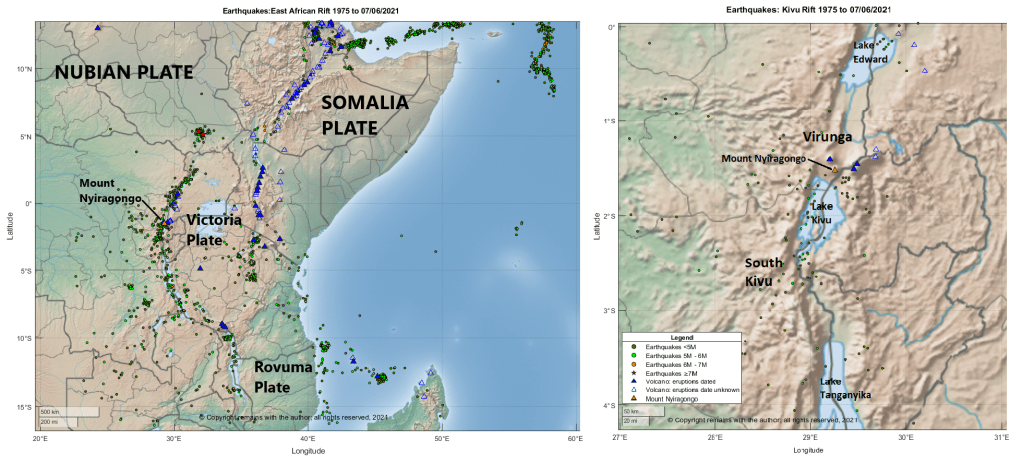
Nyiragongo is 3,470 m high stratovolcano with a 1.2 km wide summit crater which contained a small active cone and lava lake, located in the Virunga Mountains in the Kivu Rift on the western arm of the East African Rift. The volcano’s edifice is built of lava flows and pyroclastics. Goma, with a population of 670,000 is located on the shores of Lake Kivu 12 km south of the volcano.
Volcanic and tectonic activity in the area is complex, influenced by to the opening of the East African Rift System in the midst of pre-existing areas of crustal weakness. The East African Rift System is a 3,000 km long continental rift extending from the Afar Triple Junction to western Mozambique. The Nubian Plate is moving away from the Arabian and Somalia Plates. Mantle plumes are thought to be the cause of doming and rifting. Rifting occurs at rates of 1 to 4mm a year, increasing north to south on the western arm of the rift and increasing south to north on the eastern arm. The slower rate of rifting in the continental lithosphere results in different volcanism than oceanic crust settings.
The Kivu Rift was created c. 5 Ma; it extends between Lake Tanganyika to Lake Albert in the central part of the western branch of the East African Rift System in an area of uplift called the Kivu Dome. There are two areas of volcanism associated with the rift, the South Kivu Volcanic Province and the Virunga Volcanic Province. Lake Kivu, itself, is a complex series of basins, the result of a rift depression whose waters drained northward until blocked by volcanic activity in the Virunga Volcanic Province c. 11,000 years ago, after which they flowed southwards. We will focus on the Virunga volcanism.
The Virunga Mountains comprise eight volcanoes on the border between the Democratic Republic of the Congo, Rwanda and Uganda. The volcanoes are: Mount Karisimbi, a 4,507m a complex basanitic-to-trachytic volcano , last known eruption 8050 BC; Mount Mikeno, a dormant 4,437m volcano; Mount Muhabura, 4,127m basanitic-to-trachyandesitic stratovolcano; Mount Bisoke, a 3,711m trachyandesitic stratovolcano, last eruption1957 ; Mount Sabyinyo, an extinct 3,674m volcano and the oldest in the range; Mount Gahinga, an extinct 3,474m volcano; Mount Nyiragongo, a 3,470m foidite stratovolcano, last eruption 2021 ; and Mount Nyamuragira, a 3,058m high-potassium basaltic shield volcano, last eruption 2021.
In the Virunga Volcanic Province, volcanic activity occurred in two stages: 1) pre-rift doming which produced alkali basalts in west Virunga c. 13 Ma to 9 Ma, after which volcanic activity ceased; and, 2) the opening of a trans extensional fault zone with ENE-WSW displacement c. 2.6 Ma.
Mount Nyiragongo’s Lavas
The Virunga Volcanic Province lavas are leucite basanite (e.g., Nyamuragira) from primitive mantle at depths of between 80km to 150km, or a more enriched leucite-melilite nephelinite (e.g., Nyiragongo) from mantle source at the same depth which has been enriched by contact with a carbonatite source. The source for the carbonatite is thought to be either from contact between rising magma and carbonate containing fluids or melt addition before or during magma generation 500 ma to 800 ma.
Nyiragongo’s melilite leucite nephelinite lavas are classed as foidite with minor basalt / picro basalt. It is the low silica foidites that make her lava’s so fluid, despite the volcano being a stratovolcano. These lavas can reach a speed of 60 – 100 km per hour and, unlike most lavas, cannot be outrun. The edifice, itself, is built of lava flows interspersed with pyroclastics.
Mount Nyiragongo’s Historic Eruptions
Recording of Nyiragongo’s eruptions started in 1884. GVP records 20 Holocene eruptions, all of which are VEI 1, except for the VEI 2 January 2002 eruption. The most recent eruptions were in 1977, 1994, 2002 and now 2021.
In 1991, Mount Nyiragongo was designated a Decade Volcano, worthy of study.
1977 Eruption
On January 10, 1977, a system of N-S fissures opened near the Baruta and Shaheru craters and the lava lake drained. Initial lava flows reached speeds of 100 km per hour due to the altitude of the fissures between 1,500m and 2,000m, combined with the low viscosity of the lava. The lava flow reached 20 km from the fissures. 600 people were killed. A herd of elephants unfortunate enough to be caught up in the flow were preserved as lava formed moulds.
2002 Eruptions
Run Up to the 2002 Eruption
The 2002 eruption was preceded by seismic and fumarolic activity enabling warning to be given and the 400,000 residents in the hazard zone to be evacuated. Initial long period events and volcanic tremors were recorded between December 2000 and January 2002. Mount Nyamuragira erupted in February 2001 for two weeks but the seismicity remained high. In October 2001, seismic activity increased and a tectonic earthquake between 3.5M and 4M was felt, followed by a high amplitude volcanic tremor. White plumes were observed in the Shaheru and central craters and a dark plume was visible from the spatter cone accompanied by new fumarolic activity. In January 2002, seismic activity increased again, along with a >4M earthquake and the resumption of fumarolic activity; an eight-hour lull in seismic activity preceded the onset of the eruption.
Eruption January 2002
On 17 January 2002, a 13 km fissure system opened on the south side of the volcano which reached Lake Kivu; lava reached Goma, itself, covering part of the local airport’s runway and reaching the lake. Again, the initial speed of the lava was high at altitude but much lower in the vents nearer to Goma (0.1 to 1km per hour). Lava erupted from the higher parts of the fissure is thought to have temperatures of c.1370°C with little or no crystal content, whereas that closer to Goma was thought to have cooled to 1,320°C causing some crystallisation and increasing its viscosity. Lava covered 4.7 km2, leaving 120,000 people homeless. 245 fatalities were caused by CO2 and buildings collapsing from lava and seismic activity. A three-month seismic swarm which followed caused more building damaged.
Six months after the first eruption the volcano erupted again in 2002.
A. Pouclet, H. Bellon, K. Bram, “The Cenozoic volcanism in the Kivu rift: Assessment of the tectonic setting, geochemistry, and geochronology of the volcanic activity in the South-Kivu and Virunga regions”, Journal of African Earth Sciences, 121, (2016), 219-246: https://www.sciencedirect.com/
R. Gill, “Igneous Rocks and Processes A Practical Guide”, Wiley-Blackwell, 2010
P. Francis, C. Oppenheimer, “Volcanoes”, Second Edition, Oxford University Press, 2004
R. V. Fisher, G. Heiken, J. B. Hulen, “Volcanoes Crucibles of Change”, Princeton University Press, 1997
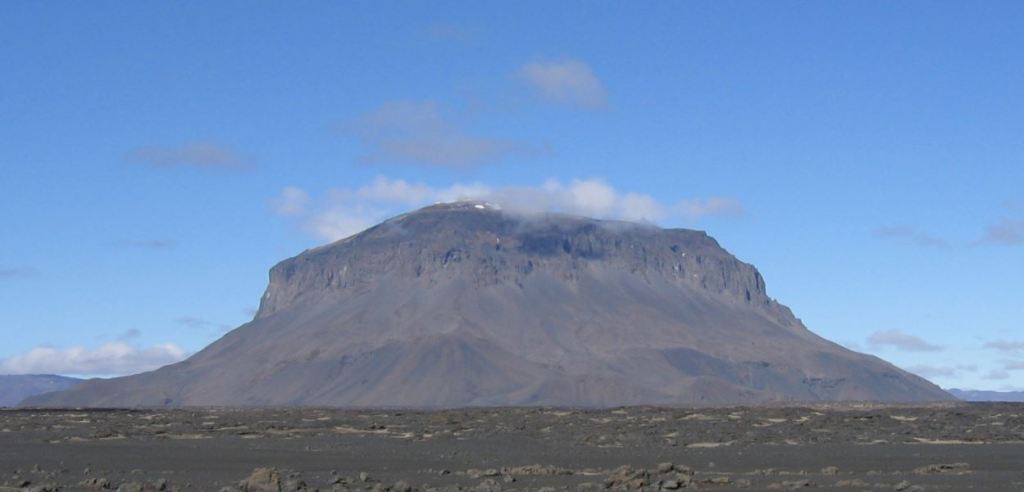
As the new volcano at Geldingadalur continues to grow, opening and closing new fissures, we have returned to our tour of Iceland. We have now reached the Northern Volcanic Zone, where the plate boundary heads northwards from Kverkfjöll to meet the Tjörnes Fracture Zone. Active volcanoes in the zone are Kverkfjöll, Askja, Fremrinámur, Heiðarsporðar, Krafla and Þeistareykir; Herðubreið, itself, is Pleistocene palagonite table-mountain.
We are starting with the currently most seismically active volcanoes, Askja and Herðubreið, located where the Eastern Volcanic Zone meets the Northern Volcanic Zone, north of the Vatnajökull ice-cap. The mantle plume, itself, is thought to be located to the north west of the Vatnajökull ice-cap.
Askja
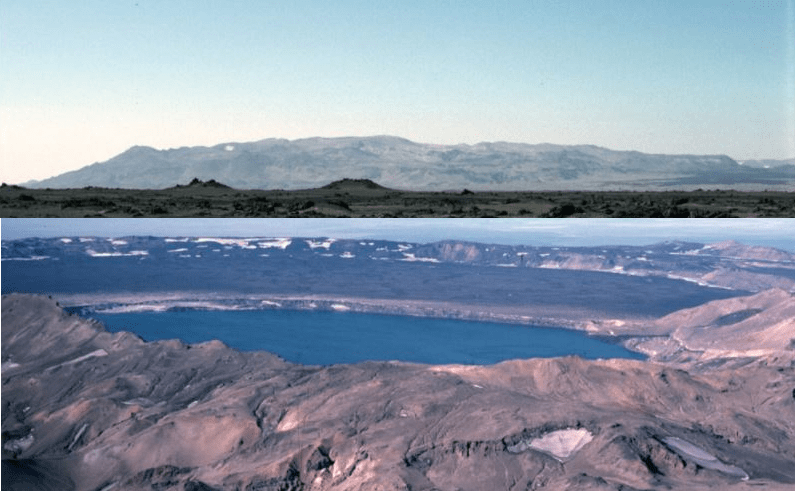
Fig 1: Combined images of Askja, cropped from photos by Michael Ryan, 1984 (U.S. Geological Survey): Askja Shield (top) and Askja Caldera (bottom) from GVP
The Askja volcanic system comprises a 1,516 m high central volcano and 190 km long fissure system, the central volcano being the Dyngjufjöll massif. It has three nested calderas, the latest of which formed in a rhyolitic eruption in 1875. The central volcano, itself, is made up of Pleistocene glacio-volcanic tuffs, hyaloclastites, pillow basalts and intercalated sub aerial lava and capped by Holocene sub aerial lavas and pumice. The fissure system, itself, extends from beneath the Vatnajokull ice-cap to the north coast of Iceland and includes small shield volcanoes.
This volcanic system does not erupt frequently; GVP records 14 Holocene eruptions which range from VEI 0 to VEI 5, the VEI 5s occurred in c. 8910 BC and 1875. Askja’s lava types are tholeiitic basalt / picro-basalt and rhyolite. Her main eruption types are effusive basalt with occasion explosive basalt or rhyolite. The 1875 eruption created a 4.5-km-wide caldera which is now filled by Öskjuvatn lake. The most recent eruption in 1961 was a VEI 2 effusive basalt one.
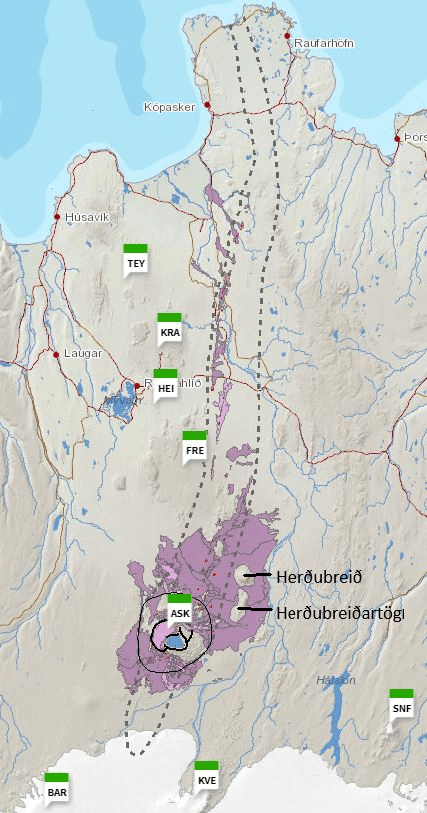
Fig 2: The Askja volcanic system from Icelandic Volcanoes . The boundary of the fissure system is delineated with a dotted line, the central volcano with a black line and the calderas with bold lines. The three letter abbreviations are other volcanic systems in the area: BAR is Barðarbunga, KVE is Kverkfjöll, SNF is Snæfell, ASK is Askja, FRE is Fremrinámur, HEI is Heiðarsporðar, KRA is Krafla and TEY is Þeistareykir. The author has added the names Herðubreið and Herðubreiðartögl.
The Askja Fires, 1874 to 1929
Askja was little known before the Askja Fires. The area is sparsely inhabited, sited in lava fields and ash deserts. The Fires occurred during a volcano-tectonic episode between 1874 to 1929.
A steam column rising from the central volcano in February 1874 was the first observed sign that the volcano was active. Northern Iceland was rocked by many large earthquakes in December 1874. Steam and ash were seen in early January 1875 and light ashfall was noted south of Öxarfjörður. By 15 February 1875, 10m subsidence had occurred in the main caldera along with the formation of a crater erupting mud. A basalt lava flow at Holuhraun to the south of Askja occurred around this time.
On 18 February 1875, a fissure eruption started on the Sveinagjá fissure north of the volcano; this generated 0.2 to 0.3km3 of basaltic lava over the course of several months.
On 29 March 1975, the Plinian eruption at the central volcano started in earnest. The initial output was a wet and sticky tephra. Shortly after 05:30, pumice was erupted, reaching as far as Scandinavia; this phase lasted until the following day. The Víti crater was formed later in a short hydro-magmatic episode. The caldera, itself, formed over a period of 40 to 50 years, is now filled by Öskjuvatn lake. As the volume of the new caldera is greater than the calculated erupted volume of lava and ash, it is thought that the excess lava is stored in the fissure system.
In 1929 to 1930, five eruptions occurred on ring faults around the Öskjuvatn caldera, with a 6 km long fissure eruption occurring on the southern side of the volcano that created the Þorvaldsraun lava.
The 1875 eruption is not the first time Askja has erupted rhyolite. Two other instances have been occurred: the c.10ka Skolli eruption and one around 2.1ka; these deposited thick layers of tephra and ash from the latter reached as far afield as Scotland and Sweden.
Holuhraun, which should be familiar to those interested in volcanology, is the area where a fissure eruption occurred in 2014. This time the central volcano responsible was Barðarbunga. At the time there was some concern at the time that the activity in Holuhruan would extend to Askja, triggering a rhyolitic eruption. Fortunately, that did not happen.
Herðubreið
Fig 3: Image of Herðubreið, cropped from a photo by Icemuon, published under CC BY-SA 3.0
Herðubreið is a 1,682m high Pleistocene palagonite table-mountain (tuya) made up of pillow lavas, hyaloclastite, capped by a 300m thick lava shield. Herðubreiðartögl, a small ridge extending from the south of Herðubreið, may be part of the same system. Although Herðubreið is close to the Askja and Kverkfjöll volcanic systems, in the absence of any post glacial activity it not known if it belongs to either system. We are including the volcano here as it is difficult to allocate the seismic activity in the area to each volcano without more local knowledge.
Herðubreið has been studied as an indicator of climate change during the last glacial periods. Werner et al, (1996) proposed that Herðubreið developed in stages from initial sub-aerial, sub-aqueous, subglacial to sub-aerial. The first sub-aerial activity occurred during an interglacial, creating an olivine tholeiitic shield volcano in the vicinity of Herðubreiðartögl. A lull in volcanic activity coincided with the onset of the last ice-age. Activity resumed with the deposition of olivine tholeiites, followed by hyaloclastites in a lake environment until the volcano breached the lake surface to produce subaerial lavas. The tuya, itself, was formed during the last glacial maximum when the volcano erupted pillow lavas under hyaloclastite deposits in the ice-cap; these were later topped by subaerial lavas when the volcano broke through the ice-sheet. At the end of the last ice-age, activity at Herðubreið had ceased, however, Herðubreiðartögl produced some later olivine tholeittic lava flows and ash deposits.
Recent Seismicity
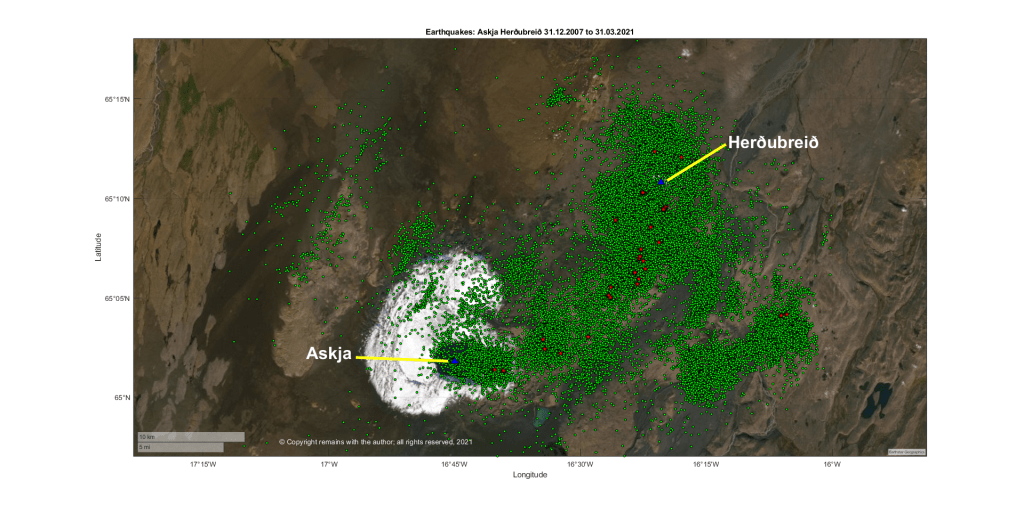
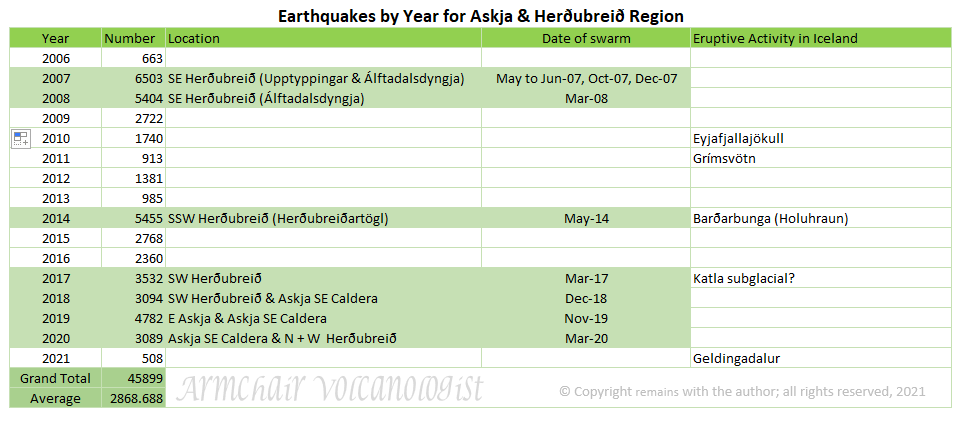
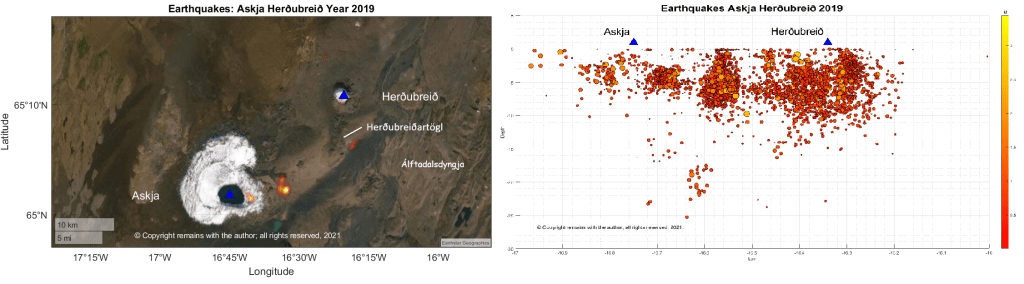
We plotted the area between 64.95°N,17.2°W and 65.3°N,16.0°W, a total of 45,899 earthquakes. As you can see from Fig 4, the area is very active (although perhaps we should not have used green dots in retrospect– Askja looks very unwell as a result).
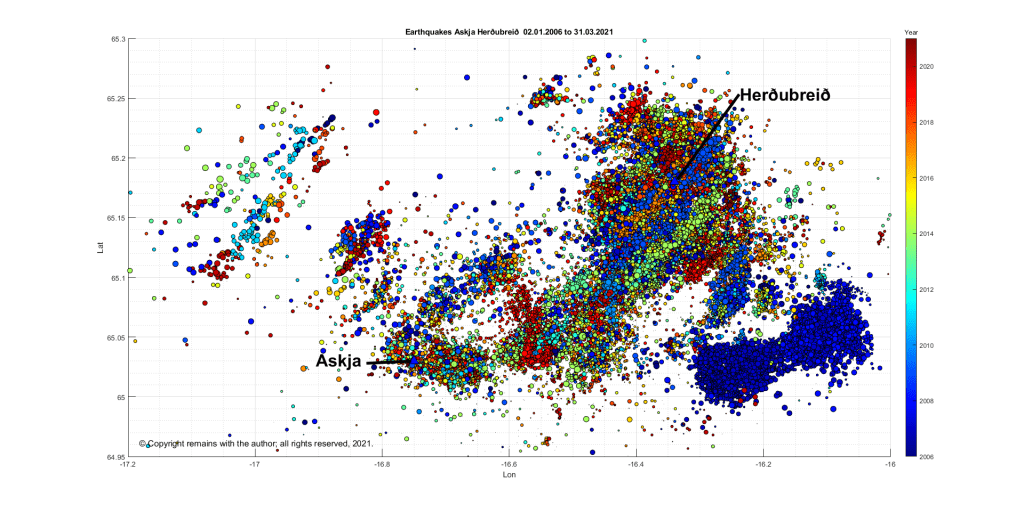
The latitude v longitude scatter plot shows that activity follows a NE-SW pattern around Herðubreið, with a swarm to the south east; activity around Askja is focussed on the SE section of the caldera with some further east. The plots are data-heavy so we have broken these down by year.
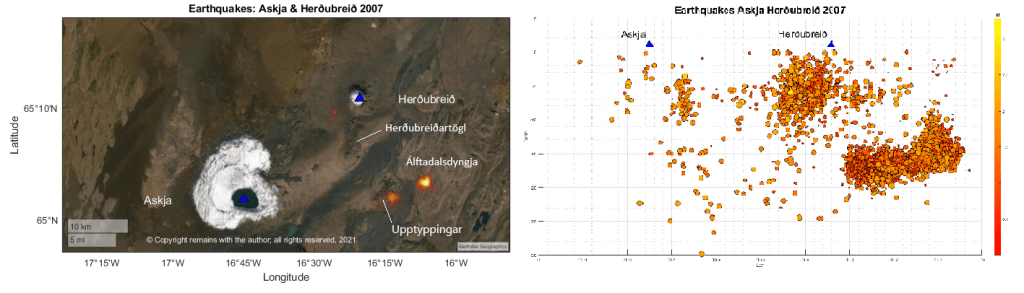
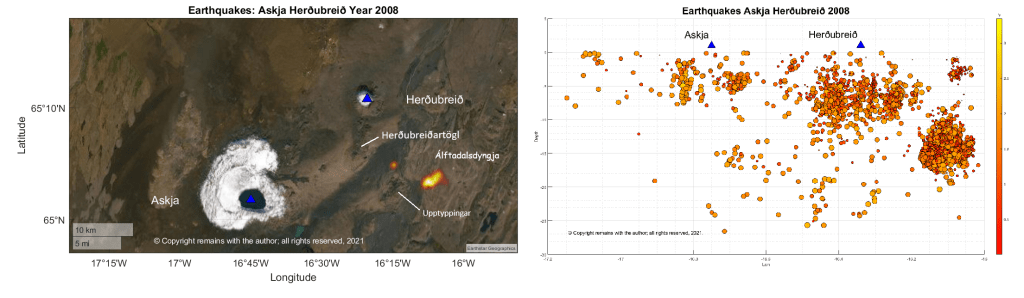
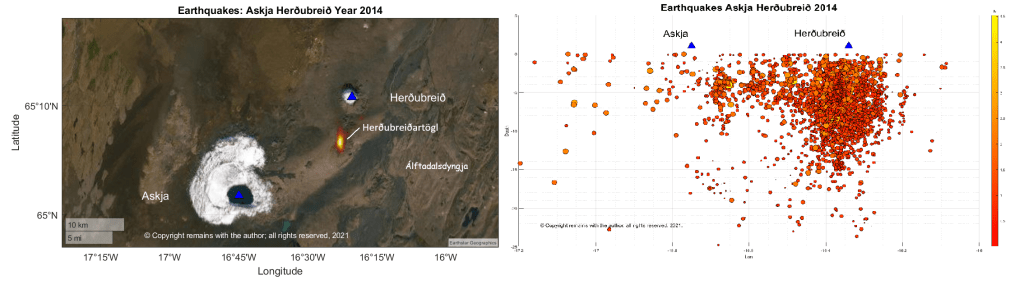
In 2007 and 2008, there was a swarm that started in Upptyppingar and progressed to Álftadalsdyngja; this is thought to be due to magma movement. 2014 is the same year as the Barðarbunga eruption at Holuhraun; perhaps some of the seismicity is the result of the crust accommodating magma movement in the region, although the swarm here preceded the swarms at Barðarbunga. In 2019, there was a swarm to the east of the Askja caldera.
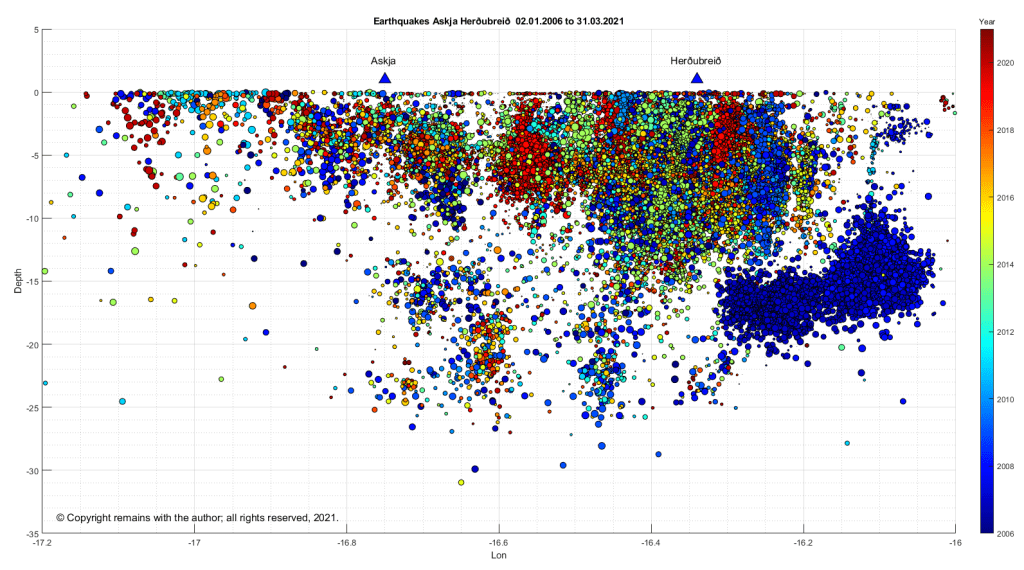
The earthquake density plots and depth v longitude plots for these years are set out in Figs 8 to 11 below.
Let’s see what the scientists have said. Greenfield et al (2016) have noted from seismic studies that there is considerable melt storage and transportation (movement) under the lower crust in the region (which may or may not be typical of Icelandic volcanoes – more study would be needed); there is likely to be a magma intrusive complex in the shallow crust round Askja; and, the activity round Herðubreið is caused by fracturing in the region.
The region is well monitored due to the risk of another rhyolitic eruption from Askja; this time around one may cause some disruption to aviation and communication systems, by how much would depend on the size and length of the eruption. In the light of the reawakening of Fagradalsfjall on the Reykjanes Peninsula, perhaps the Pleistocene volcanoes should be added to the watch list, although the monitoring of Holocene volcanoes is likely to pick up unusual activity.
La Soufrière St. Vincent
We have not forgotten La Soufrière St. Vincent; our thoughts are still with the islanders. We will do a fuller update soon. In the meantime, the volcano is still erupting and a new lava dome is forming in the crater. The island has lost up to 50% of its GDP. More aid is now reaching the island. For updates, we use News 784 (link below).
Barbados continues to clear up the volcanic ash; this is putting strain on local water supplies. For updates, we use Nation News Barbados.
R. Werner, H. U. Schmincke, G. Sigvaldason ,“A new model for the evolution of table mountains: volcanological and petrological evidence from Herðubreið and Herðubreiðartögl volcanoes (Iceland)”, Geologische Rundschau 85, Article number: 390 (1996). https://link.springer.com/article/10.1007/BF02422244
Thor Thordarson (Faculty of Earth Sciences, University of Iceland) and Al Margaret Hartley (University of Manchester (November 2019). Askja. In: Oladottir, B., Larsen, G. & Guðmundsson, M. T. Catalogue of Icelandic Volcanoes. IMO, UI and CPD-NCIP. Retrieved from http://icelandicvolcanoes.is/?volcano=ASK
“Classic Geology in Europe 3: Iceland”, Thor Thordarson & Armann Hoskuldsson, Terra Publishing, Third Edition, 2009.
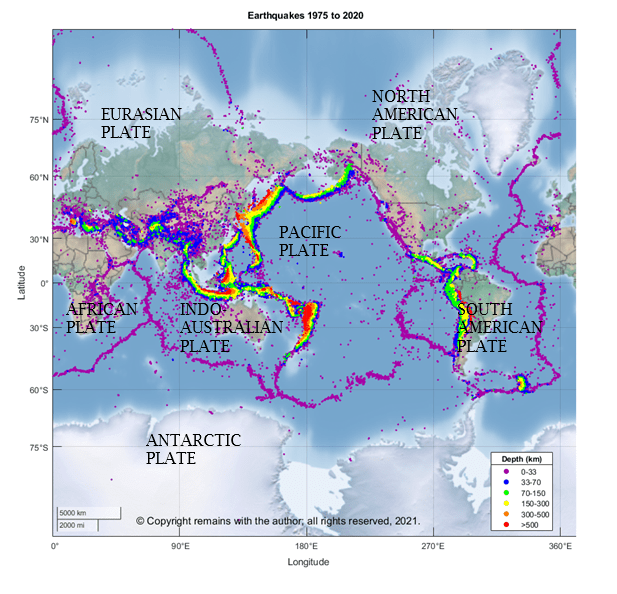
We’ve touched on plate tectonics in several articles so it would be useful to spend a brief moment summarise plate tectonics and to use earthquake data to show the plate boundaries.
Plate tectonics is the relative movement of the plates to each other. The Earth’s crust is made up of many rigid blocks called plates. There are 7 major plates: the North American Plate, the Eurasian Plate, the Pacific Plate, the South American Plate, the African Plate, the Indo-Australian Plate and the Antarctic Plate; many smaller plates, such as the Juan de Fuca Plate, the Cocos Plate, the Nazca Plate, the Caribbean Plate; and, several micro-plates in the collision zones between the larger plates.
History
The theory of plate tectonics has evolved from early mappers noting the similarities between the shapes of the continents to the current theories set out below. F B Taylor and Alfred Wegener developed theories (1910 and 1912, resp.) of continental drift, which was followed by the discovery of subduction zones from seismic studies by Wadati and Benioff in the 1920s and 1930s, Holmes theory (1928) that convection currents in the mantle caused by heat from radio-active decay stretched the oceanic crust caused the continents to split (the old oceanic crust cooled and sank back into the mantle to be melted and recycled), Hess’ theory (1950s) that the formation of ocean basins pushed continents apart and oceanic crust is formed at mid ocean ridges, confirmation in the 1960s of sea-floor spreading from post WWII studies of magnetic lineations on the sea floor, and the discovery of transform faults also in the 1960s.
The importance of magnetic lineations in the rocks of the sea bed is that when rocks are formed at the mid ocean ridges they are magnetised in the then direction of the earth’s magnetic field; the polarity of the earth’s magnetic field changes over a cycle and these changes are recorded in rocks, giving an indication of when the rocks were formed; the lineations are replicated each side of the spreading ridge.
Later GPS studies have confirmed the plate motions and led to the discovery of some microplates.
Composition of the Plates
The plates are made up of relatively rigid lithosphere with oceanic and / or continental crust.
Oceanic crust is around 7 km thick, principally made up of basalt, whereas continental crust is up to 30 km thick made up of granites and andesite. Oceanic crust is formed at sea-floor spreading centres (such as the Mid Atlantic Ridge). Continental crust is created by volcanic activity and the accretion of terranes (terranes are smaller segments of crust).
The lithosphere is the rocky upper mantle up to 100 km thick which rests on the weaker layer of the upper mantled called the asthenosphere. In the asthenosphere, heat rising from the Earth’s core, causes solid state convection; rock in the asthenosphere circulates round – heated rock rising and cooling rock sinking. The plates ride on the moving asthenosphere. As the plates move, they generate earthquakes.
There are three distinct types of plate boundary which are clearly delineated by seismic activity at the plate margins:
Divergent margins where plates move apart from each other. Asthenosphere rises to fill the gap, cooling to form new lithosphere. Ocean basins and ridges are formed in this process. Decompression melting of the mantle leads to the formation of magma and volcanoes. An example of a divergent margin is the Mid Atlantic Ridge.
Convergent margins where the plates move towards each other and one plate descends beneath the other or overrides the other. In ocean-to-continent or ocean-to-ocean collision, denser the oceanic crust subducts beneath the lighter continental or oceanic crust. The descending slab causes the formation of a trench and accretionary wedge (sediment scraped off adheres to the overriding plate). As the temperature and pressure increases on the descending plate, water is released which causes hydration melting of the mantle and surface volcanism. In continent-to-continent collision, there is no marked subduction: the plate edges are compressed, folded and uplifted. An example of ocean-to-continent collision is the plate boundary between the Pacific Plate and the North American Plate at the Aleutian Arc.
Transform margins where the plates slide past each other with no vertical motion. An example of this is the San Andreas Fault which marks the western boundary of the North American Plate.
There are other boundaries that are less well defined.
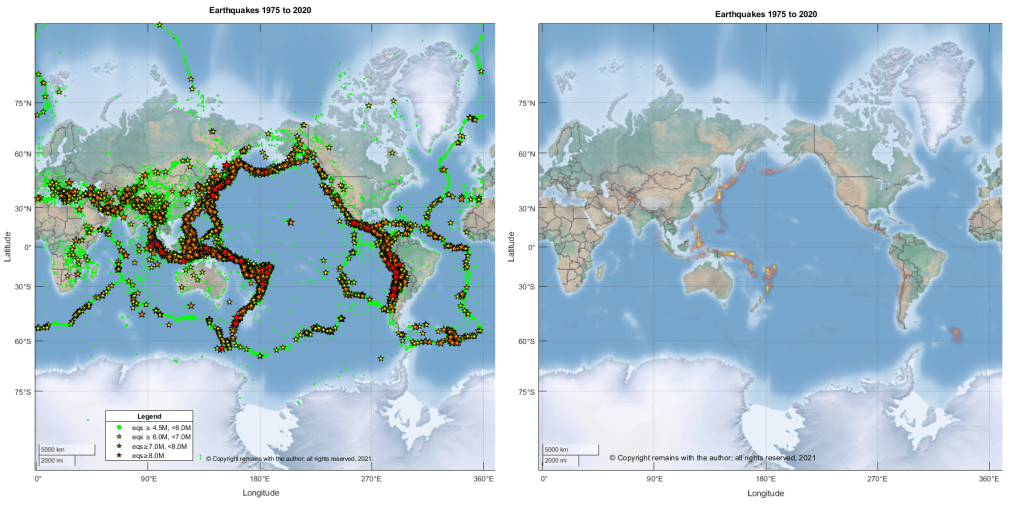
If we plot the earthquakes, we can see the plate boundaries. We plotted earthquakes downloaded from USGS’s earthquake search with magnitude ≥ 4.5M for the period 1975 to 2020 for coordinates 90°S, 180°W to 90°N, 180°E.
From out plots, most of the plate boundaries are clearly visible (some of the microplate boundaries are hidden due to the scale of the plots): the mid-ocean ridges, ocean-to-continent collision zones marked by deep subduction zones and the shallower continent-to-continent collision zones. We can also see that the subduction zones bordering the Pacific Ocean and subduction zones of Indonesia are responsible for most of the earthquakes with magnitude of 8.0M or more.
The drivers for plate motion are the convection currents in the asthenosphere drag the lithosphere (basal drag) and the pull of the cooler lithosphere sinking into the asthenosphere at subduction zones (slab suction, gravity or slab pull). Slab pull is considered to be the largest driver of plate motions. However, as you will see from the plots below, neither the North American Plate nor the Eurasian Plates have active subductions zones so another mechanism is needed. Super plumes of deeper mantle material may drive larger convection currents. Surge tectonics developed later suggests that the mantle flows in channels beneath the lithosphere which provide basal friction.
Reykjanes Peninsula – update
The Reykjanes Peninsula straddles the Mid-Atlantic Ridge. Here, the plate boundary consists is a transform margin, made up of a transform fault and localised rifting.At the time of writing, a large earthquake swarm is occurring.We have now added plots of the current rifting / dike formation event to our previous post (“Seismic Activity on the Reykjanes Peninsula“) for earthquake data downloaded on 1 March 2021. IMO is in the process of updating week, 2021 .
On 4 December 2020 the alert level for Mt. Pelée was raised to yellow due to increasing seismicity above background levels; and, on 29 December 2020 the alert level for La Soufrière St. Vincent was raised to orange following an increase in seismic activity, changes seen in the lake and fumaroles and a new growing lava dome emerging in the summit crater.
This led us to look into what drives volcanism in the area, notably the interaction of the Caribbean Plate with its surrounding plates.
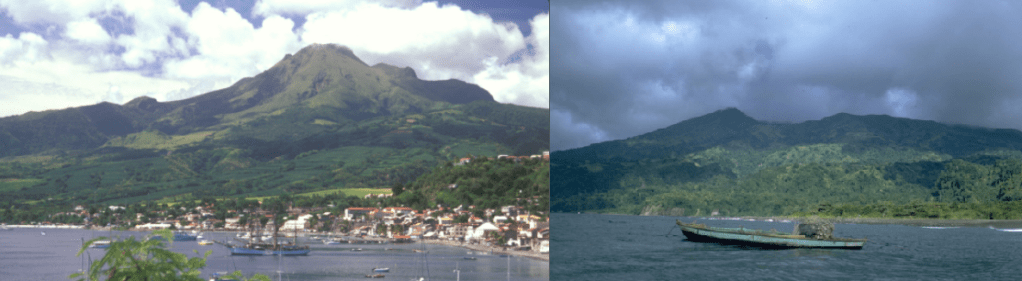
Fig 1: Mt. Pelée on the left with St. Pierre, photo by Lee Siebert, 2002 (Smithsonian Institution); Soufrière St. Vincent on the right, photo by William Melson, 1972 (Smithsonian Institution).
Mt. Pelée is famous for destroying the town of Saint- Pierre and its inhabitants plus visitors – a total of 29,000 people – in a matter of minutes on the morning of 8 May 1902 in a pyroclastic flow during a VEI 4 eruption. La Soufrière St. Vincent also erupted around the same time. Both volcanoes are located in the Lesser Antilles on the Caribbean Plate.
Mt. Pelée
Mt. Pelée is located on Martinique. She is a 1,400m high stratovolcano located in the caldera of an earlier volcano; edifice failures have breached the south west section of the caldera. Her lava types are andesite, basaltic andesite, dacite and basalt, picro basalt.
54 Holocene eruptions are recorded by GVP. Her historic eruptions include 1792 (VEI 1), 1851 (VEI 2), 1902 (VEI 4) and 1929 (VEI 3). Two lava domes were emplaced in the summit crater, l’Etang Sec, during the 1902 and 1929 eruptions.
1902 Eruption
Prior to the 1902 eruption, Mt Pelée’s known eruptions had been mild. Activity at the volcano started to ramp up gradually with fumaroles in the summit crater in 1889 to March 1902. From 23 April 1902 phreatic activity cleared out old rock, starting with minor explosive activity. By 4 May 1902 ash was raining down on Saint- Pierre. On 5 May, 23 people were killed when near boiling water from the crater heated by rising magma overran a distillery in a lahar in the Rivière Blanche valley.
On 6 May 1902, new lava emerged creating a lava dome. During 7 May 1902, small parts of the dome collapsed. At 07:50 on 8 May 1902, explosions were heard and a large black cloud seen to emerge and flow down the volcano, engulfing Saint-Pierre and some of the ships in the harbour. Most of the casualties were killed by hot gases and dust from the blast. Several pyroclastic flows followed: on 20 May 1902 a second pyroclastic current swept over Saint-Pierre destroying several of the remaining buildings; the Rivière Blanche valley saw several PDCs over the ensuing months; and, Morne Rouge was destroyed and 2,000 people killed by a pyroclastic current on 30 August 1902. During this activity a 300m lava spine emerged. After this eruptive activity continued until 1903. The lava spine has since been eroded.
Saint-Pierre had not been evacuated prior to 8 May 1902 for a couple of reasons: it was not known at the time that the volcano produced pyroclastic flows so the danger was not understood; and, an election was due on 11 May 1902, which politicians were keen should go ahead. No evacuation order was given.
When activity ramped up again prior to the 1929 eruption, people were evacuated in time.
La Soufrière St. Vincent
La Soufière St. Vincent can be found on St Vincent Island. She is a 1,234m high stratovolcano with crater lake and lava domes. The 1.6km wide summit crater is located on the south west edge of a 2.2km wide Somma crater; slope failure caused a breach in the Somma crater. Her lava types are andesite, basaltic andesite and basalt, picro basalt.
22 Holocene eruptions are recorded by GVP. Her historic eruptions include 1718 (VEI 3), 1812 (VEI 4), 1902 (VEI 4), 1971 (VEI 0) and 1979 (VEI 3). The 1902 eruption occurred on 6 May 1902, killing 1,680 people. The 1812 eruption produced a new crater, cutting through the summit crater. 1971 eruption extruded a lava dome in the summit crater, which erupted explosively in 1979 to be replaced by another dome.
Tectonic Setting
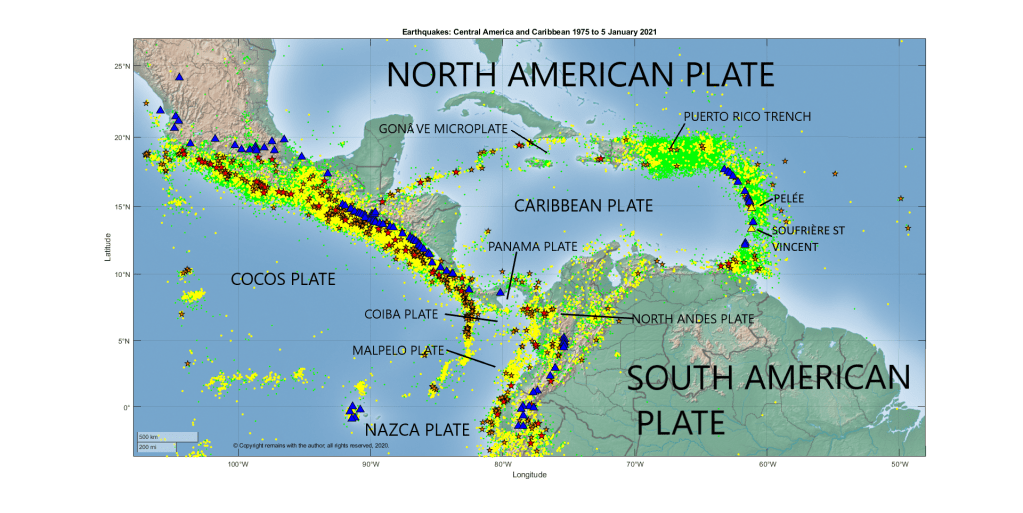
As noted above, both Mt. Pelée and La Soufrière St. Vincent are located on the Caribbean Plate in the Lesser Antilles. The Caribbean Plate is thick oceanic crust located between the North American and South American Plates. The northern boundary of the Caribbean Plate is a transform boundary with the North American plate, running from Central America to the Virgin Islands. The Gonâve microplate and Puerto Rico Trench form part of the northern boundary. At the eastern boundary, the South American Plate subducts under the Caribbean Plate in the Lesser Antilles. At the western boundary, the Cocos Plate subducts under the Caribbean Plate, forming the Central American Volcanic Arc. The southern boundary with the South American plate is a complex, comprising a convergent margin with the Panama Plate, a subduction zone with the North Andes Plate and a transform boundary with the South American Plate. The main plates velocities relative to the African Plate are noted below.
Plate
Direction
Velocity
North American Plate
West
25 mm per year
Cocos Plate
North east
67 mm per year
Caribbean Plate
North west
10 mm per year
Panama Plate
North west
19 mm per year
Coiba and Malpelo Plates
East
North Andes Plate
North west
23 mm per year
Nazca Plate
North east
40 -53 mm per year
South American Plate
West
27 – 34 mm per year
The origins of the Caribbean Plate are debated. There are two main theories which attempt to explain why the less dense but thicker crust of the plate overrides the Cocos and South American Plates. It may have evolved millions of years ago from the Caribbean large igneous province, formed at the Galapagos hotspot, drifting to its current location as the plates moved to accommodate the widening of the Atlantic Ocean. Alternatively, it may have formed from an old hotspot in the Atlantic. These theories are based on the relative motions of the plates. The first theory works on the basis that the Caribbean Plate is moving eastward compared to the North and South American Plates, whereas the latter uses the actual westward motion of the Caribbean Plate.
Recent Seismicity
Yes, we’ve downloaded earthquakes for the region from USGS’s earthquake search, taking a larger area than the Caribbean Plate in order to pick up the subduction zones. In this case, it was not really necessary as most subduction is beneath the Caribbean Plate, but it was fun to find several microplates in the process: the Gonâve, Panama, Coiba and Malpelo Plates. The Malpelo Plate was first identified as late as 2017 by Tuo Zhang, Richard G Gordon et al of Rice University.
The coordinates selected were: 3.760°S, 107.051°W to 26.838°N, 48.867°W for earthquakes with magnitudes of 2.5 or more between 1 January 1975 and 5 January 2021. This picked up 80,751 earthquakes.
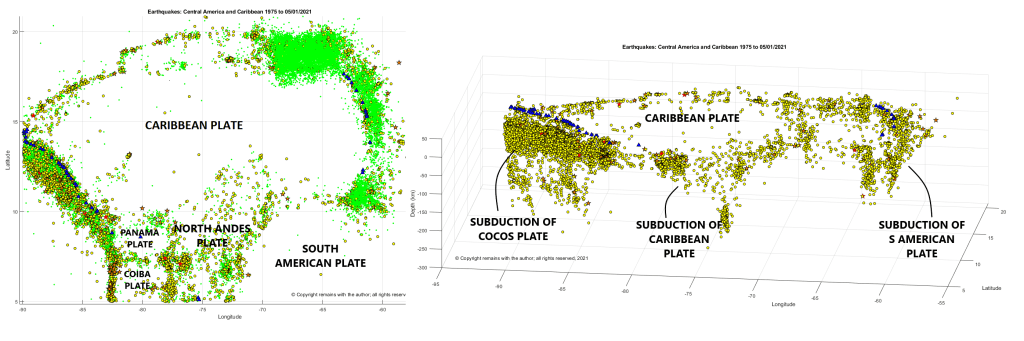
From Figs 2, 3 and 4 below, we can see the plate boundaries and the subduction zones on the western and eastern margins of the Caribbean plate are well marked by earthquakes and volcanoes; the subduction of the Caribbean Plate under the North Andes Plate is also visible (lower centre of the depth plot); and, the Puerto Rico Trench is also tectonically very active. The Puerto Rico Trench has produced some large earthquakes and tsunamis.
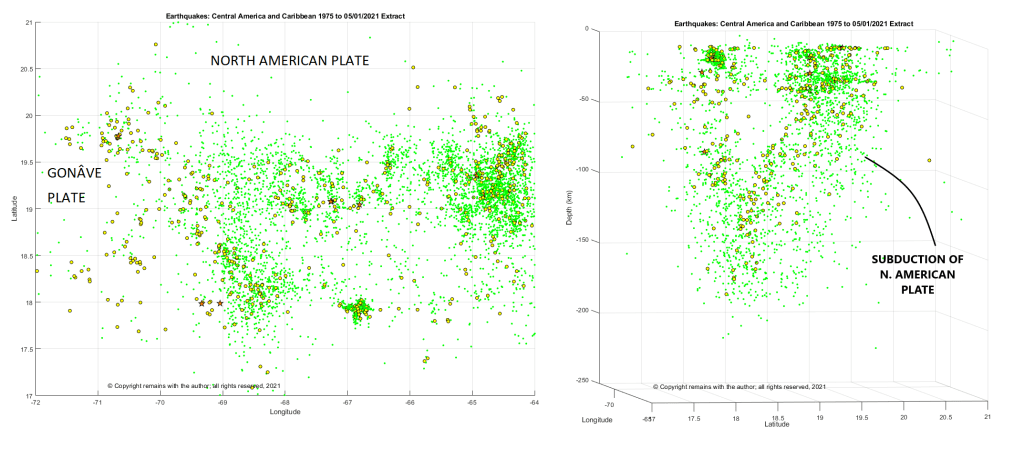
Fig 4 shows subduction of the North American Plate on the right of the depth plot. But there is also a line of earthquakes on the left of the plot which appears to indicate another subduction zone. Neither subduction zone here, despite being seismically active, has active volcanoes associated with it. It’s possible that there is another microplate here, but this is conjecture on our part until we can find an explanation or confirmation.
If you are interested or concerned by the alert statuses of Mt Pelée and La Soufrière St Vincent, you can find more information at L’Observatoire Volcanologique et Seismologique de Martinique, the National Emergency Management Organisation (NEMO) or GVP.
Hope you enjoyed our little tour. We will be looking in more detail at points of interest in the future.
Zhang, Tuo; Richard G. Gordon; Jay K. Mishra, and Chengzu Wang. 2017. The Malpelo Plate Hypothesis and implications for nonclosure of the Cocos-Nazca-Pacific plate motion circuit, 1. AGU Fall Meeting, New Orleans. Accessed 2018-06-06.
“Volcanoes”, Peter Francis and Clive Oppenheimer, Oxford University Press, Second Edition, 2004.
Today we are looking at plate tectonics, giving a brief introduction to the Aleutian Arc, which marks the boundary between the North American Plate and the Pacific Plate. The Arc is both seismically and volcanically active. Volcanic activity is of interest because the Arc lies under very busy North American and Asian aviation routes .
Fig 1: The Aleutian Arc. Map base from Google Maps. Names of some geological features added by the author.
The Pacific Plate is moving north westward at a rate of 59mm per year in the north east and 92mm per year in the north west. It subducts orthogonally under the North American Plate on its north-eastern margin, obliquely further westward, and parallel to the North American plate at the transform boundary on its north-western margin. The subduction zone comprises the island arc, the Aleutian Trench, and distinct Wadati-Beniof zones, which extend down to around to between 100 km and 250 km.
The Aleutian Arc is 3,000 km long from the junction with the Fairweather Fault (an extension of the Queen Charlotte Fault) in the east to the triple junction of the Ulakahan Fault, Aleutian Trench and Kuril-Kamchatka Trench in the west. The arc includes a 2,500 km long chain of basaltic andesitic stratovolcanoes and calderas. Behind the arc are basaltic lava fields in the Bering Sea. Most volcanoes are in uninhabited or sparsely populated areas so they pose more of a risk to aviation.
Origins of the Aleutian Arc
In the early Cenozoic, 60 million years ago, the Farallon Plate and Kula Plates covered what is now the northern Pacific Ocean; the Kula Plate moved northwards, while the Farallon Plate moved eastwards. There were active continental margins: in the north west there was in island arc; and, in the north east there was subduction of oceanic crust beneath the Bering Shelf volcanic belt. The Kula-Pacific Transform Fracture Zone may have separated the north west Pacific from the north east.
In the middle of the Eocene (50 million years ago to 47 million years ago) the movement of the Pacific Ocean plates changed from the NNW subduction of the Kula Plate, followed by ridge subduction, to the NW subduction of the Pacific Plate. This change in motion resulted in the formation of the Aleutian Arc and its back-arc basin in the Bering Sea. The Shirshov Ridge and Bowers Ridge originated from the ongoing displacement of the North American Plate in relation to the Eurasian Plate in the mid Eocene. Subduction beneath the Kamchatka margin is associated with the late Cenozoic. The Komandorsky Basin formed in the Miocene.
The oblique subduction of the Pacific Plate towards the centre of the Aleutian Arc has caused clock-wise rotation of island arc blocks and breaches in the island chain, notably at the Near, Buldir, Amchitka and Amukta Straits. This motion moved the Komandorsky block from its location at the subduction zone near the junction with the Bowers Ridge to its current location at the transform boundary; Eocene volcanicsnin the block ceased after its movement away from the subduction zone. Recent tomographic studies have shown a possible slab under the Bering Sea that may be a remnant of the Kula Plate.
Recent Seismicity
The current Aleutian Arc is seismically very active; it has produced several large earthquakes with magnitudes in excess of 7.0M.
We looked at the earthquakes between 1 January 1975 to 30 November 2020 with a magnitude greater than 4.5M from 47.04°N, 142.559°W to 66.548°N, 198.984°W downloaded from USGS Earthquake search (see Sources below). This includes the triple junction at the west of the Arc and the junction with the Fairweather Fault in the east, and the Bering Sea. It also picks up some of the subduction zone to the west at the northern end of the Kuril-Kamchatka Trench. We also identified seismic swarms in the period; for this purpose, swarms are defined here as more than 30 earthquakes per day (normally there are less than 10 per day).
Figs 2a and 2b show that most of the action is at the southern section of the Arc where the subduction of the Pacific Plate changes from orthogonal to oblique. The geoscatter plot shows that most of the swarms are occurring here, confirmed by the geodensity plot. There is very little seismic activity behind the arc, except for a swarm in Kamchatka north of the arc.
Earthquakes with magnitudes greater than 7.0M occur round the arc, with the exception of the region near the Fox Islands; the lack of earthquakes here greater than 7.0M may be due to the nature of the crust, or, the comparatively short time period selected (45 years is a short time in geological terms).
If we look closer at sections of the arc (see figs 3a to 3e below), we can see that that earthquakes tend to follow a block pattern with gaps in between; the gaps may be gaps between crustal blocks or they may be areas likely to have swarms in the future. We can also see the well-defined Wadati-Benioff Zones which extend to a depth of 250 km in the Eastern and Central Blocks (blocks here are the sections of the arc that we have selected to plot and are not intended to represent crustal blocks).
The lack of an active Wadati-Beniof Zone under the western segment of the Aleutian Arc explains why there is little current volcanism there. Active volcanism in Kamchatka is south of the Aleutian arc, driven by the subduction of the Pacific Plate under the Okhotsk Plate. There is some seismicity in Kamchatka, north of the Aleutian Arc; this does not appear to be connected to an active subduction zone, although looking at Google Maps there may be an old trench in the area.
Clearly, the western and eastern segments of the Aleutian Arc are complex junctions and deserve a closer look. We will examine this in more detail when we discuss volcanic activity.
“Volcanoes of the World”, Third Edition, Lee Siebert, Tom Simkin, and Paul Kimberly, Smithsonian Institution, 2010, University of California Press
“Cenozoic Geodynamics of the Bering Sea Region”, V. D. Chekhovich, A. N. Sukhov, O. G. Sheremet, and, M. V. Kononov, Geotectonics, 2012, Vol. 46, No. 3, pp 212-231.
“Bowers Ridge (Bering Sea): An Oligocene – Early Miocene Island Arc”, Maren Wanke, Maxim Portnyagin, Kaj Hoernle, Reinhard Werner, Folkmar Hanff, Paul van den Bogaard, and Dieter Garbe-Schönber, Geology (2012) 40 (8): 687–690.
Sadly, a 7.0 magnitude shallow earthquake occurred to the north of the Greek island of Samos on 30 October 2020. This caused a number of fatalities, injuries and property damage in both Greece and Turkey.
This prompted us to take a look at the tectonics in the region.
Activity here is driven by the collision of the north eastern moving African Plate with the Eurasian Plate. Of the microplates which have broken off the Eurasian Plate during the collision, we are interested in the Aegean Sea Plate and the Anatolian Plate.
Anatolian Plate
The African Plate subducts under the south and south west margins of the Anatolian Plate at the Hellenic and Cyprus arcs; there is a transform boundary with the Eurasian Plate on the northern edge at the North Anatolian Fault Zone (NAFZ); the western edge is a divergent boundary with the Aegean Plate; and, the eastern edge is the East Anatolian Fault which marks the transform boundary with the Arabian Plate. The plate is rotating anti-clockwise, pushed westward at a speed of 21 mm per year relative to the African Plate by the northward motion of the Arabian Plate.
The East Anatolian Fault extends from the Maras Triple Junction at the northern end of the Dead Sea Transform to the Karliova Triple Junction and North Anatolian Fault.
The North Anatolian Fault extends from the junction with the East Anatolian Fault at the Karliova Triple Junction to the Aegean Sea. This fault has produced several earthquakes of magnitudes in excess of 7.0 M, which since 1939 have been occurring along the fault in a westward pattern, until 1999. There is concern that westward trend may be resumed to continue onwards to Istanbul, itself.
Aegean Sea Plate
The African Plate subducts beneath the southern edge of Aegean Plate at the Hellenic Trench. The northern edges of the Plate are divergent boundaries with the Eurasian Plate and the Anatolian Plate. The plate is moving south westward at a speed of 37mm per year relative to the African Plate.
Samos is located in the Eastern Mediterranean on the Aegean Plate. The 7.0 M earthquake on 30 October 2020 was the result of normal faulting in the Aegean Plate as part of the north-south extension caused by the accommodation of the relative motions of the plates and trench; i.e., northward motion of the African plate, southward motion of the Hellenic Trench and westward motion of the Anatolian Plate.
Large earthquakes in the Aegean Sea are common; USGS notes that there have been 29 earthquakes over 6.0 M in the past 100 years. They highlight two damaging quakes: the July 1956 7.7 M quake and its 7.2M aftershock, which caused a large tsunami, 53 deaths, 100 injuries and damage on Amorgos and Santorini; and, a 6.6 M in July 2017 near Bodrum in Turkey which caused 2 deaths and many injuries in Turkey and neighbouring Greece.
Recent Seismicity
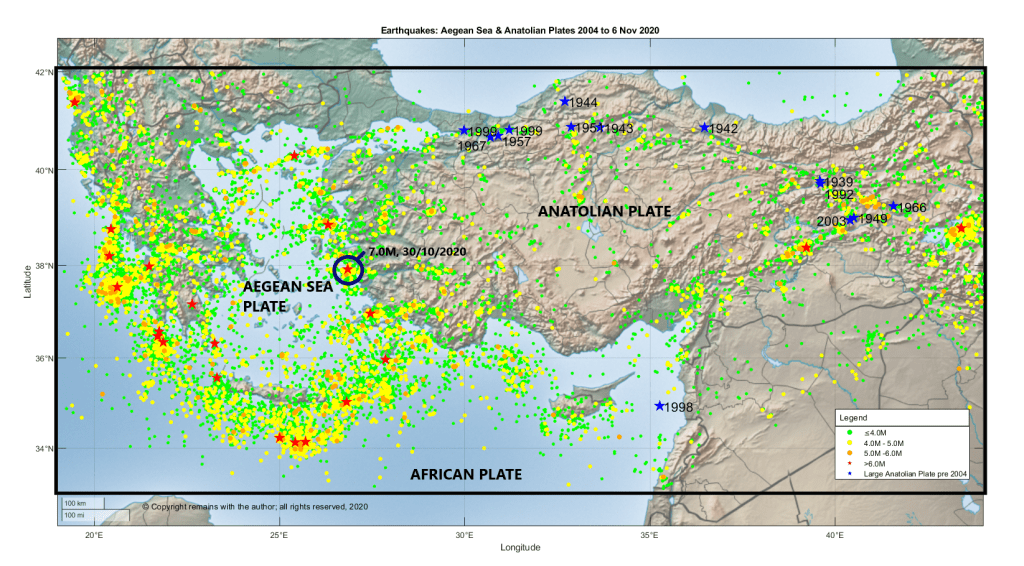
We plotted the earthquakes greater than or equal to 3.5 M between 33.0°N, 19.0°E to 42.0°N, 44.0°E (the area in the large rectangle in Fig 1) for the period 1 October 2004 to 6 November 2020 downloaded from EMSC’s earthquake search facility. In the period there were 13,034 earthquakes.
From Fig 1 above, which shows the geoscatter plot of the earthquakes, we can get a rough outline of the plate boundaries. However, some of the faults on the eastern side of the Aegean Sea Plate are accommodating the north-south extension of the plate so may not delineate the plate boundary, itself. Although our dataset goes back as far as 2004, we have added the large earthquakes of the North and East Anatolian Faults from 1939 to 2003; these are shown in blue. It is interesting to note that there have not been any large earthquakes on the North Anatolian Fault in the Anatolian Plate segments since 1999.
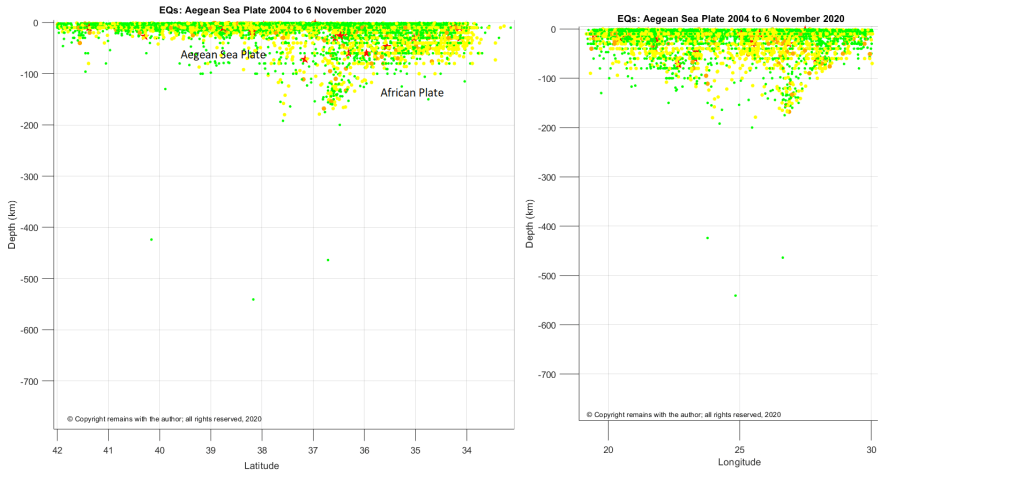
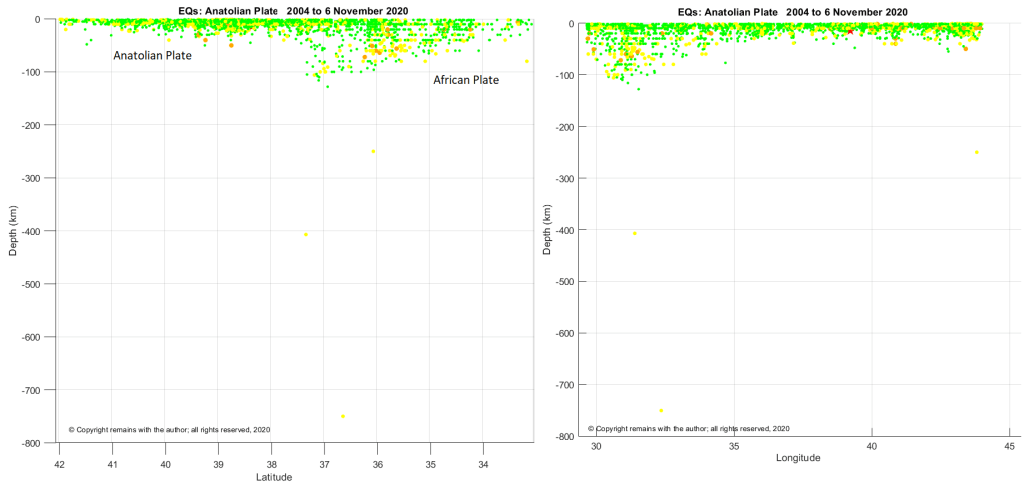
Depth plots show the subduction of the African plate under the Aegean Sea Plate (Fig 2) and the Anatolian Plate (Fig 3).
In Fig 2, we can clearly see that the descending plate under the Aegean Sea Plate reaches a depth of c. 200 km. The subduction zone feeds the Greek volcanoes, Methana, Milos, Santorini, Nisyros and Yali. There are also a few very deep earthquakes lurking in the area.
In Fig 3, we can see that the subduction zone under the Anatolian Plate does not descend as far as that under the Aegean Sea Plate. This may be why the volcanoes in western and central Turkey have not erupted in the last few thousand years, although some have erupted in the Holocene.
Our thoughts are with those impacted by the 7.0 earthquake on 30 October 2020, and, indeed, with those adversely impacted by any earthquake.


