Good afternoon,
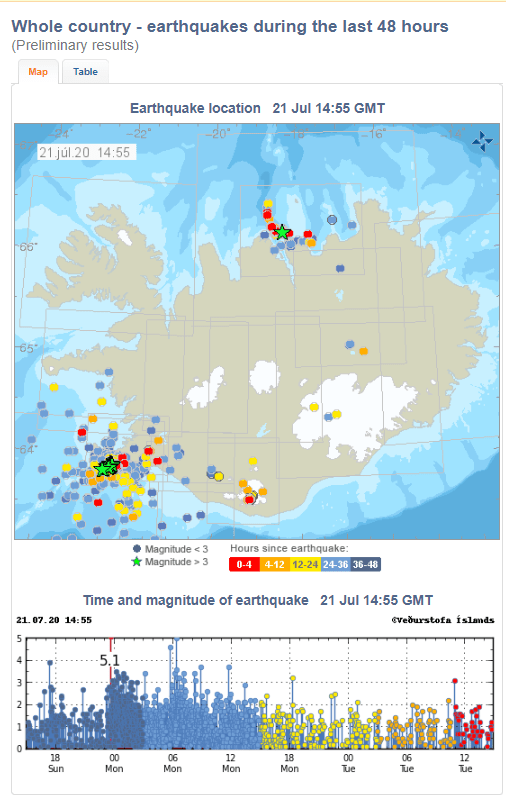
In recent weeks Katla has been showing a heightened level of unrest. Just last month there was an earthquake swarm which led to the temporary raising of the aviation alert level to yellow. Yesterday, the Iceland Met Office reported a risk of ongoing earthquakes at Mýrdalsjökull, gas pollution near Kötlujökull and higher than usual water levels at Múlakvisl; this may be indicative of geothermal activity or magma movement. The alert level is green at the time of writing.
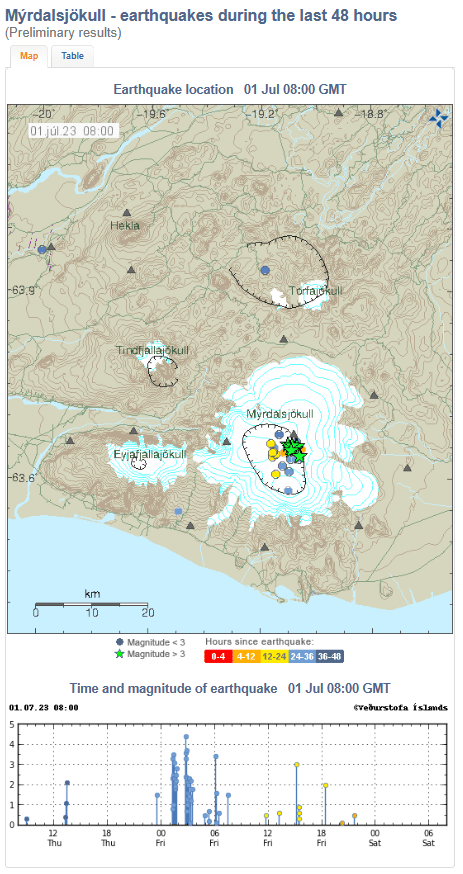
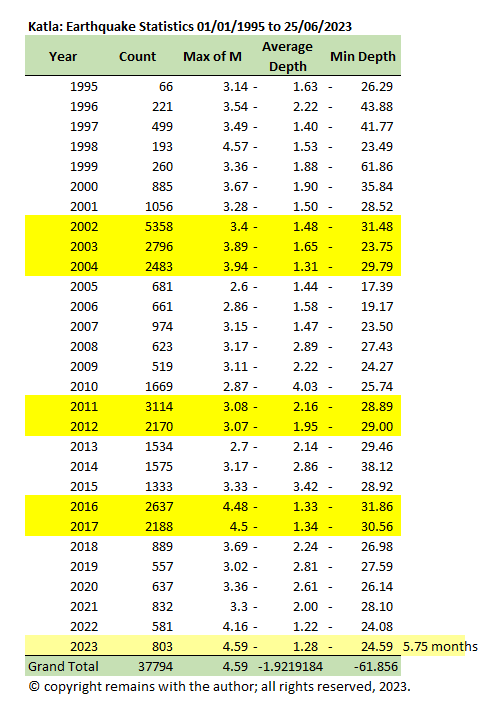
So we took a moment to update our Iceland earthquake database to 25th June 2023 (the earthquake list for week ending 2nd July 2023 is not yet available, although they can be viewed on Skjálfta-Lísa (vedur.is)) and plot the earthquakes at Myrdalsjökull, 63.1°N,18.5°W to 64.2°N,20.00°W, and then the caldera area, 63.45°N,18.98°W to 63.72°N, 19.24°W from 1st January 1995 to 25th June 2023.
Our earthquake density plots show that most activity is close to Godabunga, Katla’s cryptodome.
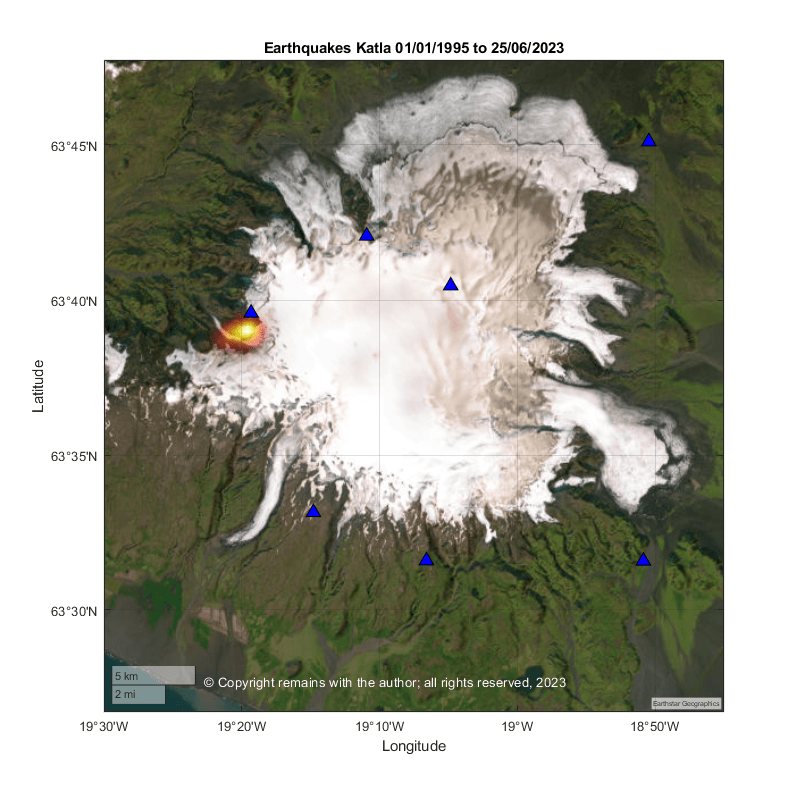
Given that activity near Godabunga has dominated the above plot, we plotted a smaller area for the caldera.
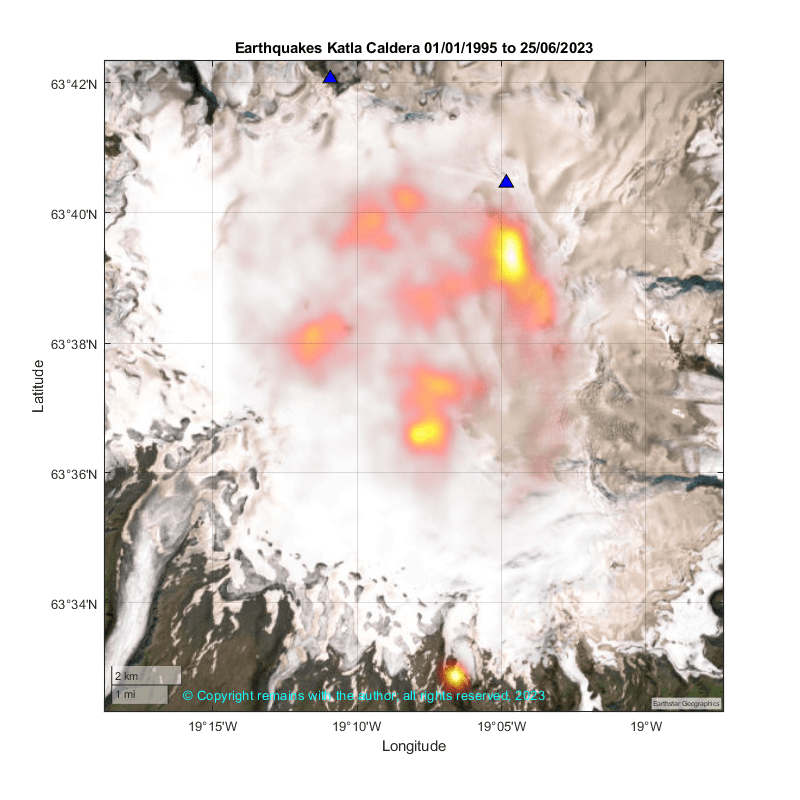
This plot shows most seismic activity in the NE of the caldera, near the site of the source of the 1955 jökulhlaup, some in the S of the caldera near the source of the 1918 eruption and 2011 jökulhlaup and another swarm on the volcano’s flank, south of the caldera. The swarm to the south of the caldera occurred in 2011 at the Gvendarfell Ridge. Later study of the Gvendarfell Ridge found sources of recent flank eruptions, including rhyolitic domes and Surtseyan craters.
We have also plotted monthly geoscatter plots for Myrdalsjökull from January 1995 to June 2023 (25 June 2023) and created a 3D rotating scatter plot for the same time period and area.
We make no predictions. For updates, please refer to the Icelandic authorities. IMO is a good starting point.
Armchair Volcanologist
© Copyright remains with the author; all rights reserved, 2023
Sources:
Raw earthquake data: Icelandic Meteorological office (vedur.is)
Giulisa Sgattoni, Federico Lucchi, Páll Einarsson, Ólafur Gudmundsson, Gianfilippo De Astis, and Claudio Antonio Tranne, “The 2011 unrest at Katla volcano: seismicity and geological context”, JÖKULL. No 69, 2019. https://jokull.jorfi.is/wp-content/uploads/2021/12/J69-53-70
Also see our earlier article for background information: The Katla Volcanic System, Mýrdalsjökull – the not so cuddly Katla