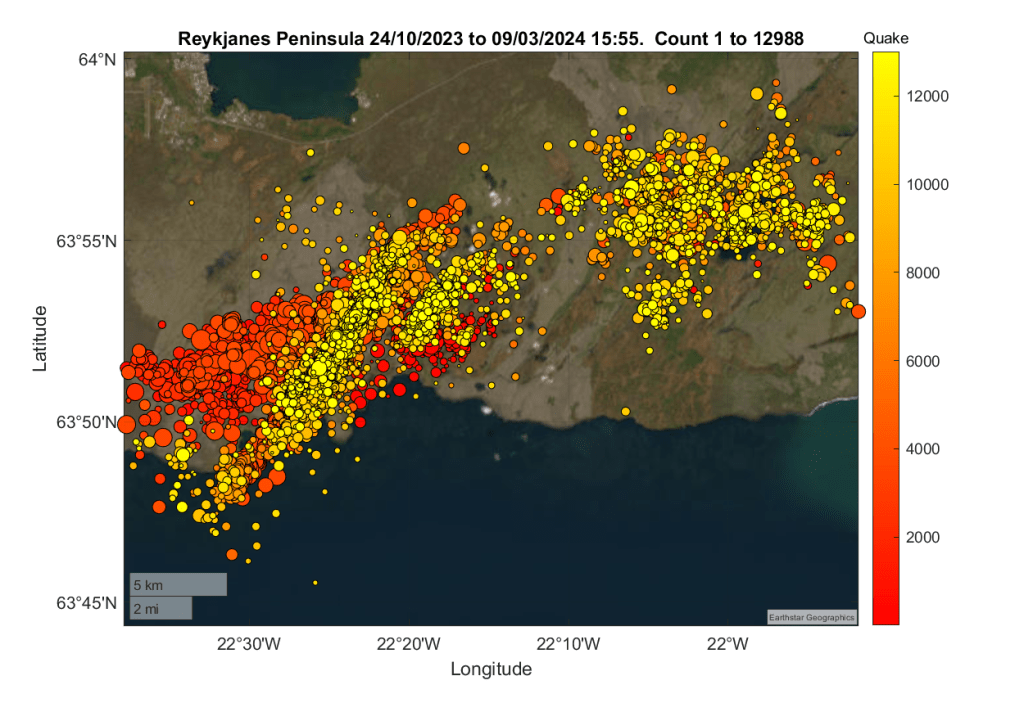
While waiting to see where and when the next eruption on the Reykjanes Peninsula occurs, we have updated our earthquake plots for the area between 63.746°N, 22.631°W and 63.996°N, 21.864°W from 24th October 2023 to 9th March 2024 – a total of 12,988 earthquakes. We have extended the area plotted to include Krýsuvík.
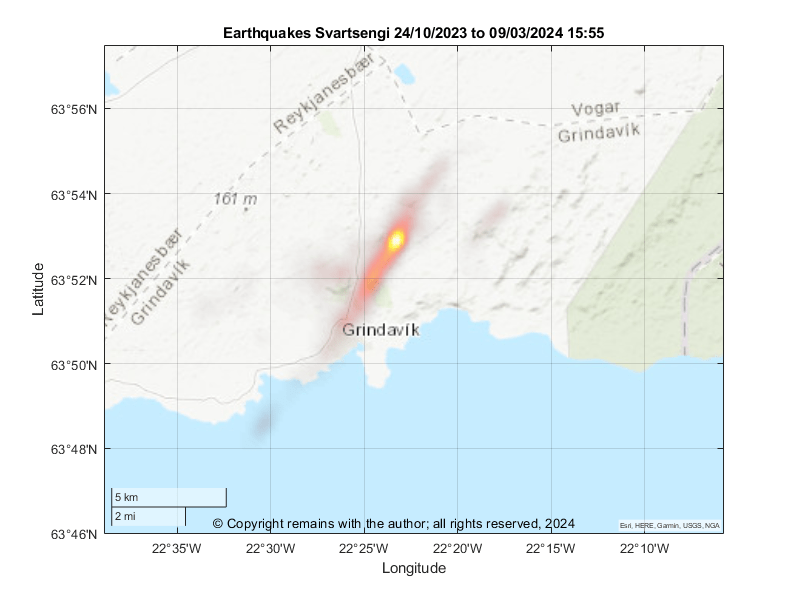
First, we start with the geodensity plot for the period 24th October 2023 to 9th March 2024. Most activity is still occurring on the magma intrusion / graben between Hagafell and Stóra-Skógafell. The earthquake density plots for the entire period also picks up some activity southwest of Grindavík, west of Fagradalsfjall and at Mount Þorbjörn. This shows best on a topographic map with a lighter background.
Next, we look at the geoscatter plot for the same area and period. This shows the activity along the magma intrusion / graben, that west of Fagradalsfjall, and, also, an upkick in activity in the Krýsuvík area. The last may be local faults accommodating the uplift at Svartsengi. Whether or not this lets magma ascend in the Krýsuvík volcanic system, itself, remains to be seen. At the time of writing, the alert level for Krýsuvík is unchanged at green.
At the time of writing, the eruption has not materialised. The swarm continues, albeit the magnitude and number of the earthquakes has decreased.
The status of Grindavík has been downgraded from “emergency” to “danger”. The aviation code has been reduced to yellow. If an eruption does ensue from this swarm, the most likely location is between Hagafell and Sýlingarfell.
On 21st November 2023, IMO reported significant uplift in the vicinity of Svartsengi. While an eruption may follow here, it is thought that it would be preceded by an increase in seismic activity. There is still a likelihood of an eruption near the magma intrusion. Since then, uplift has continued.
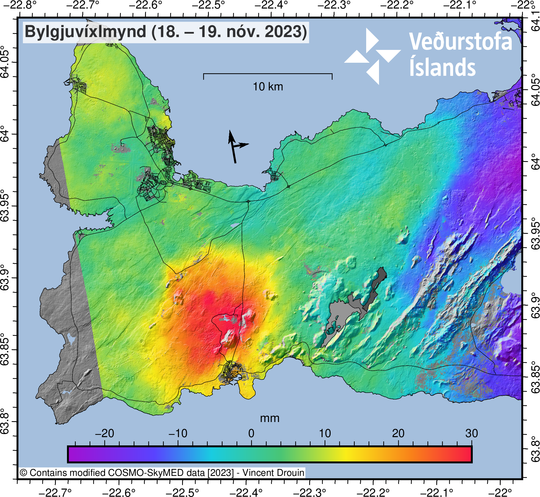
Fig 33: COSMO-Skymed interferogram spanning 24-hours between 18−19 November at 06:41. The broad uplift signal visible in orange/red around Svartsengi is indicative of inflation occurring at a depth of > 5km. Source: IMO
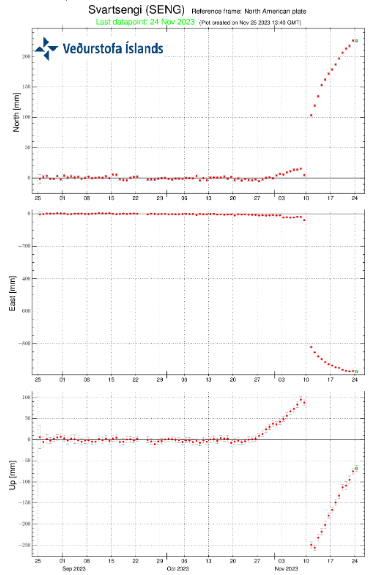
Fig 34: GPS from IMO showing ground deformation at Svartsengi. There was initial uplift at the start of the swarm, followed by large drop when the graben was reactivated / dike formed, which, in turn, is followed by resumed uplift. Source: IMO.
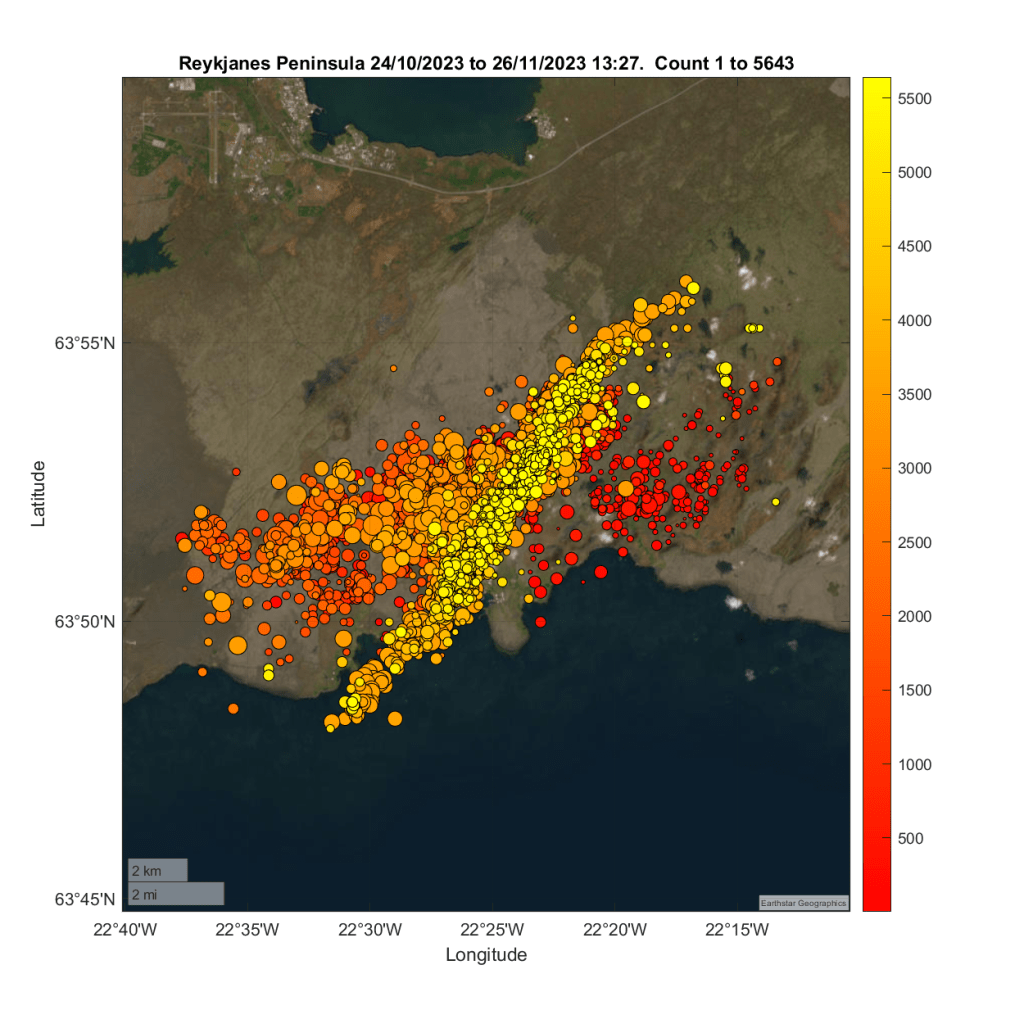
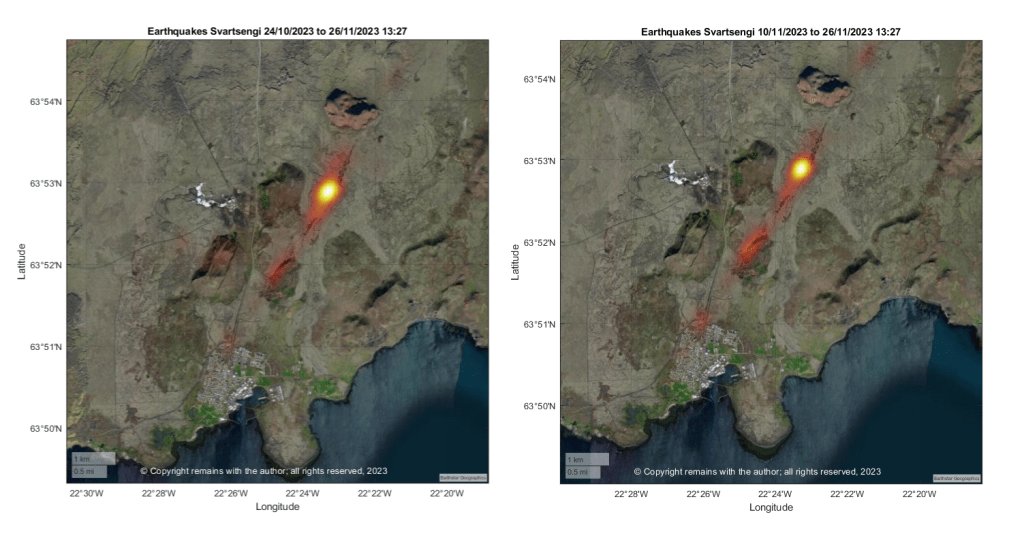
We have updated our earthquake plots from 24th October 2023 to 26th November 2023 13:27. Most activity is occurring along the magma intrusion, although it is focussed more on the area to the east of Sýlingarfell on Sundhnúksgigar.
Our plots show faults responding to magma, with decreasing seismic activity along the possible dyke formation since the reactivation of the graben. This may reflect the fact that magma has reached less brittle layers or most of the seismicity associated with the magma intrusion was in fact due to tearing of the crust in response to the inflation at Svartseni and environs, which, in turn, may or may not have allowed magma to flow into the formation. Time will tell.
Since our earthquake plots were compiled, there has been another small swarm to the east of Sýlingarfell.
We believe that this is the calm before the storm (an eruption) but when will the storm break?
For updates, please consult the relevant authorities, e.g IMO (link below).
Local volcanologist have said that the likelihood of an eruption in a matter of hours or days has increased. The aviation alert level has been increased to orange.
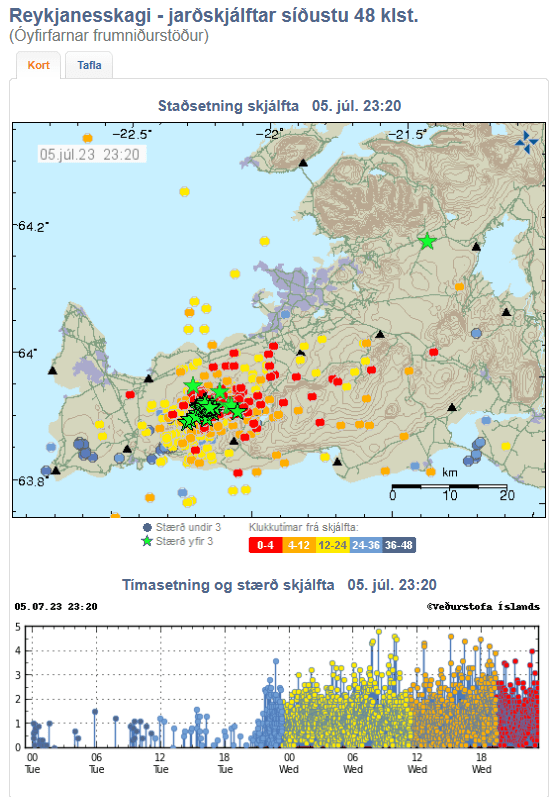
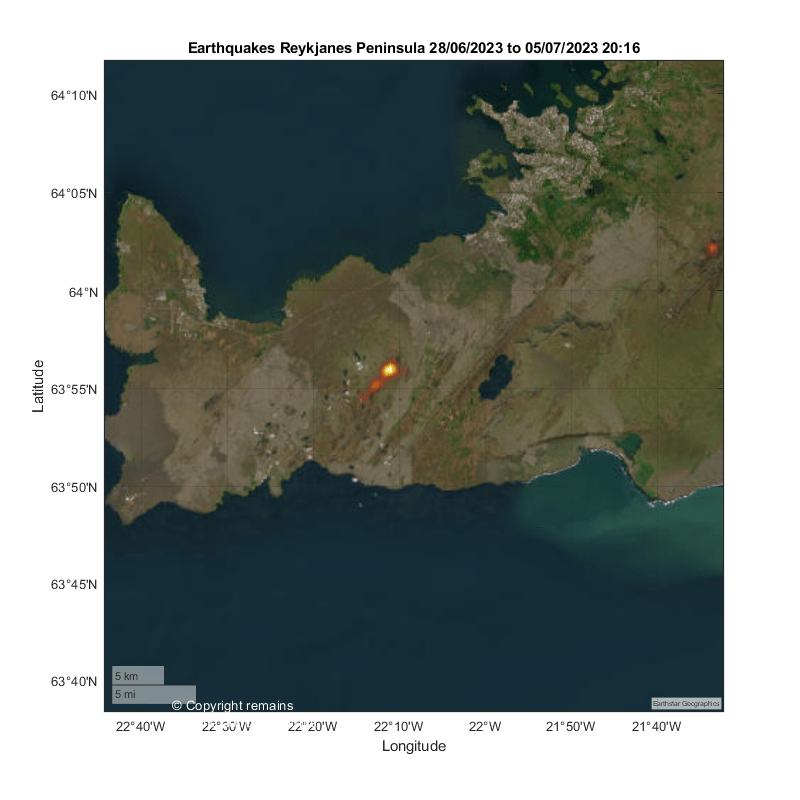
So we have plotted the published earthquakes from https://skjalftalisa.vedur.is from 28th June 2023 to 5th July 2023 20:16 to see what is going on.
It certainly looks like a magma intrusion close to the sites of the recent Fagradalsfjall eruptions. Time will tell whether or not and where lava emerges with the current swarm.
Our thanks go again to the Icelandic Met Office, IMO, https://www.vedur.is/, for the raw earthquake data. For updates, please visit IMO.
Update 02/08/2022, 20:39:46, Fagradalsfjall and Grímsvötn
The earthquake swarm near Fagradalsfjall continues unabated. The aviation code for Grímsvötn has been raised to yellow following increased seismic activity there.
Fagradalsfjall
At the time of writing IMO were reporting 3,000 earthquakes in the last 48 hours detected by the SIL Seismic Network.
Rising magma has caused some large triggered earthquakes where existing faults slip to accommodate the strain, the largest so far being 5.47 on day 2 of the swarm.
The Icelandic media are reporting that new satellite images taken on 1 August 2022 show magma movements located between Fagradalsfjall and Keilir. The magma intrusion is shallow at c. 1 km below the surface. The magma influx is close to double the rate of the previous eruption. The chances of an eruption near Fagradalsfjall in the coming days or weeks have therefore increased and are considered to be significant.
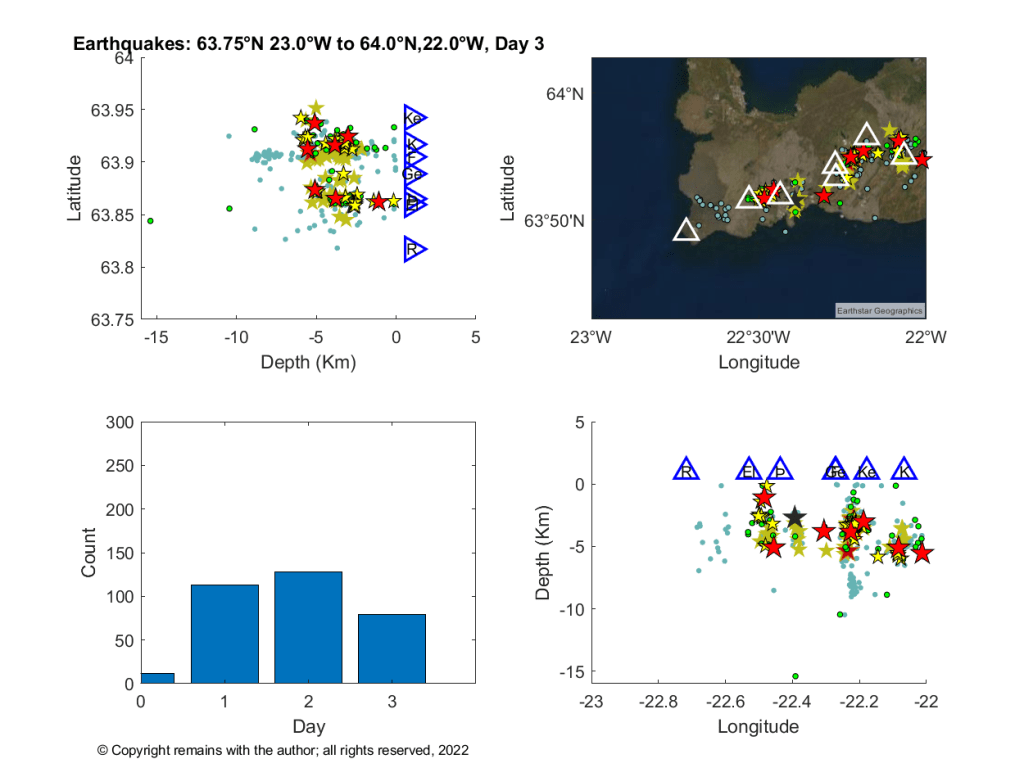
We have updated our earthquake plots using confirmed earthquake data from IMO’s Skjálfta-Lísa for the area 63.75°N, 23.0°W to 64.0°N, 22°W (the western Reykjanes Peninsula). The geodensity plot shows that most of the action is centred north east of Fagradalsfjall.
The image from IMO below shows the earthquake activity at Grímsvötn.
Fig 7: Screenshot of seismic activity at Grímsvötn today. Source: Vatnajökull (vedur.is)
Hopefully, eruptions are not like buses – wait for ages, then several show up together. On a more serious note, if Grímsvötn does erupt, ash may be problematic for Europe depending on the size of the eruption and the prevailing wind direction. A jökulhlaup caused by melting of the ice-cap is another hazard. An eruption near Fagradalsfjall is less likely to produce a lot of ash unless magma encounters an aquifer or other body of water; lava and any gas emissions depending on volume and location are likely hazards. Seismic activity remains a hazard for both; the public are advised of the risk of rockfall and landslip.
A large earthquake swarm started yesterday (30/07/2022) lunchtime north east of Fagradalsfjall, Iceland. At the time of writing, IMO had reported 1,597 earthquakes in the last 48 hours for the Reykjanes Peninsula from the SIL seismic network. This network automatically detects and locates earthquakes in Iceland and the surrounding offshore region. 199 of these earthquakes had been confirmed.
At the moment the swarm is being likened to the swarm in December 2021, which did not result in an eruption. The local authorities are warning of the increased risk of rockfall as a result of increased seismic activity.
Seismic activity continues in the Svartsengi area, extending to the Sundhnúkur crater row. The earthquakes in the vicinity of Mount Þorbjörn appear to be getting shallower today as at the time of writing.
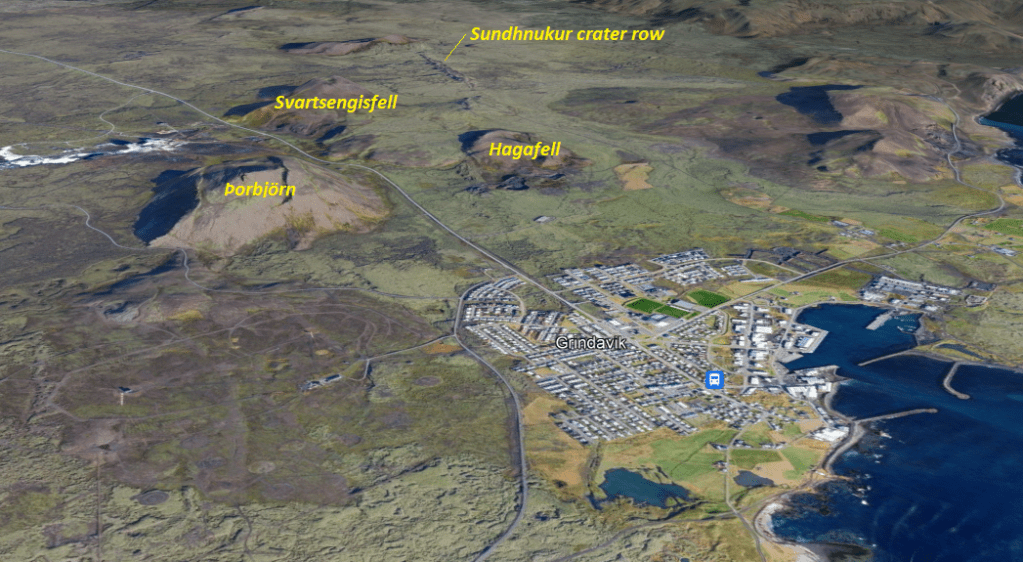
The Sundhnúkur crater row erupted c. 2,360 years ago. It is accredited with creating the Hópsnes/Þórkötlustaðanes land spit to the east of Grindavík.
Fig 8: Bird’s eye view of the Svartsengi area and Gringavík. Image from Google Earth; yellow text added by the author.
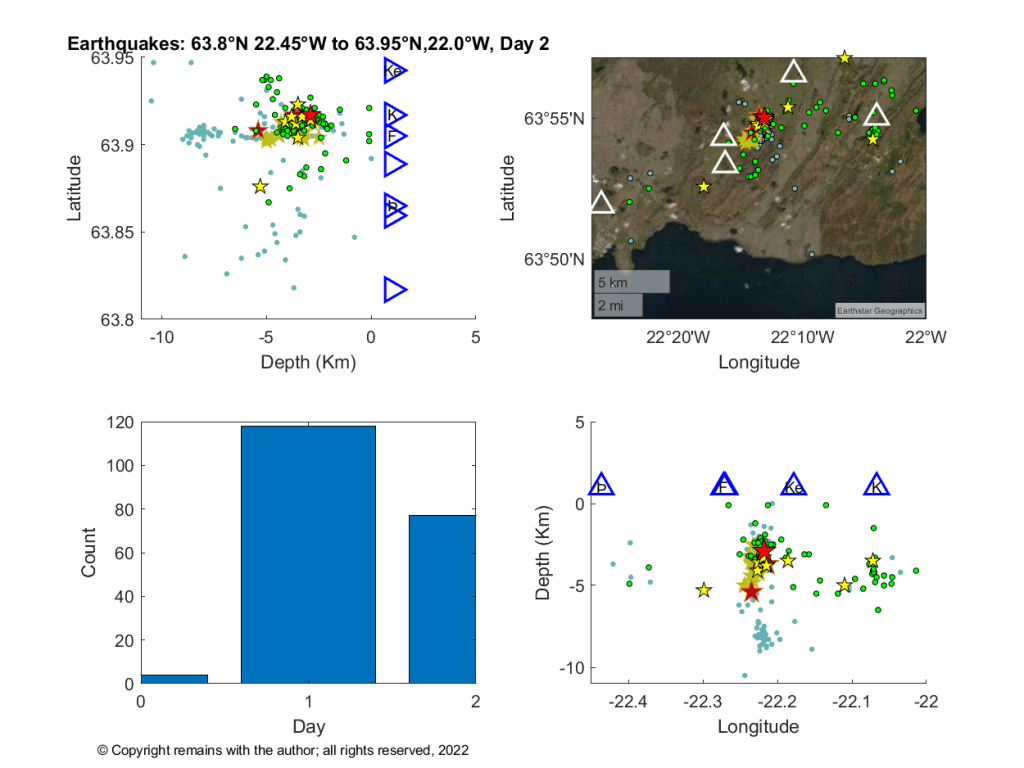
Here are our updated earthquake plots to 26th May 2022 15:06.
The following video shows both the geoscatter plots by day from 17th April 2022 to 26th May 2022 in the swarm for the western Reykjanes Peninsula, and the scatter plots for the same period for the area around Mount Þorbjörn.
While the earthquake plots are highly suggestive of more shallow magma ascent, we need to bear in mind that this area is on the plate boundary, the Mid Atlantic Ridge. Some of the seismic activity may be existing faults moving to accommodate the magma. Time will tell when and where magma emerges.
For the latest updates and alerts, please consult with IMO or the local authorities.
Armchair Volcanologist
Original Post 24th May 2022
The earthquake swarm that started on 17th April 2022 on the western Reykjanes Peninsula continues. Today we are plotting activity at the Svartsengi area near Mount Þorbjörn, which lies to the north of Grindavík, Iceland. We have used Mount Þorbjörn as the marker for Svartsengi in our plots.
Fig 1: Image cropped from one by Arian Zwegers of the Blue Lagoon looking towards Mount Þorbjörn. Published under CC-BY SA-2.0. Source: Þorbjörn (mountain) – Wikipedia
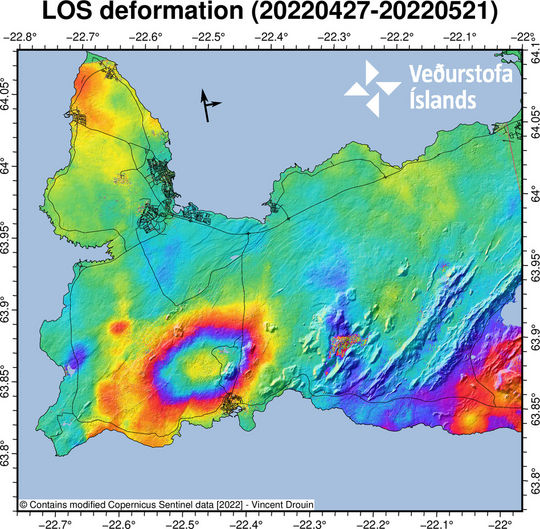
IMO reports that there has been significant uplift of 40mm to 45mm during the swarm in the area north of Grindavík indicative of magmatic activity.
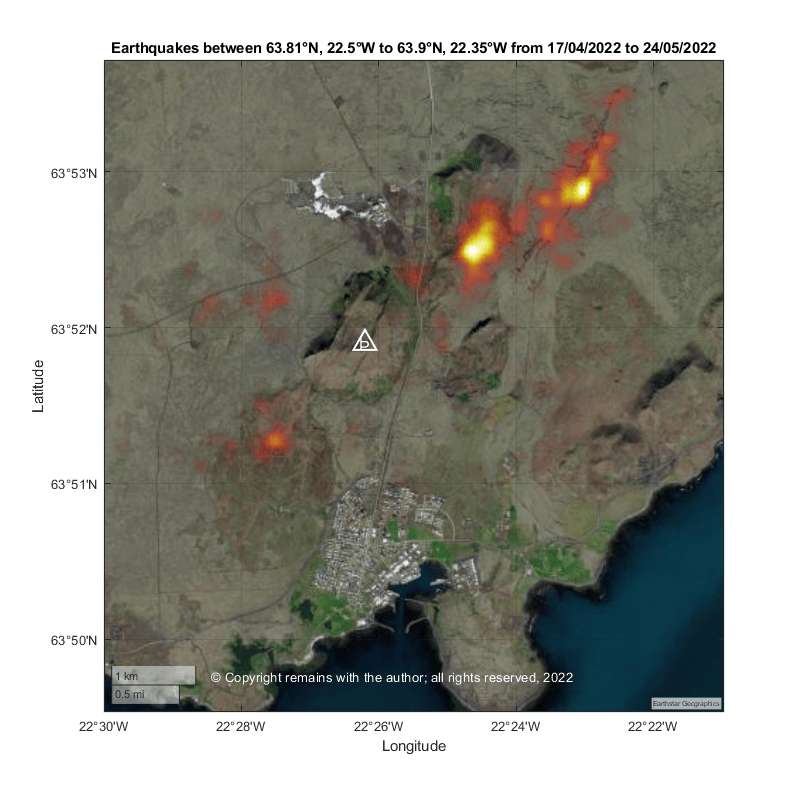
From a simpler scatter plot and a geodensity plot, we can see much of the activity has occurred near Mt Þorbjörn or Svartsengi in the area enclosed in the green box below.
An earthquake swarm started on the Reykjanes Peninsula on 17th April 2022 and is continuing at the time of writing. This swarm is part of a larger volcano-tectonic episode that started at the end of 2019 on the Reykjanes Peninsula, including the eruption at Geldingadalir.
Local volcanologists are reporting now that recent ground deformation of 3.5cm suggests a magma intrusion in the vicinity of Svartsengi, north of the town of Grindavík. Magma is believed to be pooling at a depth of c. 4km between Mount Þorbjörn and the Eldvörp crater row. This is an area which can produce large earthquakes of 6.5M. People are advised to avoid areas where landslip is likely.
Fig 1: Image cropped from a photo by Roman Zacharij of Grindavik, Iceland (Source: Wikimedia Commons, Public Domain).
We have updated our earthquake plots to show the swarm to date. Our plots exclude an earthquake occurring earlier today with a depth of 40.7km to keep the detail in the plots showing depth; the earthquake omitted is 19/05/2022, 00:11:14, 63.77°N , 22.75°W, 40.7km, 1 magnitude. Since we downloaded the data at 09:55 am today, there has been a 3.0 magnitude, 4.9 km NNE of Grindavík.
Our plots show possible doming in the vicinity of Mount Þorbjörn and the Svartsengi Volcanic System.
The earthquake swarm is continuing on São Jorge as we write, albeit it at a much lower intensity. The swarm is located on the Manadas Fissure system. INVOLCAN has sent a team to assist the local scientists (CIVISA and IVAR). CIVISA advised on 6 April 2022 that volcano-tectonic earthquakes had been detected suggesting magma movement at depth.
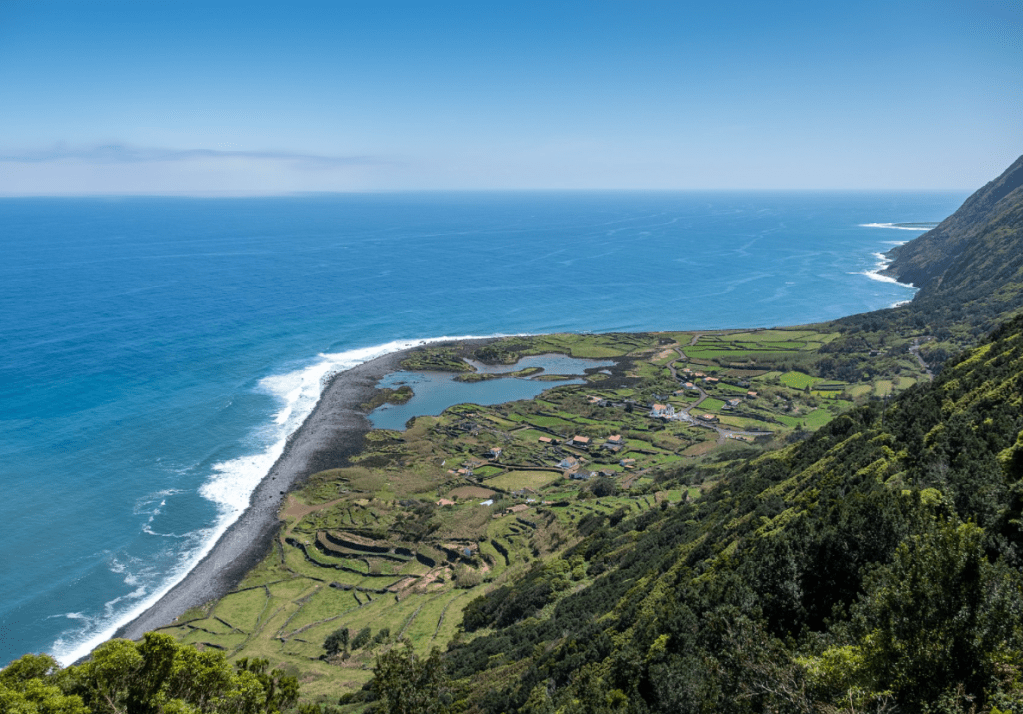
Fig 1: Image of Fajã dos Cubres, São Jorge, Azores, cropped from one by Jules Verne Times Two. Published under CC BY-SA 4.0 (Source: São Jorge Island – Wikipedia).
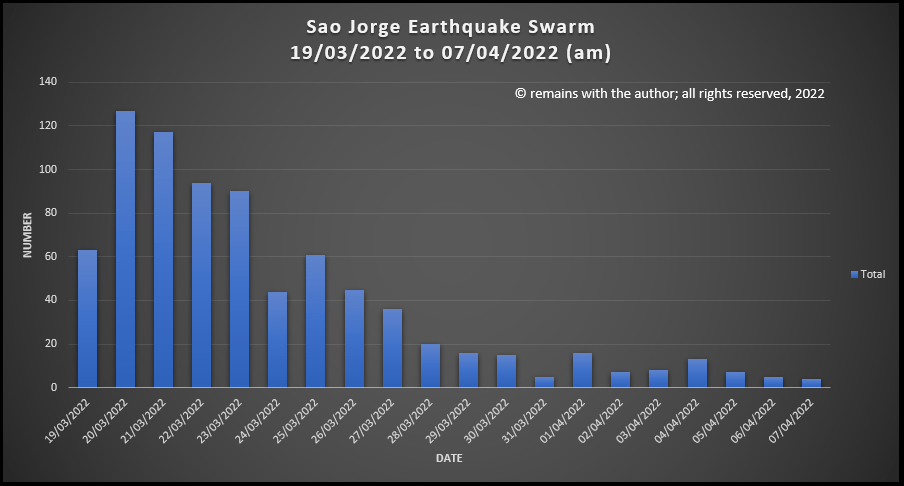
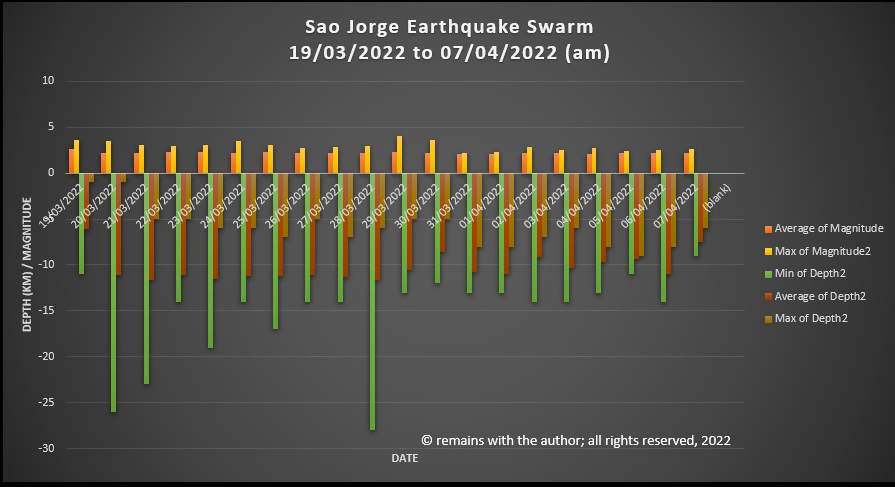
While we wait to see what transpires, here are some statistics.
Number of earthquakes ≥2.0 reported on IPMA’s site: 793
Maximum number: 127 on 20 March 2022
Minimum number: 5 on 31/03/2022 and 06/04/2022 (7/04/2022 is not a complete day)
Maximum magnitude: 4.0 (29/03/2022, 21:56:16, 38.686°N, 28.215°W, 10km)
Maximum depth: 26km on 20 March 2022 and 28km on 28 March 2022.
Good Afternoon! (Updated 30/03/2022 to include Background)
On 19 March 2022 an earthquake swarm started on São Jorge, an island in the Azores. The swarm is ongoing at the time of writing. By 28 March 2022, c.14,000 earthquakes had been recorded. This swarm is likely to be caused by a magmatic intrusion.
Fig 1: Image of Fajã dos Cubres, São Jorge, Azores, cropped from one by Jules Verne Times Two. Published under CC BY-SA 4.0 (Source: São Jorge Island – Wikipedia).
INVOLCAN have estimated that up to 20 million cubic meters of magma may have accumulated under São Jorge during the swarm, based on satellite measurements of ground deformation. CIVISA (Centro de Informação e Vigilância Sismovulcânica dos Açores) has raised the alert level to V4 (out of a scale to V6. V5 and V6 are in eruption, based on size of the eruption).
There are four likely outcomes:
An eruption occurs in the next few days to weeks, possibly with little warning.
A larger earthquake occurs alongside changes in the magma intrusion leading to an eruption or stalling of the intrusion.
The current swarm and deformation end without eruption. Future swarms and deformation lead to an eruption.
The activity ceases and the intrusion cools with no further activity.
Locals have been advised to prepare to evacuate due to the risk of eruption or larger earthquakes. Our thoughts are with them.
Let’s take a look at what is going on underground. We have downloaded the earthquake data reported by The Portuguese Institute for Sea and Atmosphere, I. P. (Source: IPMA – Seismic map). This shows earthquakes ≥2.0 magnitude. At the time of our download c. 840 earthquakes ≥2.0 had been recorded for São Jorge from 19/03/2022.
Our video shows geoscatter plots by day, showing the north-westward migration of the swarm, and 3D rotating scatter plots.
Around 8,400 people live on the island in settlements around the coast. Transport links have historical been by sea as land transport was inhibited by the harsh volcanic terrain. The economy is reliant on dairy farming, including the export of São Jorge cheese, fishing and some cereals, vineyards and local vegetables. The opening of an airport in 1982 led to the expansion of the export of cheese, farming and small crafts.
São Jorge Island, itself, is 55km long and 6km wide volcanic ridge in the Azores Archipelago. The Azores are located at a triple junction between the North American, Eurasian and Nubian Plates; the Mid Atlantic Ridge forms the eastern boundary of the North American Plate. The Azores Plateau is considered to be a large igneous province generated from a plume interacting with the Mid Atlantic Ridge between 20 and 7 million years ago. Fissural volcanic activity arising from the interaction and tectonics created the islands.
There are four known centres of volcanic activity on São Jorge: the São João area on the south eastern end of the island; the Topo Volcanic Complex, occupying most of the eastern side of the island; the Rosais Volcanic Complex, with basalt and andesites; and Manadas Volcanic Complex on the west side of the island. The earliest known subaerial lava is alkaline enriched c.1.32 – c.1.21 million years old from deep partial melting of an enriched garnet peridotite mantle source. This is located at the south east end of the island at São João with a NW-SE to NNW-SSE direction oblique to the current WNW -ESE axis of the island. The period includes at least thee episodes of magma differentiation from alkaline basalts to mugearites in a shallow magma reservoir. Subaerial activity resumed c. 750,000 years ago at the Topo Volcanic Complex, with several overlapping episodes migrating westward along the axis of the island. Activity in the western side of the island started c. 731,000 years ago. The lavas generated 750,000 years ago and subsequently were also generated from an enriched mantle source. The different phases of subaerial growth are attributed to different episodes of deformation reopening the magma feeding system. It is possible that submarine activity occurred during the period of apparent quiescence.
GVP lists 11 confirmed Holocene eruptions for São Jorge, of which one is VEI 3 (1580), one is VEI 2 (1800) and one is VEI 1 (1808). Three are submarine: 1964, off the SW coast; 1902, off Ponta do Topo; and, 1800, also off Ponto do Topo. The eruptions in 1580 and 1808 caused widespread damage. In the 1580 eruption, magma ascended from 23km or more, ponded at 16km and then erupted in three lava flows along the Ribeira da Almeida, Queimada and between Ribeiro do Nabo and the beach of Cruzes; ten people were killed. In the Urzelina eruption in 1808 , fractionated residual ponded magma from the 1580 eruption emerged as andesite-basaltic lava to flow south west of Pico do Pedro to Urzelina. This eruption caused gases and chloric, sulfuric and carboxylic acid vapours to be emitted from the Manadas Ridge, which along with eight large earthquakes, caused significant damage to property and farmland. Eight people were killed in the 1808 eruption.
The island and surrounding area is heavily faulted. Submarine fractures between the São Jorge and Pico have resulted in large damaging earthquakes. In 1757, an earthquake centred in Fajã dos Vimes resulted in destruction of property in Manadas and the death of c. 20% of its population (1,000 people).
A series of seismic swarms in February 1964 associated with an offshore eruption 6.5km northwest of Velas led to large earthquakes which destroyed most property in the western side of the island. The eruption was preceded by seismic activity starting tremors felt on 21 August 1963, followed by a swarm which lasted from mid-December 1963 to January 1964 and the cutting of submarine cables on 29 January and 1 February 1964. Volcanic tremors started on 14 February 1964, resulting in a large damaging earthquake on 15 February after a lull in activity. The earthquakes initially impacted Urzelina, Manadas, San António and Norte Grand before migrating north west to include Rosais, Beira, Velas, and Santa Amaro. Low intensity tremors occurred in the period before the next large events on 21 February 1964 when three large tremors caused more damage; this phase ended on 24 February 1964. Earthquake foci near the centre of the island had depths of 5km, whereas those near Velas were 10-20km in depth. Neighbouring islands also experienced large tremors. The event ended on 25 February 1964. 5,000 people were evacuated from the island during this time, not an easy task as storms in the channel between Terceira, Pico an b d Faial hampered relief efforts, along with lack of planning. This time with monitoring the authorities are better prepared.
Time will tell when the next eruption occurs on São Jorge. In the meantime, here’s hoping that the disruption to local residents is short-lived.
Anthony Hildebrand, Pedro Madureira, Fernando Ornelas Marques, Inês Cruz, Bernard Henry, Pedro Silva, “Multi-stage evolution of a subaerial volcanic ridge over the last 1.3 Myr: S. Jorge Island, Azores Triple Junction”, Earth and Planetary Science Letters, Volume 273, Issues 3-4, 15 September 2008, Pages 289 -298.
Anthony Hildebrand, Dominique Weis, Pedro Madueira, Fernando Ornelas Marques, “Recent plate re-organisation at the Azores Triple Junction: Evidence from combined geochemical and geochronological data on Faial, S. Jorge and Terceira volcanic islands”, Lithos, 210-211, (2014), 27-39.
Vittorio Zanon, Fátima Vieros, “A multi-method re-evaluation of the volcanic events during 1580 CE and 1808 eruptions at São Jorge Island (Azores Archipelago, Portugal), Journal of Volcanology and Geothermal Research, Volume 373, 15 March 2019, Pages 51–67.
At the end of 2021 a large earthquake swarm started to the west of the Ok shield volcano in Iceland. At the time of writing the swarm is ongoing. The Icelandic Meteorological Office (IMO) reported on their Icelandic site on 1st February 2022 that there is no evidence of magma intrusion.
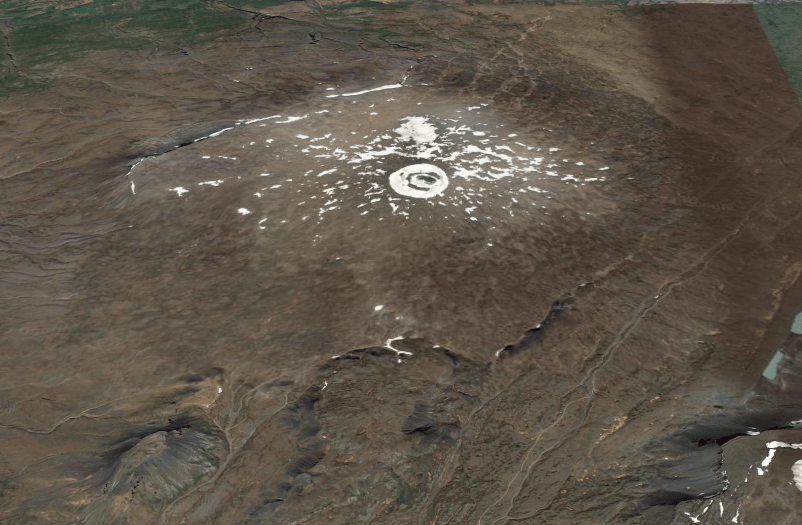
Fig 1: Ok volcano looking northwards, with a small tuya in the foreground. Image from Google Earth. The remnant of the Okjökull glacier is visible with a small lake in its centre at the summit of the volcano. The current swarm is to the west of the volcano.
The swarm is occurring west of Ok in Borgarfjörður in a low temperature region outside the main volcanic and rift area. The earthquakes are thought to be rifting caused by horizontal tension in the crust, here of the North American Plate. The swarm is the largest to date in the region and is continuing at the time of writing. So off we trotted to plot the earthquakes.
What’s in the Area?
We looked at the area 64.2°N, 19.2°W to 65.3°N, 21.8°W which contains the Langjökull ice cap, two Holocene volcanic systems and several Pleistocene volcanic systems.
The Langjökull ice cap is the second largest ice cap in Iceland located at the northern end of the Western Volcanic Zone (WVZ). The WVZ is a slow spreading rift that forms the western boundary of the south Iceland microplate. Sinton et al.’s study in 2005 showed that there is no evidence for the decline in the WVZ in the Holocene; the shield eruptions are long duration with low effusion rates fed by magma from the mantle. c. 40 eruptive units have been located in the WVZ; we are focussing on those in the Langjökull area in the northern part of the zone.
Holocene Volcanoes
Volcano
Latitude
Longitude
Last Known Eruption
Dominant Rock Type
Prestahnúkur
64.583
-20.666
3350 BCE
Basalt / Picro-Basalt
Langjökull
64.85
-19.7
950 CE
Basalt / Picro-Basalt
Prestahnúkur is west of the Geitlandsjökull glacier in the south west part of Langjökull. It is a 90 km ling 15 km wide fissure system with a rhyolitic peak, on a Pleistocene basaltic plateau. The central volcano is a hyaloclastite massif; it has shield forming olivine tholeiite basaltic effusive eruptions, with some rhyolite. The fissures extend southwest-north east, reaching under the Þórisjökull and Geitlandsjökull glaciers. There is a parallel sub swarm of tuyas 4–6 km west of the main swarm. The last significant eruption of the central volcano was in the Pleistocene and on the fissures c.900 CE. The Holocene eruptions occurred on rift zones to the north and south west of the volcano.
Langjökull comprises the Hveravellir central volcano and a 100 km long and 20 km wide fissure system. A 600m thick ice cap partly covers the system. The central volcano is another hyaloclastic massif with a silicic component. It has had six recorded Holocene eruptions: 2 VEI 2, Hallmundahraun 950 CE and Kjalhraun 5850 BCE; and, 4 VEI 0, Lambahraun 2050 BCE, Krákshraun 2550 BCE, Strytuhraun 3550 BCE and Leggjarbrjótur 8600 BCE. The Hallmundahraun lava flow covers 240 km2 . Kjalhraun is a shield which erupted 11km3 lava 7,800 years ago. The dominant magmas are olivine tholeiite basalt.
Skjaldbreiður is a shield volcano that lies in the southern part of the Langjökull system. It erupted 13km3 of basaltic lava in the early Holocene. The lava flows formed the basin of Þingvallavatn and Þingvellir, where Iceland’s parliament, the Alþing, was founded in 930.
Pleistocene Volcanoes
Volcano
Latitude
Longitude
Primary Volcano Type
Geysir
64.32
-20.3
Stratovolcano
Hlöðufell
64.93
-20.53
Tuya
Þórisjökull
64.53
-20.7
Subglacial
Ok
64.62
-20.88
Shield
Eiríksjökull
64.77
-20.4
Tuya
Hrútfell
64.73
-19.72
Tuya
Bláfell
64.492
-19.87
Tuya
Hreppar
64.42
-19.5
Fissure vent(s)
The Geysir geothermal area lies in the Haukadalur basin near the southern end of the Langjökull system. Earthquake activity in June 2000 temporarily activated the normally somnolent Grand Geysir
Eiríksjökull is Iceland’s largest tuya.
Ok erupted during interglacials in the Pleistocene. It used to have a summit glacier, the Okjökull, whose disappearance has been attributed to climate change. Local volcanologists have reminded us that the ash from the 2010 Eyjafjalljökull eruption would have contributed to ice loss. “Not Ok” was a documentary about the lost glacier. Ok overlies some of the tuyas of the sub swarm to the west of Prestahnúkur.
Hreppar is two NE-SW trending ridges which extend from the rhyolitic Kerlingarfjöll volcano located SW of the Hofsjökull ice cap.
Recent Seismic Activity
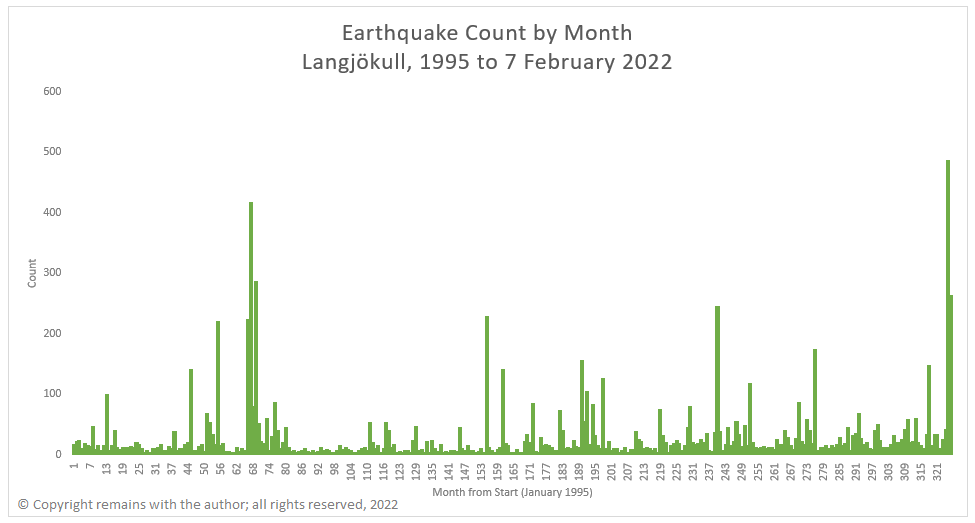
As we have extended our database of Icelandic earthquakes back to 1995, we have plotted the earthquakes for the period from 1995 to 7th February 2022 for the area 64.2°N 19.2°W to 65.3°N 21.8°W.
There is a relatively low level of background activity compared to the other volcanic regions of Iceland. However, the following months each saw more than 200 earthquakes: 55 (July 1999) near Þórisjökull and Prestahnúkur , 66 (June 2000) near Geysir, 67 (July 2000) near Geysir, 69 (September 2000) near Geysir, 155 (November 2007) near Hveravellir and Geysir, 240 (December 2014) near Geysir, 325 (January 2022) near Ok and 326 (February 2022) near Ok. Note: that February 2022 is only one week.
We noted six warms to the west of Ok, including the current swarm. They appear to be aligned along a rift / fissure. The current swarm near Ok is one of the largest in the database to date.
It’s not clear from the plots, themselves, whether or not there is any magma movement associated with the current swarm or, indeed, any of the other activity identified. The size of the current swarm indicates that something may be going on near Ok. Only time will tell if volcanic activity will ensue. In the mean time, the plots do shed some light on the activity along rifts associated with plate seperation.
Icelandic Meteorological Office: www.vedur.is for raw earthquake data
Kristján Sæmundsson (Iceland GeoSurvey) (2019). Prestahnúkur. In: Oladottir, B., Larsen, G. & Guðmundsson, M. T. Catalogue of Icelandic Volcanoes. IMO, UI and CPD-NCIP. Retrieved from http://icelandicvolcanoes.is/?volcano=PRE
Guðrún Larsen and Magnús T. Guðmundsson (Institute of Earth Sciences – Nordvulk, University of Iceland) (2016): Langjökull, Hveravellir. n: Oladottir, B., Larsen, G. & Guðmundsson, M. T. Catalogue of Icelandic Volcanoes. IMO, UI and CPD-NCIP. Retrieved from http://icelandicvolcanoes.is/?volcano=LAN
John Sinton, Karl Grönvold, Kristján Sæmundsson, “Postglacial eruptive history of the Western Volcanic Zone, Iceland”, Geochemistry, Geophysics, Geosystems, AGU, Volume 6, Issue 12, December 2005, https://doi.org/10.1029/2005GC001021
For the Pleistocene volcanoes we consulted Wikipedia and the Smithsonian Institution – Global Volcanism (www.volcano.si.edu/)
Seismic activity at Fagradalsfjall, Iceland, has remained low. The recent swarm is now considered over. The aviation code has been lowered to yellow as a result.


#/media/File:Blue_Lagoon_(6818651629).jpg)
.JPG)
_julesvernex2.jpg)