Tag Archives: earthquakes

Mount Fuji (Fujisan)

Taking a break from eruptions and seismic activity in Iceland, and disasters, in this article, we are taking a look at subduction zone volcanism, with Mount Fuji as our example.

Mount Fuji is stratovolcano located 100km south west of Tokyo in Honshu, Japan, in the Fuji-Hakone national park. The main crater is 780 m diameter at the top, 100 -130 m diameter at its base, and 240 m deep. The highest point, the Kengamine Peak, 3776 m, was built during the Kengamine eruption c.2,300 years ago, the last known summit eruption.  The most recent eruption was the 1707 Hoei eruption.

Fujisan is one of Japan’s three holy mountains, the others being Mount Tate and Mount Haku. It was viewed as a living god and a bridge between Earth and Heaven by ancient peoples.  In the Shinto religion, Konohanasakuya-hime is a goddess representing fire and volcanoes.  There are shrines to her at the summit and foot of the volcano to calm volcanic fire. Buddists climb the volcano for spiritual meditation and enlightenment. 

Mount Fuji is a very popular tourist destination due to its natural beauty and climbing trails.  It was declared a world cultural site in 2013.

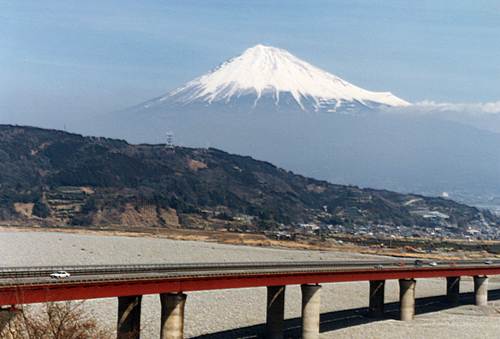
Fig 1: Photo by Ichio Moriya (Kanazawa University) of Fujisan with the Tokyo-Osaka highway. Hoeisan, the smaller cone on the SE flank (to the right), is a remant of Kofuji (Old Fuji). Source: Global Volcanism Program | Volcano Photo Collection — Image GVP-08934. This image is made available under the Creative Commons BY-NC 4.0 license terms.

Tokyo, the capital and economic centre of Japan and a major international finance centre, has a population of 14 million; the Greater Tokyo area has one of 33 million.  According to Wikipedia, in 2022, Tokyo’s gross regional product was US$887.9 billion, accounting for 21.2% of the country’s total economic output.  Of the total output, wholesale and retail was 21.5,  real estate (13.5%), professional, scientific and technical (12.2%), information and communications (11.7%), finance and insurance (7.6%), manufacturing (7.0%), and healthcare (6.7%). Agriculture, forestry and fishery, and mining combined accounted for less than 0.1% of the economic output. Lying near the boundary of three tectonic plates (the Okhotsk, Amur Philippine Sea Plates) and also on the Kantō Plain, Tokyo is at risk from earthquake and volcanic activity, and also floods, especially when typhoon rains swell the many rivers on the Plain.

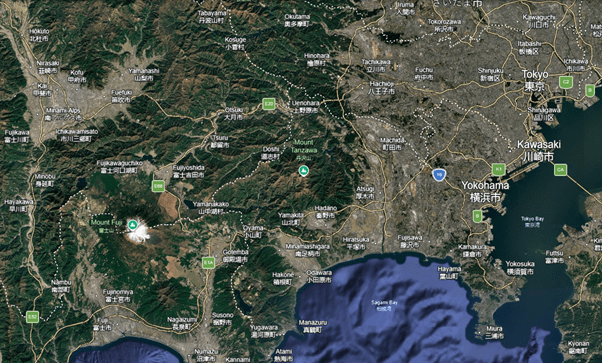
Fig 2: Screenshot from Google Earth (https://earth.google.com/) showing built up areas near Mount Fuji.  Mount Fuji is the snow capped volcano in the left of the image.  Eagle eyed readers will spot that Mount Fuji is not the only volcano in the image.

While Tokyo is the largest conurbation near Mount Fuji, there are several heavily built up areas nearby, including the cities of Yokohama, Fujinomiya, Gotemba, Fujiyoshida, Fuji City, Fujikawaguchiko, Numazu, Kofu, Hakone and Odawara. The Smithsonian Institute National Museum of Natural History Global Volcanism Program (GVP) notes that a population of nearly 1 million live within 30km of the summit and just over 25 million live within 100 km.  At the time of writing, Google’s AI gives a figure of between 30 – 37 million for people living within 100km of the summit (multiple searches gave different answers but all were in this ball park).

Hazards

The main hazards posed by Mount Fuji, itself, which may cause fatalities and injuries, damage health, livestock, crops, buildings, infrastructure and communications are:

  • Eruptive products: ash, cinders, lapilli and lava. 
  • Lahars and flooding from rains, which may include typhoon rains.
  • Debris avalanche flows caused by volcanic or seismic activity.
  • Differing eruptive styles complicating predictions

Other local geological hazards include large destructive earthquakes as the region is tectonically very active. 
It is worth noting that because Mount Fuji is close to densely populated areas, including the capital the site of government and a large international financial market), the impact of any large future eruption could be not only be nationally but also globally significant.

The volcano is closely monitored by several agencies coordinated by the Japan Meteorological Agency.

Evolution

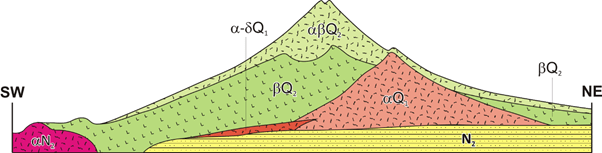
Fig 3: Image by TTL2698 of the geological cross-section of Fuji. Key: N2 (yellow) = Tertiary sedimentary rocks; αN (dark pink)  = Tertiary volcanic rocks; αQ1  (orange) = Komitake volcano; α-δQ1 (dark orange) = Ashitaka volcano; βQ2 (green) = Older Fuji volcano; αβQ2 (light green) = Younger Fuji volcano. Source: Geological cross-section of Fuji.png – Wikimedia Commons, published under CC BY-SA 3.0.

Mount Fuji last erupted in 1707-1708 with a large explosive eruption of VEI 5, preceded 49 days earlier by a the magnitude 8.7 Hoei earthquake on the Nankai Trough, a 900 km trough off the southern coast of Honshu where the Philippine Sea Plate subducts under the Amur and Okinawa Plates.  The eruption was Plinian, occurring on the SE flank of the volcano. Erupted products were mostly pyroclastic, starting with dacite pumice, followed by andesitic scoria, and, finally, basaltic scoria.  Ash fall several centimetres thick reached Edo (now Tokyo).  The ashfall damaged crops in the region causing widespread starvation.  Rainfall combined with ash deposits caused multiple lahars and flooding.  Most fatalities were caused by flooding, landslides and famine.  It took nearly 100 years for the region to recover.
While the last eruption was explosive, Mount Fuji has produced effusive eruptions in its past.  Studies of lavas show that Mount Fuji overlies older volcanoes.

Sen-komitake is an andesitic core discovered in 2004.  Andesitic activity started here 270,000 years ago ending 160,000 years ago.

Komitake – Fuji is a basaltic layer several hundred thousand years old.  Large basaltic lava flows started here started 700,000 years ago, ending 100,000 years ago, .

Old Fuji formed over Komitake – Fuji between100,000 to 17,000 years ago, the Hoshiyama stage.  Activity in this period is explosive with Plinian or sub-Plinian eruptions, dominated by ash clouds, heavy pyroclastic flows, mudflows, and massive scoria fall. Komitake – Fuji was nearly completely covered. Around 18,000 BC the edifice collapsed with a large debris avalanche flow to the southwest, forming the Tanukiko debris avalanche deposit.  This was followed by another collapse eastwards c. 12,000 BC forming the Umafusegawa debris avalanche deposit.

New Fuji formed over old Fuji during the Fujinomiya stage from 15,000 BC to 6,000 BC. The new edifice was constructed within the Tanukiko avalanche scar.  The eruptive style switched back to large effusive basaltic lava flows, including the Mishima, Obuchi and Saruhashi lava flows.  The Mishima lava flow is estimated to have a volume of 4.3 km and the Obuchi 1.1 km3.  The Saruhashi lava flow is the longest, extending more that 40 km from the summit.

From 6,000 BC to 3,600 BC, the Subashiri – a stage, activity declined considerably.  Only Fuji black soil round the volcano remains.

The Subashiri – b stage, from 3,600 BC to 1,700 BC, marked an increase in activity during which the current cone was built from thin basaltic lava flows up to 2,100 BC.  Effusive flank eruptions also occurred during this period.

The Subashi – c stage, 1,700 BC to 300 BC was marked by initial explosive basaltic Plinian or sub-Plinian eruptions from the summit, 1,700 BC to 1,300 BC, flowed by scoria cone forming flank eruptions, 1,300 BC to 1,000 BC,  The Gotemba debris avalanche flow occurred c.900 BC  removing the remains of the eastern flank of the Hoshiyama stage edifice.  Explosive summit basaltic eruptions became dominant again.

The Subashi – d stage runs from 300 BC to present. This stage is marked by frequent basaltic flank eruptions within 13.5 km of the summit. The last summit eruption, the Kengamine eruption, occurred c.2,300 years ago, after which activity has switched to flank eruptions, notably the Yufune 2 eruption 2,000-2,2000 years ago.  Both eruptions produced highly fluid basaltic lavas that generated extensive scoria fallouts. 

 The two most recent largest eruptions are the 864 AD – 866 AD Jogan eruption and also the 1707 Hoei eruption that we have already mentioned.  The Jogan eruption was a VEI 3, occurring on the northwest flank near Nagaoyama, discharging 1.5 km3 of basaltic Aokigahara Lava Flow. The lava flowed into Lake Senoumi, splitting it into two smaller lakes, Lake Saiko and Lake Shōjiko.  Ash and lapilli emitted from the summit, with fallout reaching as far as Edo Bay and Kai Province.  The eruption buried villages, destroyed homes and caused a number of fatalities.

Magmas

Mount Fuji lies on the north end of the Izu-Bonin-Mariana Arc, near the junction with the South Western Japan Arc and North Eastern Japan Arc.  Unlike other arc volcanoes with intermediate and felsic lavas, basaltic lavas dominate.

It is thought that Mount Fuji has two magma reservoirs: the first, a basaltic one, with a depth of c.20 km at the bottom of the granitic middle crust of the Philippine Sea Plate, and the second, a more silicic one with a depth of  8 -9 km.  The lower magma reservoir is deeper than that of other arc volcanoes whose reservoirs tend to be less than 10 km deep.

Analysis of the chemical composition of Mount Fuji’s lavas showed that new activity in the Subashiri period was driven be an injection of basaltic magma 5,600 years ago.  The eruptive style was stable with effusive eruptions until 3,450 years ago when the style changed from effusive to explosive.  The transition from effusive to explosive is thought to be driven by a change in the water content of the parental magmas.

Tectonic Setting

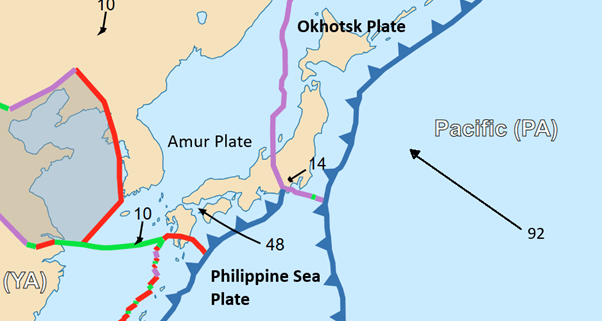
Mount Fuji lies near the triple junction of the Philippine Sea Plate, Amur Plate and Okhotsk Plates. The Philippine Sea Plate subducts under the Amur Plate.  The Pacific Plate also subducts under the region. 

Fig 4: Plates near Mount Fuji.  Image extracted from File:Tectonic plates boundaries detailed-en.svg – Wikimedia Commons, published under CC BY-SA 4.0.  Plate names in black added by the author where the screenshot has excluded them.

Seismic Activity

Our focus here is tectonic activity in the region, not magmatic activity (we do not have access to the data for the latter).  We looked at the area 39°N,133.5°E to 30°N, 147°E from 1st January 2006 to 24th August 2026. 

Our plots show the dominance of the subduction of the Pacific Plate in the area. In the geoscatter plot we can also just about see the triple junction near Mount Fuji delineated in shallow (purple) earthquakes.

What we cannot see clearly in any of our plots is the subduction of the Philippine Sea Plate; however, this is visible in our plot of the area to the west, 39.63°N, 153.14°E to 28.60°N, 124.75°E, where we can see subduction under the Okinawa Plate (Shallow 6.8 magnitude Earthquake South of Kumamoto, Japan, 28th July 2026). This implies that the Philippine Sea Plate may not subduct under the Amur Plate but has a different type of boundary, which may. or may not. contribute to the basaltic magmas of Mount Fuji.

Fig 5: Geoscatter plot by the author of earthquakes between 39°N,133.5°E and 30°N, 147°E from 1st January 2006 to 24th August 2026.  Colour of earthquakes with magnitude less than 6 denotes depth: purple, 0-33km, blue 33-70km, green 70-150km, yellow, 150-300km. orange, 300-500km, red ≥500km. Yellow stars are earthquakes between 6.0 and 7.0 magnitude.  Red stars are earthquakes with magnitude ≥ 7.0. The cyan triangle is the rough location of Mount Fuji.  © Copyright remains with the author, all rights reserved, 2026.
Fig 6: Scatter plot by the author of earthquakes between 39°N,133.5°E and 30°N, 147°E from 1st January 2006 to 24th August 2026.  Colour of earthquakes with magnitude less than 6 denotes depth: purple, 0-33km, blue 33-70km, green 70-150km, yellow, 150-300km. orange, 300-500km, red ≥500km. Yellow stars are earthquakes between 6.0 and 7.0 magnitude.  Red stars are earthquakes with magnitude ≥ 7.0. The cyan triangle is the rough location of Mount Fuji. © Copyright remains with the author, all rights reserved, 2026.

Armchair Volcanologist

© Copyright remains with the author, all rights reserved, 2026.

Sources

USGS for raw earthquake data: Earthquake Hazards Program | U.S. Geological Survey

Yamamoto, T., Nakano, S. & Ishizuka, Y. Temporal variations of magma composition, eruption style and rate at Fuji Volcano, Japan. Earth Planets Space 73, 169 (2021). https://doi.org/10.1186/s40623-021-01505-1

Yosuke Aokia, Kae Tsunematsu , Mitsuhiro Yoshimoto, Recent progress of geophysical and geological studies of Mt. Fuji Volcano, Japan, Earth-Science Reviews

Volume 194, July 2019, Pages 264-282. https://doi.org/10.1016/j.earscirev.2019.05.003

Yamamoto, T., Nakada, S., Extreme Volcanic Risks 2: Mount Fuji, Volcanic Hazards, Risks and Disasters, 2015, Chapter 14, ISBN 978-0-12-396453-3

Wikipedia: Mount Fuji – Wikipedia

Global Volcanism Program, 2026. Fujisan (283030) in [Database] Volcanoes of the World (v. 5.4.0; 7 Aug 2026). Distributed by Smithsonian Institution, compiled by Venzke, E. https://doi.org/10.5479/si.GVP.VOTW5-2026.5.4 . Specific link to Fujisan: Global Volcanism Program | Fujisan

Wikipedia: Tokyo – Wikipedia

Svartsengi – Not Yet, 20th August 2026

At the time of writing, Svartsengi has not erupted since the last eruption which ended on 5th August 2025.  The Icelandic Meteorological Office issued an update on 18th August 2026 stating that (we quote):

  • Land uplift at Svartsengi continues at a slow but steady rate
  • Seismic activity remains low
  • The hazard assessment remains unchanged

Land uplift and magma accumulation are continuing at Svartsengi. The development remains slow but steady. The latest model calculations indicate that approximately 29.1 million cubic metres of magma have accumulated beneath Svartsengi since the beginning of the last eruption in July 2025. The uncertainty range is between 28.3 and 29.9 million cubic metres.

As magma continues to accumulate and pressure increases within the system, the most likely scenario is that a magma intrusion will propagate from Svartsengi into the Sundhnúkur crater row. This could lead to a volcanic eruption. As before, the warning time could be short. Previous eruptions have had warning times ranging from approximately 20 minutes to just over four hours.”

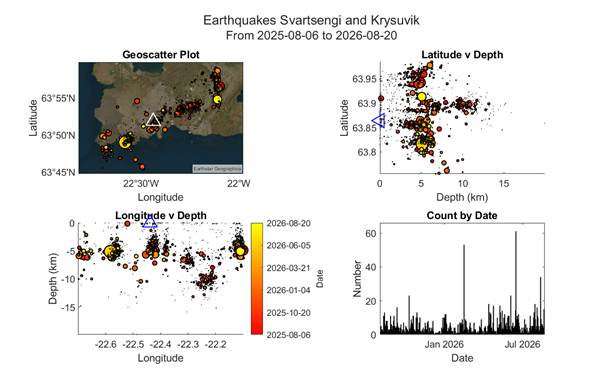
We have updated our earthquake plots from 6th August 2025 to earlier today, 20th August 2026, looking at the area 63.746°N,22.7°W to 63.996°N, 22.1°W. From our plots, we can see that most earthquakes are occurring in or just above the top of the crust.  There is more shallower activity under Svartsengi, itself.  As there is an aseismic zone up to c.2km depth, we cannot easily predict based on seismic activity alone  if, or when, magma will reach the surface.

Fig 1: Geoscatter and scatter plots by the author of earthquakes from 6th August 2025 20th August 2026, looking at the area63.746°N,22.7°W to 63.996°N, 22.1°W.  Colour denotes time, size denotes magnitude and the white / blue triangle shows the location of the Svartsengi volcanic system. © Copyright remains with the author; all rights reserved, 2026.

Armchair Volcanologist

© Copyright remains with the author; all rights reserved, 2026.

Source for the raw earthquake data and the update: Icelandic Meteorological Office

Shallow 6.8 magnitude Earthquake South of Kumamoto, Japan, 28th July 2026

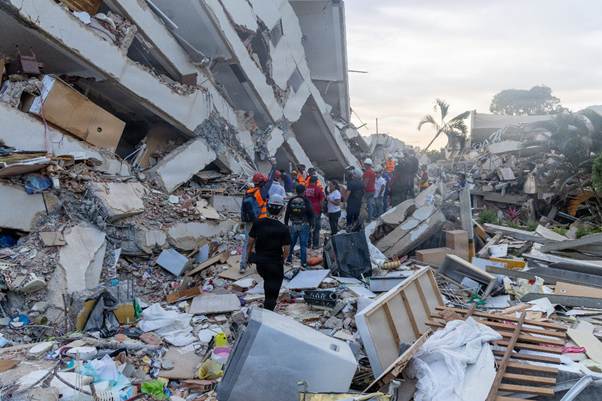
On 28th July 2026 a 7.1 magnitude (USGS 6.8 magnitude) earthquake struck Uto, south of Kumamoto, Kyushu.  At the time of writing, 34 fatalities had been reported, with 123 injured and 9,000 people displaced.  The earthquake was widely felt, including as far afield as China. In 2016 the area was hit by three large earthquakes: a 6.2 and 6.0, followed by a 7.0 the following day. Our thoughts are with the victims, their families and friends, and everyone else impacted.

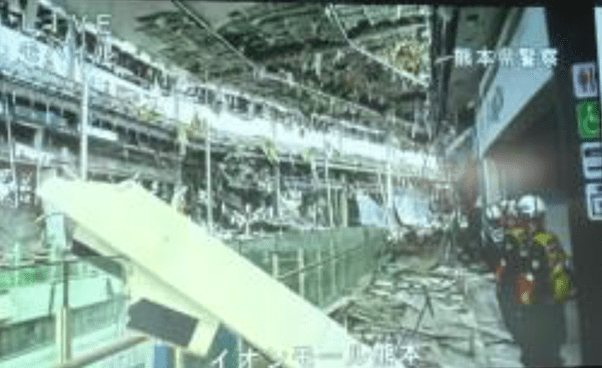
Fig 1: Inside Aeon Mall, 警察庁, CC BY 4.0, via Wikimedia Commons

Shinichi Sakai, from the Earthquake Research Institute, University of Tokyo, has said that the earthquake may have been caused by slip on the southern portion of the Hinagu Fault. During the 2016 Kumamoto earthquakes, only the northern extent of the Hinagu Fault slipped. The Hinagu Fault is located in the southern section of  Futagawa-Hinagu fault zone, the Futugawa Fault to the north.  This fault zone lies at the southern end of the Japan Median Tectonic Line, Japan’s longest fault system, which begins near Ibaraki Prefecture on the Pacific coast of Honshu and  runs parallel to Japan’s volcanic arc to Kyūshū.

Fig 2  Shake map  for  2026 6.8  Kumamoto Earthquake  by USGS, Published in the public domain, via Wikimedia Commons.

The Geospatial Information Authority of Japan reported ground deformation: in Yatsushiro, the Sencho geographic reference point was displaced 0.84 m (2 ft 9 in) northeast, and the Izumi station recorded a 0.17 m (6.7 in) movement southward; in Kumamoto, the Jonan station recorded 0.4 m (1 ft 4 in) of displacement to the north.   Surface ruptures along the Hinagu Fault damaged roads, bridges, and buildings. 

Some of the fatalities and injuries were caused by the collapse of the second floor of Aeon Mall Kumamoto, followed by an explosion; a factory chimney, part of the 19th century Yatsushiro-gūshrine and part of bridge collapsed in Yatsushiro; fires were also reported in Yatsushiro.  Damage to rail infrastructure occurred; a freight train derailed near Yatsushiro Station;  there were more than 200 reports of snapped rails and collapsed sound barriers; bent rails were reported at a train depot in Kumamoto and between Matsubashi and Ogawa stations on the Kagoshima Main Line. Landslides occurred on Mount Mayuyama.  48,300 homes lost power in Kumamoto Prefecture; businesses were also impacted. Kumamoto Castle, which was undergoing restoration work following the 2016 Kumamoto earthquakes, was extensively damaged.

Tectonic Setting

The Japanese Archipelago comprises 5 main islands, Hokkaido, Honshu, Shikoku, Kyushu and Okinawa. and c.14,000 smaller islands. Its geology is dominated by the subduction of the Pacific Plate in the north and the subduction of the Philippine Sea Plate in the south.  Japan is seismically very active and home to  c.100 active volcanoes.

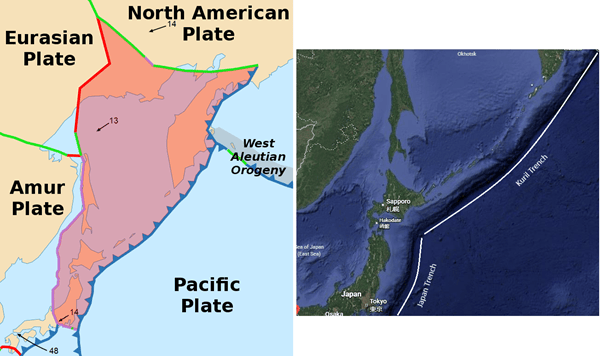
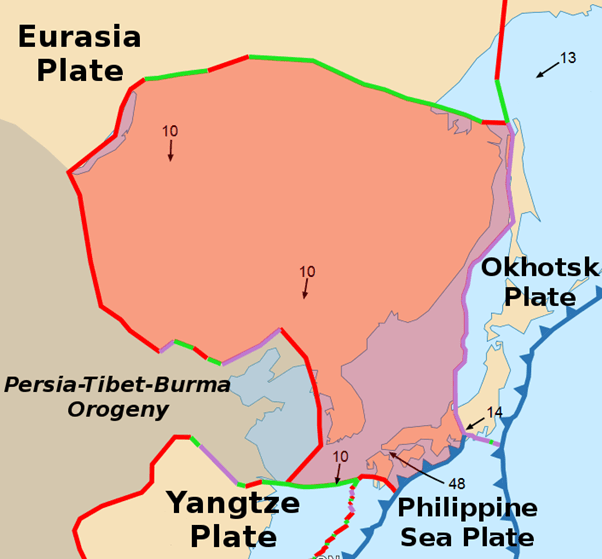
Fig 3:  Amur Plate by Alataristarion, CC BY-SA 4.0 , via Wikimedia Commons.  The Okinawa Plate is the small plate between the Philippine Sea Plate and the Yangtze Plate.

Kyushu Island, itself, lies on the rift boundary between the Amur and Okinawa Plate to the west of the subduction of the Philippine Sea Place under these plates.   

The Amur Plate is a small tectonic plate located on the eastern edge of the Eurasian Plate.  It has clearly defined boundaries on the the south by the Qinling suture zone in central China and the Baikal Rift Zone and Stanovoy Mountains on the north. The eastern boundary is with the Okhotsk Plate. The plate is moving anti-clockwise, according to GPS measurements.

The Okinawa Plate is another small continental tectonic plate. To its north is the Amur Plate.  On its eastern margin the Philippine Sea Plate subducts at the Ryuku Trench.  On its western edge there a divergent boundary with the Yangstze Plate.

The Philippine Sea Plate, comprising oceanic lithosphere, lies beneath the Philippine Sea, to the east of the Philippines.  The Philippine Sea plate, the Amur Plate, and the Okhotsk plate meet near Mount Fuji in Japan.

Seismicity

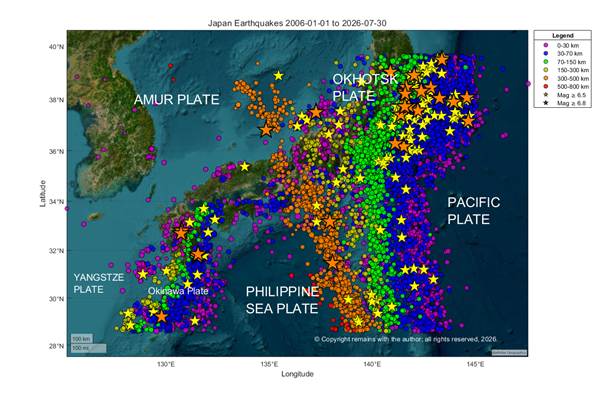
We plotted earthquakes occurring from 1st January 2006 to 30th July 2026 10:00am between 39.63°N, 153.14°E to 28.60°N, 124.75°E.  Our download from USGS contained 17,396 events. The plots clearly show the subduction zones.

Fig 4: Geoscatter plot by the author of earthquakes occurring from 1st January 2006 to 30th July 2026 10:00am between 39.63°N, 153.14°E to 28.60°N, 124.75°E.  For earthquakes of magnitude less than 6.5, colour denotes depth:  purple, 0-33km, blue 33-70km, green 70-150km, yellow, 150-300km. orange, 300-500km, red ≥500km. © remains with the author, all rights reserved, 2026. Yellow stars are earthquakes between 6.5 and 6.8 magnitude.  Orange stars are earthquakes with magnitude ≥ 6.8. © Copyright remains with the author, all rights reserved, 2026.
Fig 5: 3D scatter plot by the author of earthquakes occurring from 1st January 2006 to 30th July 2026 10:00am between 39.63°N, 153.14°E to 28.60°N, 124.75°E.  For earthquakes of magnitude less than 6.5, colour denotes depth:  purple, 0-33km, blue 33-70km, green 70-150km, yellow, 150-300km. orange, 300-500km, red ≥500km. © Copyright remains with the author, all rights reserved, 2026.

Thank you for visiting.

Armchair Volcanologist

© Copyright remains with the author, all rights reserved, 2026.

Sources:

USGS for raw earthquake data: Earthquake Hazards Program | U.S. Geological Survey

Wikipedia: 2026 Kumamoto earthquake – Wikipedia

Venezuela: Very Large Damaging Shallow Doublet Earthquakes, 24th June 2026

On 24th June 2026, two large shallow doublet earthquakes with magnitudes of 7.2 and 7.5 and depths of 20 km and 11.1 km, resp., struck northern Venezuela within 39 seconds of each other.   The death toll at the time of writing is 3,811 with 16,740 injured, tens of thousands reported missing and 17,854 who have lost their homes.  Roughly, 60,000 buildings were destroyed.  USGS modelling for each shock predicts higher numbers of fatalities and significant economic loss of between 4 to 20% of Venezuela’s GDP.  Our thoughts are with all those who have lost their lives, livelihoods, friends or homes, and also with those involved with the relief effort.

Fig 1: Photo of  rescuers in La Guaira, Venezuela, June 28, 2026.  Attribution: U.S. Marines 24MEU by Cpl. Daniel Garcia, Public domain, via Wikimedia Commons

The first shock occurred 21 km ENE of San Felipe at 23:04:34 and the second occurred 20 km ESE of Yumare at 23:05:11.  Because the earthquakes occurred such a short time period apart the deformation from each is hard to distinguish. Some organisations report them as a single event, e.g. INGV reports the earthquakes as a single event of magnitude 7.6 with two bursts of high energy release, having analysed the deformation from satellite data (Sentinel – 1).  In the first burst, slip occurred along a 210 km by 30 km section of the fault ,moving with a velocity of 3 – 3.5km per second to north east of Caracus; it started with 2.5 m of slip t a depth of 20km near Morón.  The second burst had a maximum slip of 3.6m north of Catia La Mar at a depth of 11.1km.

The earthquakes occurred on or near the San Sebastián fault system which is part of the larger Boconó– San Sebastián – El Pilar fault system.  The Bonocó Fault is 500 km long strike slip fault located in the Eastern Ranges of northeastern Colombia and the Mérida Andes of northwestern Venezuela; it has been active since the Early Holocene. It is part of the boundary between the North Andes Plate and the South American Plate. The San Sebastián Fault Zone is 500 km long, located mostly offshore in the Caribbean Sea north of Venezuela. It is right-lateral strike-slip, forming part of the boundary between the Caribbean and South American tectonic plates. The El Pilar Fault System is 700 km long, located in state of Sucre in northern Venezuela. The fault system is of right-lateral strike-slip type with an east–west orientation and also forms part of the transform plate boundary between the Caribbean and South American plates.

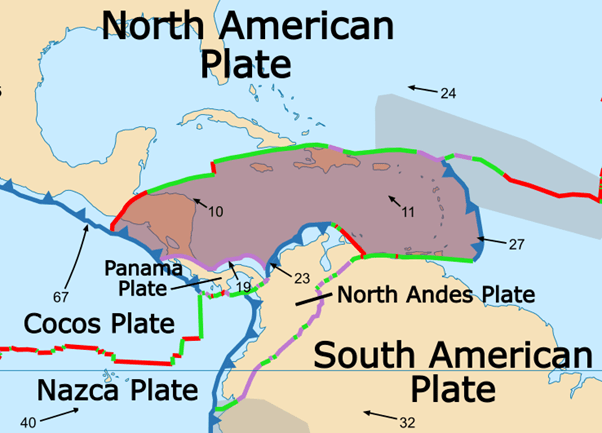
The South American Plate is moving west at a rate of 32 mm  per year, the North Andes Plate north west at a rate of 23 mm  per year and the Caribbean Plate north west at a rate of 11 mm  per year.  Because movement the Caribbean Plate is slower than the North Andes Plate, it subducts under the northwest margin of North Andes Plate; the North East margin is extensional.  The boundary between the Caribbean Plate and South American Plate comprises transform faults.

Fig 2:  Caribbean (brown shaded area) and surrounding plates by Alataristarion, published under CC BY-SA 4.0, via Wikimedia Commons.

The San Sebastian  fault system has produced large earthquakes in the past. In 1812 the Caracas earthquake with magnitude 7.7 caused 15,000 to 20,000 fatalities.  It is thought to have involved two sub-events, the first on the Boconó Fault and the second on the western part of the San Sebastián Fault.  In 1900 San Narciso earthquake with magnitude 7.7 is thought to have been caused by rupture along the San Sebastián Fault to the east of Caracas.  Before the recent earthquakes geophysicists had calculated that the accumulated slip deficit on the Bonocó fault could produce a 7.0 – 7.6 magnitude earthquake and likewise the San Sebastián fault might  produce a 7.1 magnitude earthquake.

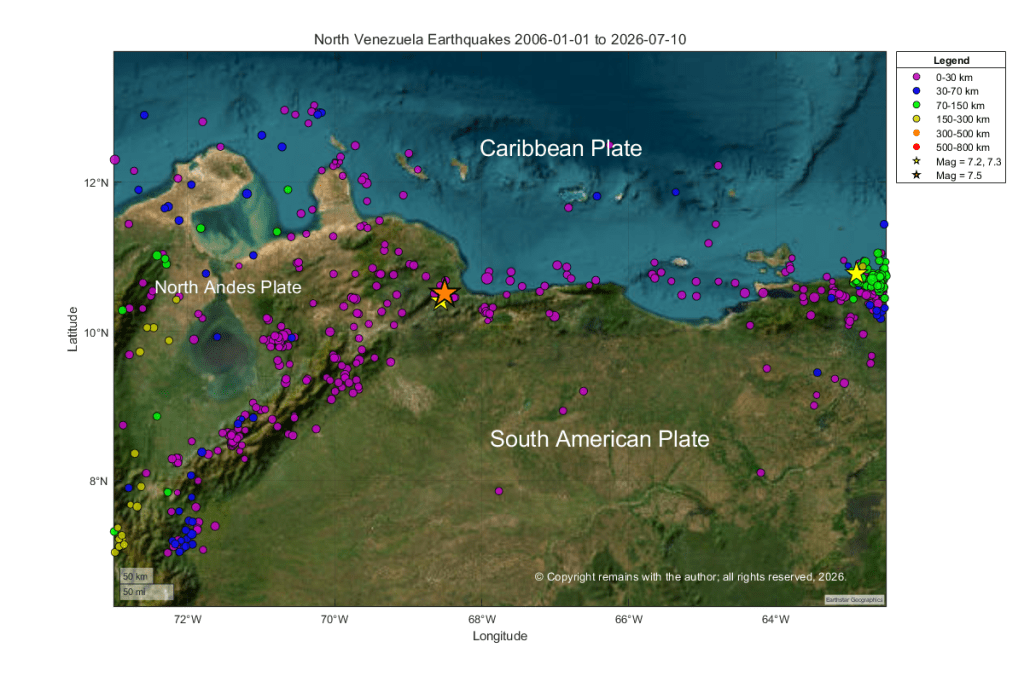
We have plotted the earthquakes between in the region between 15.0°N, 73.0 ° W and 7 ° N, 62.5 ° W from 1st January 2006 to 10th July 2026. In addition to the area of interest, this picks up part of the subduction of the Caribbean Plate under the North Andes Plate to the west of the plots and also the subduction of the South American Plate under the Caribbean Plate to the east of the plot. The latter includes a 7.3 magnitude earthquake at depth. Seismic activity in the area where the recent 7.2 and 7.5 earthquakes occurred tends to comparatively shallow, consistent with a transform plate margin.

Our first plot is a geoscatter plot. In this plot we can see that the doublet earthquakes occur near the junction of the three plates: Caribbean Plate, North Andes Plate and South American Plate.

Fig 3: Geoscatter plot of earthquakes between 15.0°N, 73.0 ° W and 7 ° N, 62.5 ° W from 1st January 2006 to 10th July 2026 by the author. Colour denotes depth for earthquakes with magnitude less than 7.0: 0-33km: purple; 33-70km: blue; 70-150km: green; 150-300km: yellow. Yellow stars are earthquakes with magnitude 7.2 in the centre of the plot and 7.3 in the east of the plot; the orange star is the 7.5 magnitude earthquake. © Copyright remains with the author; all rights reserved, 2026.
Fig 4: 3D rotating plot of earthquakes between 15.0°N, 73.0 ° W and 7 ° N, 62.5 ° W from 1st January 2006 to 10th July 2026 by the author. Colour denotes depth for earthquakes with magnitude less than 7.0: 0-33km: purple; 33-70km: blue; 70-150km: green; 150-300km: yellow. Yellow stars are earthquakes with magnitude 7.2 in the centre of the plot and 7.3 in the east of the plot; the orange star is the 7.5 magnitude earthquake. © Copyright remains with the author; all rights reserved, 2026.

We hope you find the above plots interesting. In our earlier post: Mt. Pelée, La Soufrière St. Vincent And A Quick Tour Of The Plates Surrounding The Caribbean Plate, we also looked at seismicity in a wider area.

Armchair Volcanologist

Sources:

USGS: Earthquakes | U.S. Geological Survey

Wikipedia: 2026 Venezuela earthquakes – Wikipedia

© Copyright remains with the author; all rights reserved, 2026.

Philippine Earthquake, Magnitude 7.8 08/06/2026

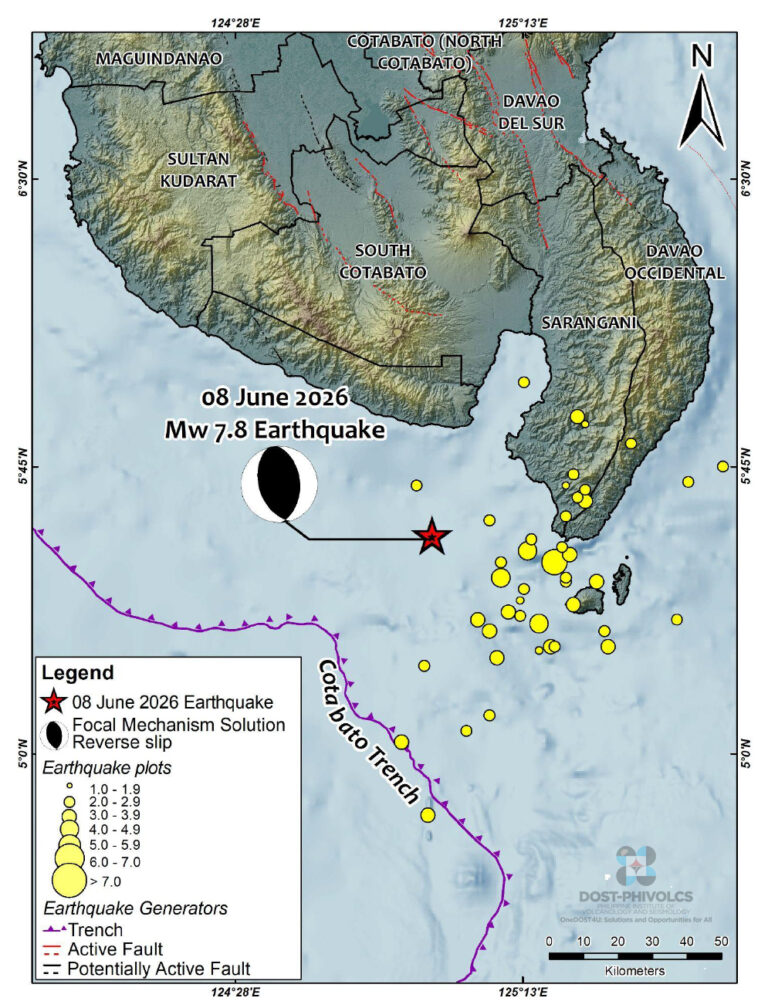
On 8th June 2026 at 07:37 (local time) a 7.8 magitude earthquake occurred 32 km south west of Maasim in Sarangi Province, off the coast of Mindanao Island, Philippines, with a depth of 33 km.  Tragically, at the time of writing reports suggest that at least 55  people were killed, 38 missing, 1,120 injured, with 390,000 people impacted.  Severe infrastructure damage has impacted rescue and recovery services.  A tsunami, with waves ranging from a few centimetres to 1.4 metres, was recorded.  Our thoughts are with all those affected now and in the coming months.

Fig 1: Location of the 7.8 Philppines earthquake.  Source PhiVolcs: PRIMER ON THE 08 JUNE 2026 MAGNITUDE (MW) 7.8 OFFSHORE SARANGANI EARTHQUAKE | PHIVOLCS

Tectonic Setting

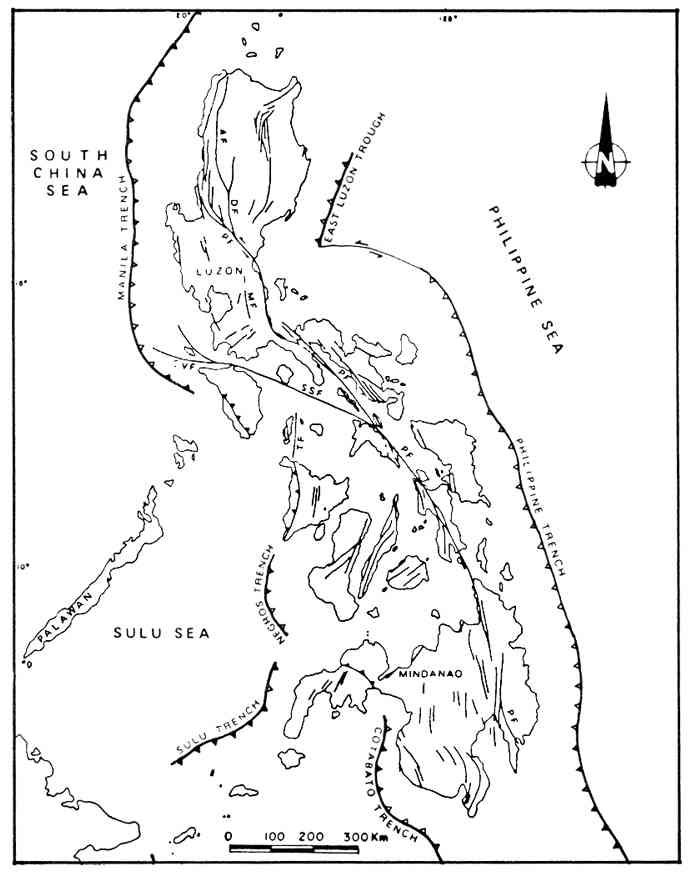
The Philippines  is an archipelago made up of c.7,641 islands.  It lies on the Philippine Mobile Belt, a zone lying above two opposing subduction zones: the Sunda Plate along the western edge at the Manila, Negros and Cotabato Trenches ; and, the Philippine Sea Plate on the eastern edge along the Philippine Trench and the East Luzon Trough. The Philippine Mobile Belt, itself, is the result of oblique collision between the westward-moving Philippine Sea Plate and the eastern margin of the Sunda Plate. It is rapidly deforming, made up of fragments of continental and oceanic crust.

Fig 2:  Map of Philippine Faults by Gubernatoria, published under CC BY 2.5 AU <https://creativecommons.org/licenses/by/2.5/au/deed.en&gt;, via Wikimedia Commons

The 7.8 earthquake was reverse thrust and attributed to movement at the Cotabato Trench.

The archipelago has three main geological features:

  • The 1,200-kilometer-long Philippine Fault Zone; a  strike-slip fault system which accommodates much of the shearing force caused by the colliding plates.  It is seismically active producing large earthquakes, including the destructive M7.6 Luzon earthquake of 1990.
  • Volcanism from the subduction. The Philippines is home to numerous active volcanoes, e.g., Taal, Mayon and Mount Pinatubo
  • A complex structure containing a mixture of ancient metamorphic rocks (dating back to the Jurassic and Cretaceous periods), early volcanic arcs, and microcontinental blocks.
  • The 7.8 earthquake is attributed to movement at the Cotabato Trench.

All in all, an interesting are to study seismicity.

Our Plots

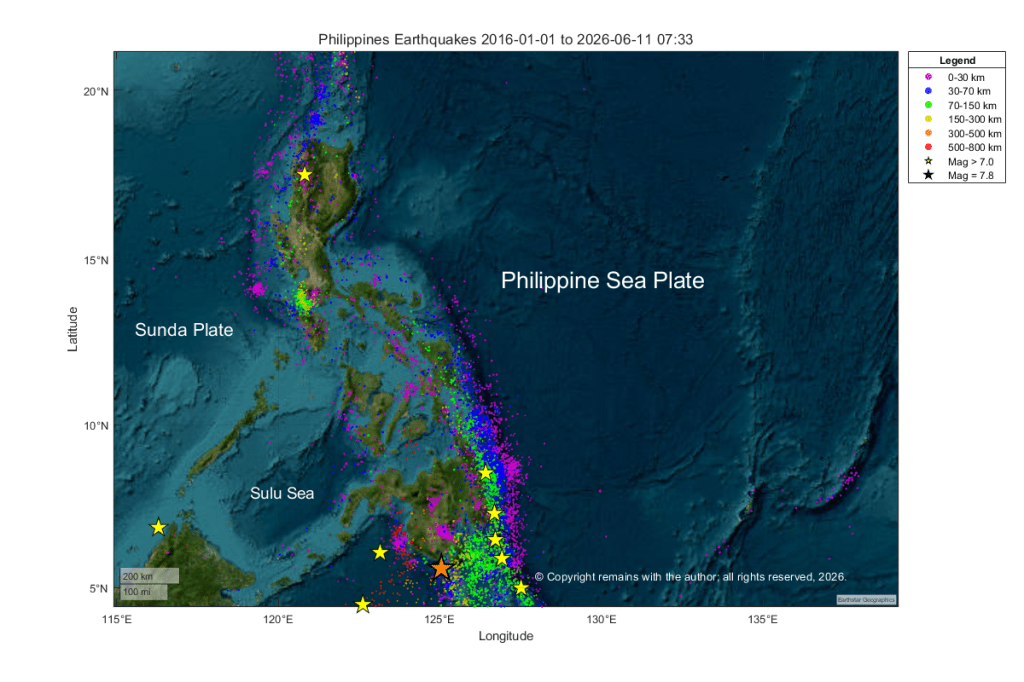
We looked at the area 4.4150°N, 116.16°E  to  21.1218°N, 137.90°E for the period 1st January 2016 to 11th June 2026 (07:33 am).  Our raw data was downloaded publicly available earthquake data from USGS, a total of 7,357 earthquakes with a  minimum magnitude of 3.7 and maximum depth of c.668 km. 

Fig 3: Geoscatter plot of earthquakes occurring between 4.4150°N, 116.16°E  to  21.1218°N, 137.90°E for the period 1st January 2016 to 11th June 2026 (07:33 am).  Earthquakes with magnitude ≥ 7.0 are shown as yellow stars; the magnitude 7.8 earthquake is shown as an orange star.  Smaller earthquakes are coloured by depth as per the legend; their transparency has been increased so we can see the land. © copyright remains with the author; all rights reserved, 2026.

In our Geoscatter plot, we can clearly see the seismicity on the Manila Trench, west of Luzon, the Philippine Trench east of the Philippines, the Philippine Fault Zone to the west of the Philippine Trench and other trenches. Activity along the Philippine Trench dominates the plot.  Most of the earthquakes with magnitude greater than 7.0 are associated with subduction at the Philippine Trench.

We can also see some deeper activity  in the southern part of the plot.  We think that this is related to the fully subducted Molucca Sea Plate which lies to the south of the Philippine Mobile Belt.  The Molucca Sea Plate lies between the southeastward subducting Sangihe Plate and the northwestward subducting Halmahera Plate; the collision zone is thought to be arc to arc collision rather than the more usual arc to continent collision.    This shows better in our scatter plot below.

Fig  4:  Video of 3D scatter plot of of earthquakes occurring between 4.4150°N, 116.16°E  to  21.1218°N, 137.90°E for the period 1st January 2016 to 11th June 2026 (07:33 am).  Earthquakes with magnitude ≥ 7.0 are shown as yellow stars; the magnitude 7.8 earthquake is shown as a black star.  Smaller earthquakes are coloured by depth as per the legend. © copyright remains with the author; all rights reserved, 2026.

In the video we can see that most of the magnitude seven and over earthquakes occur in the region between 0 to 100 km in the southern part of the region and a few are occurring at a depth of over 600 km.  The former are mostly associated with the Philippine Fault Zone and the Philippine Trench.

We hope you find the earthquake plots useful. 

Once again, our thoughts are with all those impacted by the earthquake.

Armchair Volcanologist

© copyright remains with the author; all rights reserved, 2026.

Sources:

USGS:  https://earthquake.usgs.gov/earthquakes

China Daily Asia: Philippine quake death toll reaches 55, search on for 38 missing

PhiVolcs: PRIMER ON THE 08 JUNE 2026 MAGNITUDE (MW) 7.8 OFFSHORE SARANGANI EARTHQUAKE | PHIVOLCS

Svartsengi: Will It, Won’t It or, most likely, When Will It… ?

Good Evening,

Today, we are looking at the earthquake plots for the Reykjanes Peninsula since the 16th July 2025 eruption on the Sundhnúkur crater row.

The Icelandic Met Office (IMO) are reporting that ground deformation and magma accumulation has continued under Svartsengi on the Reykjanes Peninsula, Iceland, since the 16th July 2025 eruption on the Sundhnúkur crater row. To date the cumulative uplift is just over 25cm and the estimated volume of magma accumulated is in the region of 26 million cubic metres.  IMO conclude that the most likely outcome is another eruption on the Sundhnúkur crater row. Their updates can be found here: Ground uplift and magma accumulation continue beneath Svartsengi | News | Icelandic Meteorological office .

We started by plotting the earthquakes for the Reykjanes Peninsula from 16th July 2025 to 10th May 2026 for the area between 63.7°N, 23.0°W to 64.4°N, 21.0°W.  This is followed by a closer look at the area covering Svartsengi and Krýsuvík.

Reykjanes Peninsula, 17th July 2025 to 10th May 2026

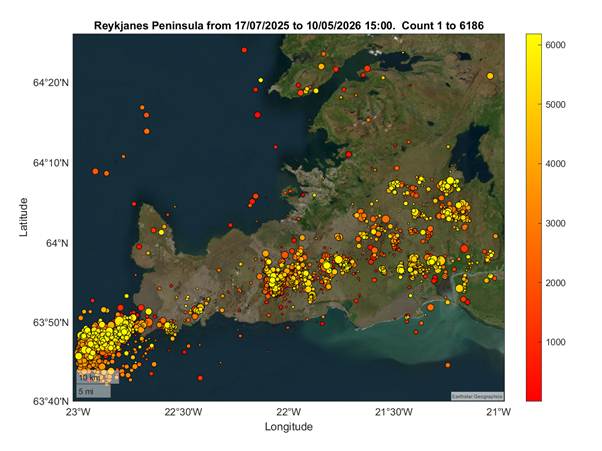
We downloaded publicly available earthquake data from Skjálftalísa for the area above; a total of 6,186 earthquakes. Our data set includes automatically recorded earthquakes which have not been reviewed so there is less certainty about their location, especially where have been earthquake swarms.

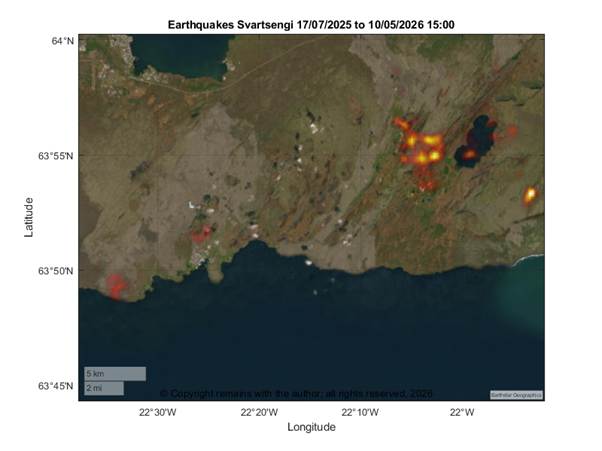
Fig 1: Geoscatter plot of earthquakes occurring in the area 63.7°N, 23.0°W to 64.4°N, 21.0°W for the period 17th July 2025 to 10th May 2026 15:00. Colour denotes age: yellow are the most recent, red are the oldest in the sequence.  © Copyright remains with the author; all rights reserved.

We have created a video of the sequence.  Frames are captured in steps of 100 earthquakes.

Fig 2: Video of geoscatter plots of earthquakes occurring in the area 63.7°N, 23.0°W to 64.4°N, 21.0°W for the period 17th July 2025 to 10th May 2026 15:00 in buckets of 100 earthquakes. Colour denotes age: yellow are the most recent, red are the oldest in the sequence.  © Copyright remains with the author; all rights reserved.

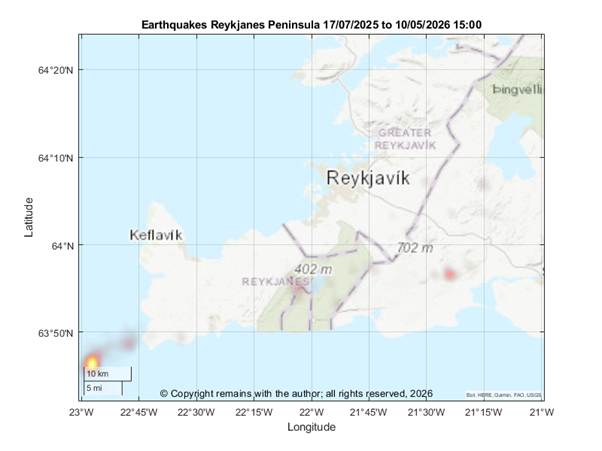
A geodensity plot of the same data set shows that activity is focussed on Eldey out on the Reykjanes Ridge, an area to the west of Hveragerdi near Raufarhólshellir, Krýsuvík and, harder to see, Svartsengi and an area to the west of Grindavík. We had to change the background to improve visibility.

Fig 3: Geodensity plot of earthquakes occurring in the area 63.7°N, 23.0°W to 64.4°N, 21.0°W for the period 17th July 2025 to 10th May 2026 15:00. Colour denotes density: yellow is the densest are, red is less dense.   © Copyright remains with the author; all rights reserved.

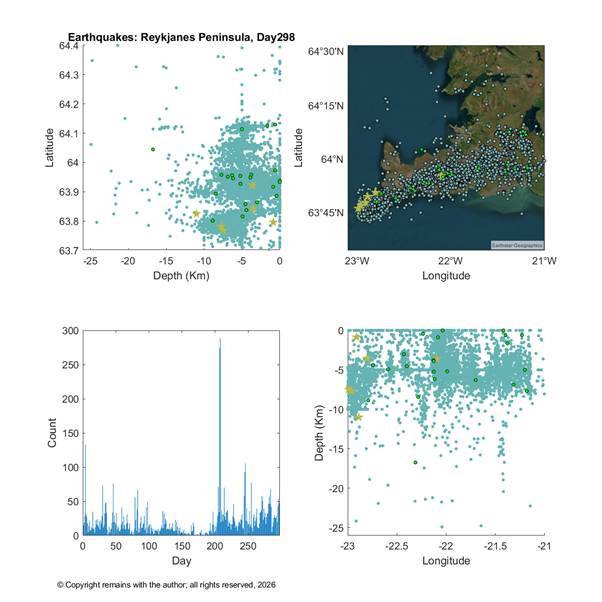
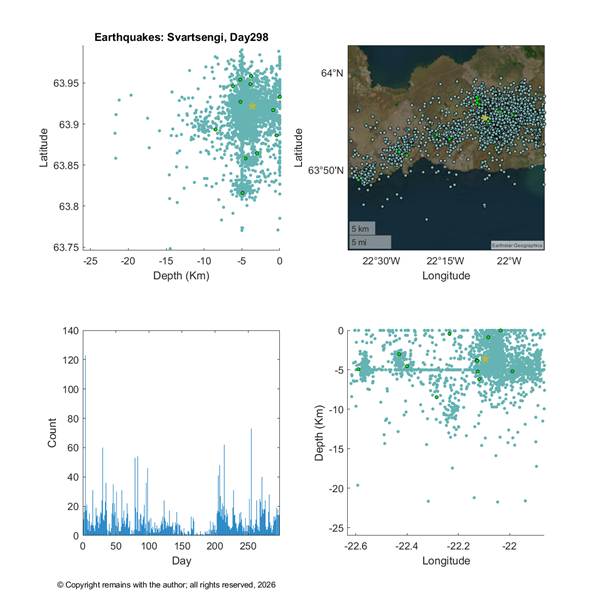
To see what is going on below the surface, we plotted the earthquakes latitude v depth, count per day and depth v longitude; the geoscatter plot is shown for reference.

Fig 4: Depth plots of earthquakes occurring in the area 63.7°N, 23.0°W to 64.4°N, 21.0°W for the period 17th July 2025 to 10th May 2026 15:00. Key: bright green circles are earthquakes occurring on that day, magnitude  < 3.0 mag; bright yellow stars are earthquakes occurring on that day, magnitude  ≥ 3.0 mag; teal circles are cumulative earthquakes occurring on previous days, magnitude  < 3.0 mag; and, dull yellow starts are cumulative earthquakes occurring on previous days, magnitude  ≥ 3.0 mag. © Copyright remains with the author; all rights reserved.

We have created a video of above plots covering the whole 298 day period by day.

Fig 5: Video of depth plots of earthquakes occurring in the area 63.7°N, 23.0°W to 64.4°N, 21.0°W for the period 17th July 2025 to 10th May 2026 15:00. Key: as for Fig 4. © Copyright remains with the author; all rights reserved.

Most earthquake activity is occurring in the crust. There would appear to magma doming under the western end of the Reykjanes Peninsula. It is less clear what is going on to the east of this and also further west, but, as most activity is in the crust, we feel that this most likely faults moving to accommodate the uplift under Svartsengi. Whether the activity at Krýsuvík or Eldey is enough to permit magma ascent in the future remains to be seen, but, at the time of writing, they are showing little ground deformation.

Svartsengi, 17th July 2025 to 10th May 2026

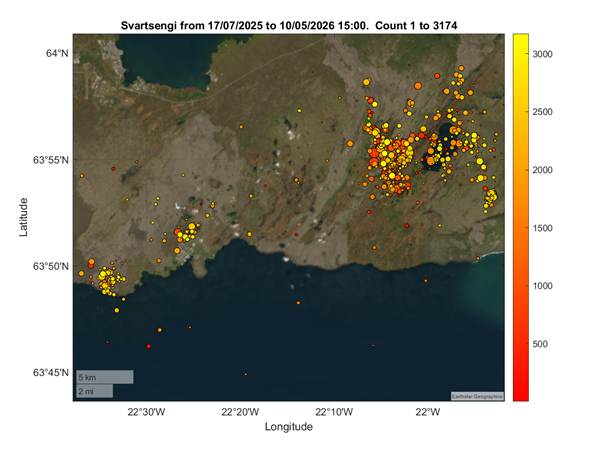
We plotted the area 63.746°N, 22.631°W to 63.996°N, 21.864°W; this covers both the Svartsengi and Krýsuvík regions from the above data set; a total of 3,174 earthquakes.

Fig 6: Geoscatter plot of earthquakes occurring in the area 63.746°N, 22.631°W to 63.996°N, 21.864°W for the period 17th July 2025 to 10th May 2026 15:00. Colour denotes age: yellow are the most recent, red are the oldest in the sequence.  © Copyright remains with the author; all rights reserved.

We have created a video of the sequence.  Frames are captured in steps of 100 earthquakes.

Fig 7: Video of geoscatter plots of earthquakes occurring in the area 63.746°N, 22.631°W to 63.996°N, 21.864°W for the period 17th July 2025 to 10th May 2026 15:00 in buckets of 100 earthquakes. Colour denotes age: yellow are the most recent, red are the oldest in the sequence.  © Copyright remains with the author; all rights reserved.

A geodensity plot of the same data set shows that activity is focussed on Krýsuvík, Svartsengi and an area to the west of Grindavík.

Fig 8: Geodensity plot of earthquakes occurring in the area 63.746°N, 22.631°W to 63.996°N, 21.864°W for the period 17th July 2025 to 10th May 2026 15:00. Colour denotes density: yellow is the densest are, red is less dense.   © Copyright remains with the author; all rights reserved.

To see what is going on below the surface again, we plotted the earthquakes latitude v depth, count per day and depth v longitude; the geoscatter plot is shown for reference.

Fig 9: Depth plots of earthquakes occurring in the area 63.746°N, 22.631°W to 63.996°N, 21.864°W for the period 17th July 2025 to 10th May 2026 15:00. Key: bright green circles are earthquakes occurring on that day, magnitude  < 3.0 mag; bright yellow stars are earthquakes occurring on that day, magnitude  ≥ 3.0 mag; teal circles are cumulative earthquakes occurring on previous days, magnitude  < 3.0 mag; and, dull yellow starts are cumulative earthquakes occurring on previous days, magnitude  ≥ 3.0 mag. © Copyright remains with the author; all rights reserved.

We have created a video of above plots covering the whole 298 day period by day.

Fig 10: Video of depth plots Depth plots of earthquakes occurring in the area 63.746°N, 22.631°W to 63.996°N, 21.864°W for the period 17th July 2025 to 10th May 2026 15:00. Key: as for Fig 9. © Copyright remains with the author; all rights reserved.

Due to the low level of seismic activity in the Svartsengi area, our plots do not add much more than the plots of the Reykjanes Peninsula at the moment in terms of predicting what will happen next. Time will tell when and where the next eruption occurs.

We hope you find the plots useful.

For up to date information and advice, please visit the Icelandic Met Office site: https://en.vedur.is/

An Armchair Volcanologist

© Copyright remains with the author; all rights reserved, 2026.

Sources are credited in the text.

Update on the Eruption at Litli Hrútur, 13th July 2023

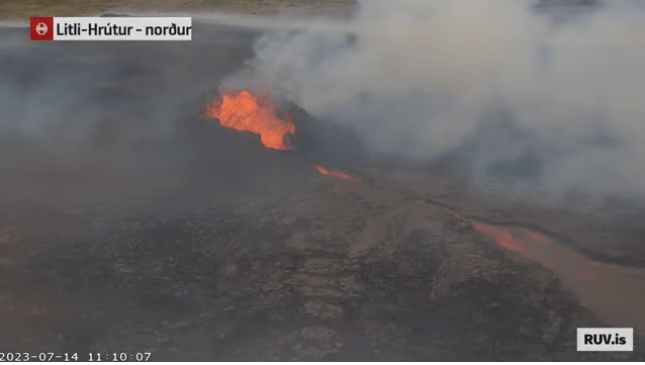
Fig 1: Screenshot from Bein streymi frá eldgosinu við Litla-Hrút – RÚV.is (ruv.is)  Lava flowing south from the crater today.  Smoke from the moss fires is visible at the edge of the lava field.

The eruption site is closed to the public right now due to the danger from volcanic gasses and smoke from moss fires; some visitors have been affected.  Also, some visitors have been taking insane risks (e.g., attempting to climb the crater wall).  High winds yesterday also caused issues.

The Institute of Earth Sciences, Iceland, have provided an update on the eruption here: Volcanic eruption at Litli-Hrút, measurement results 13 July | Institute of Earth Sciences (hi.is) .  This is summarised below.

  • As we know the eruption started on 10th July 2023 at 16:40 with the opening of four fissures with a combined length of c.800m in a north easterly direction from Litli Hrútur towards Keilir.   The eruption peaked at c.21:00, diminishing to form a single crater c. 400m northeast of Litli Hrútur.
  • Lava is flowing south with an average flow rate of 13m3/s (similar to the 2021 eruption) for the period 11 July to 13 July.  As of 13 July 13:38, the lava volume is c. 3.4 million cubic metres covering an area of 0.4km2.  Calculations were performed by NLSI from Pleiades satellite images.
  • The lava composed of vesicular glass, microphenocrysts and microlites of plagioclase, olivine, clinopyroxene and spinel, similar to the 2022 lava.  Lava is estimated to have a temperature of c.1190°C.  The chemical composition is similar to that of the 2021 and 2022 eruptions: MgO wt.% = 8.5, and, K2O/Ti2O = 0.26.
  • The gas composition is similar to that of the 2022 eruption, with a high concentration of CO2.  The CO2 may have accumulated prior to the eruption.  SO2 gas emissions range from 5.4-11.5 ktonnes / day and CO2 is 7.1 – 15 5 ktonnes / day.

If lava continues to flow southwards, it may reach the 2022 lavas in Meradalir.

We have updated our earthquake plots to 13th July 2023 02:06, focussing more on the area between Fagradalsfjall, Keilir and Krýsuvík. 

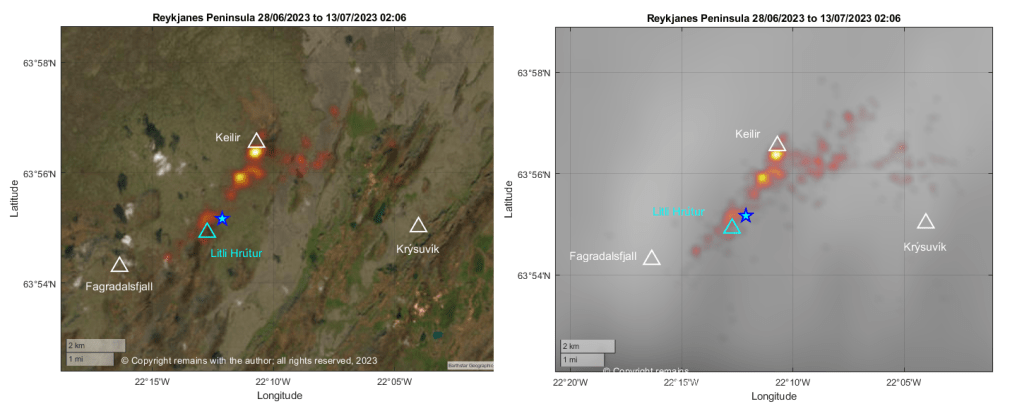
The earthquake density plot is still showing most activity southwest of Keilir and close to the eruption site, which we determined from eyeballing the location of the crater. The area southeast of Keilir is also showing more activity.  Whether the activity close to Keilir is triggered quakes, the result of faults moving to accommodate the magma intrusion, or magma-related (or, indeed, both) remains to be seen.

Fig 2: Geodensity plots by the author.  The blue star shows the approximate location of the crater. In the image to the right, we have removed the satellite image background so that the earthquakes are more visible. © Copyright remains with the author; all rights reserved, 2023. 
Fig 3:  Geoscatter plots by the author.  The blue star shows the approximate location of the crater. © Copyright remains with the author; all rights reserved, 2023. 
Fig 4:  Scatter plots by the author.  The blue star shows the approximate location of the crater. © Copyright remains with the author; all rights reserved, 2023. 
Fig 5:  Combined geoscatter & scatter plots by the author.  © Copyright remains with the author; all rights reserved, 2023. 

Armchair Volcanologist

© Copyright remains with the author; all rights reserved, 2023

Sources

Raw earthquake data: Skjálfta-Lísa (vedur.is)

Other sources are included in the text.

Türkiye-Syria Earthquakes, 6th February 2023

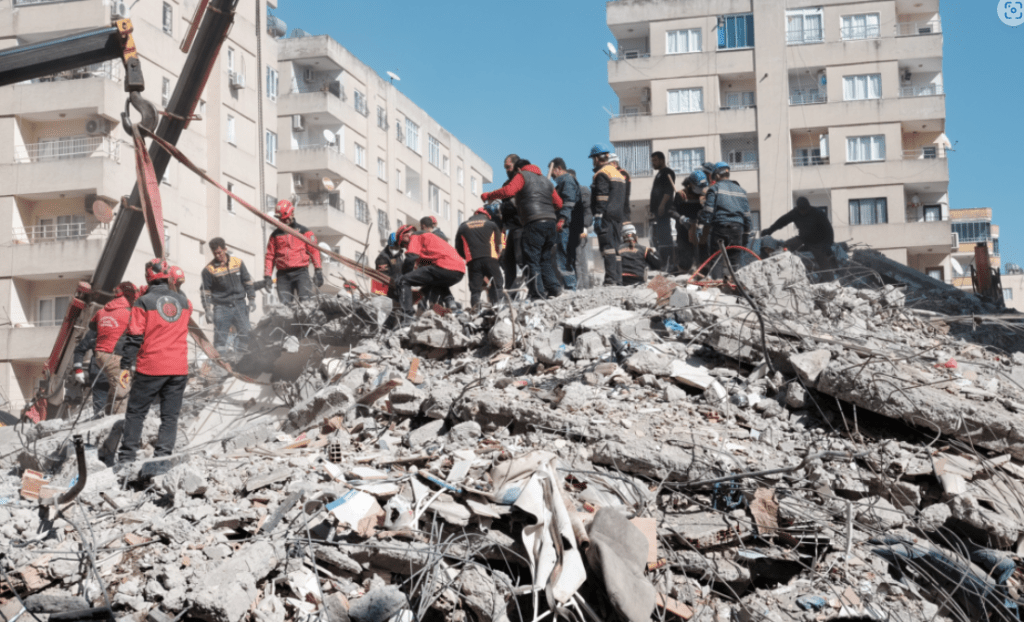
Fig 1: Rescue workers in in Osmaniye, Turkey.  Cropped from image by Onur Erdoğan, Public Domain, Wiki Commons

It’s approximately one month on from 6th February 2023 when a 7.8 magnitude earthquake struck on the south western end of the East Anatolian Fault Zone at 01:18 UTC (04:18 local time) 32.4km west northwest of the town of Gaziantep.  This, followed by large aftershocks, including a very shallow 7.5 magnitude earthquake to the north of the first quake, caused catastrophic damage in central and southern Turkey, and northern and western Syria.  The 7.5 earthquake signalled the rupturing of a second fault zone, the Sürgü-Misis Fault.  The final fatality number is not yet available but, at the time of writing, fatalities exceeded 50,000, with hundreds of thousands injured and millions displaced.  Our thoughts are with the victims, including those facing a long road to recovery.

We have taken a look at the earthquakes surrounding the Anatolian Plate from the start of January 2023 to 1st March 2023. 

Tectonic Settings

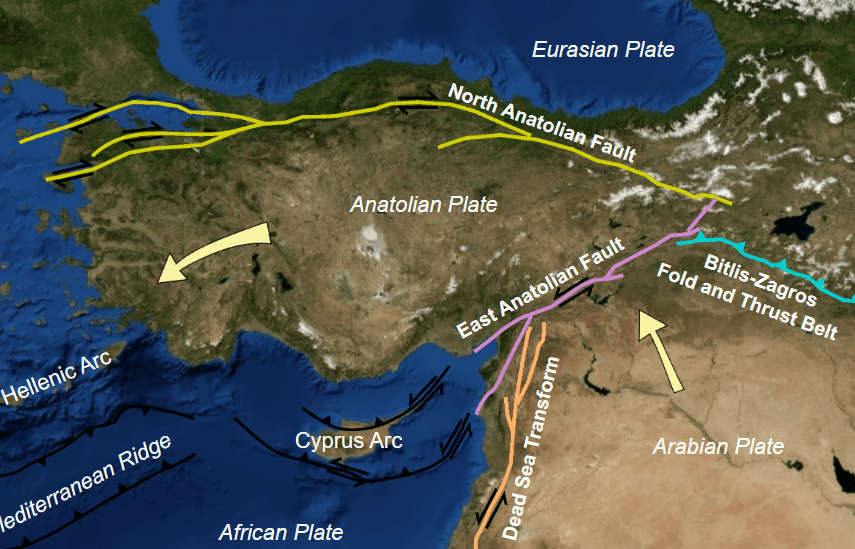
The Anatolian Plate lies between the Eurasian Plate, Arabian Plate and African Plate.  The African Plate is moving at a rate of 2.15cm per year in a north easterly direction, the Eurasian Plate is moving south, relative to the African Plate, at a rate of 7-14mm per year, the Arabian Plate is moving northward at a rate of 15-20mm per year and the Anatolian Plate is moving south west at the rate of 21mm per year. The relative motions are accommodated by the North Anatolian Fault, East Anatolian Fault, Bitlis – Zagros Fold and Thrust Belt and Dead Sea Transform Fault System.

Fig 2: Image by Roxy – Own work, CC BY-SA 3.0, Wiki Commons

The East Anatolian Fault is a 500km long fault zone which marks the plate boundary between the Anatolian and Arabian Plates; the boundary is a transform one with left lateral strike slip seismic activity and a slip rate of 10mm per year. The Anatolian Plate is pushed westward by the Arabian Plate moving northwards towards the Eurasian Plate. 

The East Anatolian Fault is a single fault between Karliova and Çelikhan.  After Çelikhan the fault zone splits into north and south strand, both of which include multiple faults.  The Sürgü-Misis Fault makes up the northern strand; it is a 380km long stretching between Çelikhan and Karataş; the eastern parts of the east-west section are made up of the Çardak and Sürgü faults; the sytem changes direction at the Göksun bend dividing into seven north east trending fault systems – the Karataş, Yumurtalık, Toprakkale, Savrun, Misis, Çokak and Düziçi-İskenderun faults.  The Sürgü-Misis Fault system connects to the Cyprus Arc via the Misis-Kyrenia fault system.   The southern strand of the East Anatolian Fault is less certain; the East Anatolian Fault may extend to the north of Cyprus; and, the NNE trending Türkoğlu-Amik section (the Karasu Fault Zone) may be a separate fault, linking the Dead Sea Transform to the East Anatolian Fault. The Karasu Rift has had Quaternary volcanic activity on northern part and sides of the rift between Kirikhan, Reyhanli and Fevzipaşa in an area 94km long and 12-25km wide.

The North Anatolian Fault, another strike slip fault, accommodates the relative motion between the Anatolian Plate and the Eurasian Plate.  The North Anatolian Fault and the East Anatolian Fault meet the Bitlis – Zagros Fold and Thrust Belt, where the Arabian Plate subducts under the Eurasian Plate, at the Karliova Triple Junction.

Not very far to the west, the African Plate is subducting under the Anatolian Plate at the Cyrpus Arc.  The Dead Sea Transform Fault System to the south marks the transform boundary between the Arabian and African Plates.  The East Anatolian Fault meets the Dead Sea Transform Fault System at the Maras Triple Junction.

Earthquake Plots

We initially plotted the earthquakes from 1 January 2023 to 25 February 2023 for the area 34.47361°N, 25.22222°E to 42.25833°N, 44.45056°E.  We then looked at 35.3122°N, 32.50944°E to 41.21667°N, 42.70056°E, focussing on the East Anatolian Fault. The results are shown in the following videos and earthquake density plot.

Fig 3:  Video by the author of earthquake plots from 1 January 2023 to 1st March 2023, latitude v depth, Geoscatter, earthquake count and longitude v depth.  Key: cyan circles denote current earthquakes <4.5M, green stars, current earthquakes between 4.5M and 5.5K, yellow stars, current earthquakes between 5.5M and 6.5M and red stars, current  earthquakes over 6.5M; and, grey circles denote previous earthquakes <4.5M, green stars, previous earthquakes between 4.5M and 5.5K, yellow stars, previous  earthquakes between 5.5M and 6.5M ,and red stars, previous  earthquakes over 6.5M.  © copyright remains with the author, 2023; all rights reserved.
Fig 4. Video by the author of the Geoscatter plot of the East Anatolian Fault and by earthquakes in groups of 10 from 6 February 2023 to 1st March 2023.  Key: red circles denote current earthquakes <7.0M and red stars denote current earthquakes >7.0M, and dark red circles, previous earthquakes <7.0M and black stars, previous earthquakes >7.0M. © copyright remains with the author, 2023; all rights reserved.
Fig 5: Video of a rotating 3D scatter plot of the earthquakes in the East Anatolian Fault for the period 6 February 2023 to 1st March 2023. Colour denotes age: red, the oldest, and yellow, the newest. © copyright remains with the author, 2023; all rights reserved

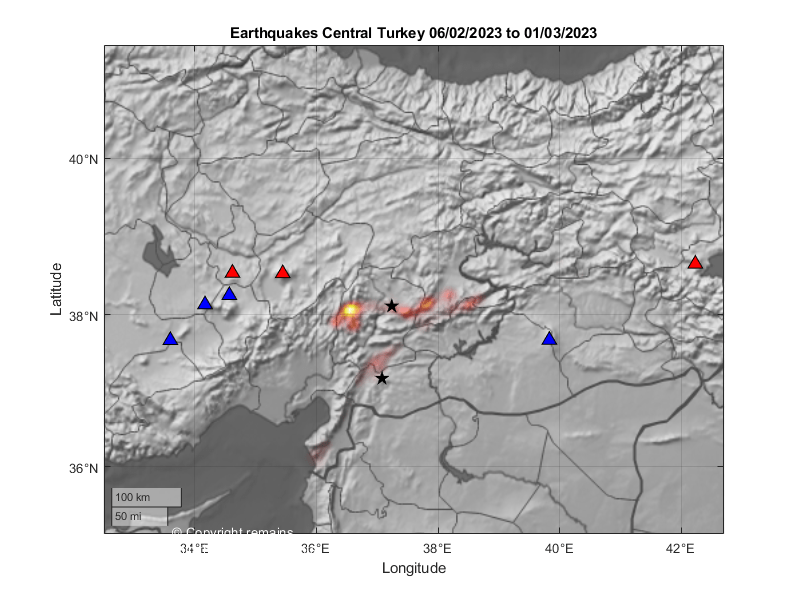
The geodensity plot shows that most activity occurred on the Sürgü-Misis Fault to the west and east of the 7.5M earthquake.

Fig 6: Geodensity plot by the author of earthquakes occurring between 35.3122°N, 32.50944°E to 41.21667°N, 42.70056°E, from 6th February 2023 and 1st March 2023. Red triangles denote volcanoes with dated activity in the Holocene and blue triangles denote volcanoes with activity in the Holocene of unknown date. © copyright remains with the author, 2023; all rights reserved.
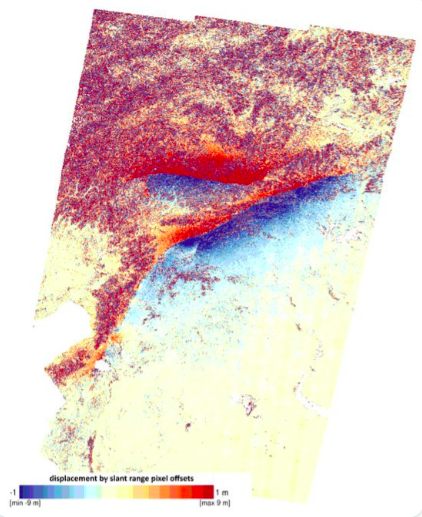
Fig 7: Surface rupture from the two earthquakes as shown by analysing before and after satellite images. The first rupture on the East Anatolian Fault was 190km long and the second on the Sürgü-Misis Fault was 38km long (Image credit: Copernicus/NERC/COMET)

Most of the faults within the East Anatolian Fault Zone seem to have moved in the period we looked at. However, the scale of our plots may be misleading. Our plots do show a tenuous link between the East Anatolian Fault and the Cyprus Arc.  There was some activity on the Arc preceding the 7.8 earthquake. After shocks have migrated through the fault system towards the Arc.   There is no obvious link with the Dead Sea Transform Fault in the time period selected but geologically-speaking that is a very short period.

Armchair Volcanologist

© copyright remains with the author; all rights reserved, 2023.

Sources & Further Reading

Raw earthquake data was downloaded from EMSC, https://www.emsc-csem.org

“Paleoseismology of the western Sürgü–Misis fault system: East Anatolian Fault, Turkey”, Tamer Y. Duman, Hasan Elmacı, Selim Özalp, Akın Kürçer, Meryem Kara, Ersin Özdemir, Ayhan Yavuzoğlu & Çağıl Uygun Güldoğan,  Mediterranean Geoscience Reviews volume 2, pages411–437 (2020) https://link.springer.com/article/10.1007/s42990-020-00041-6

Updates on Activity at Fagradalsfjall, Cumbre Vieja, and Askja as of October 2021

We are no longer updating this post; future updates will be included in new posts.

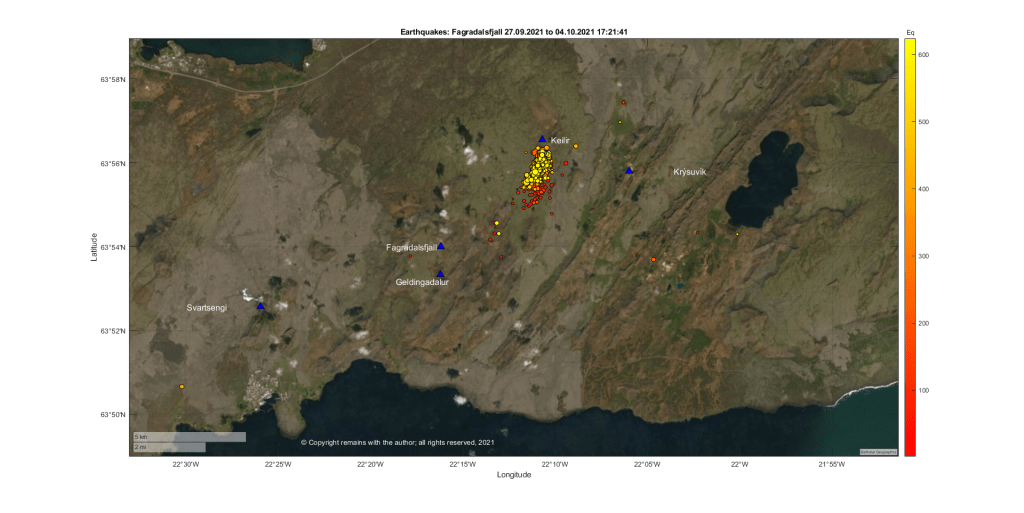
Update 2 12.10.2021: Plots of the Earthquake Swarm SSW of Mount Kelir, 27/09/2021 to Date

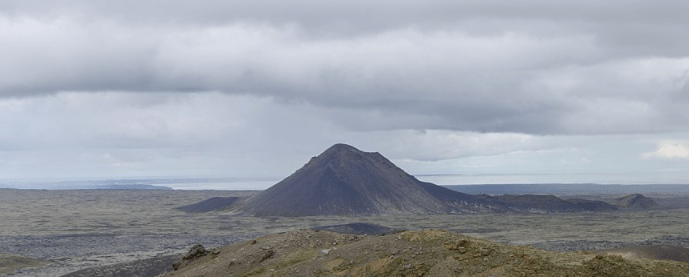
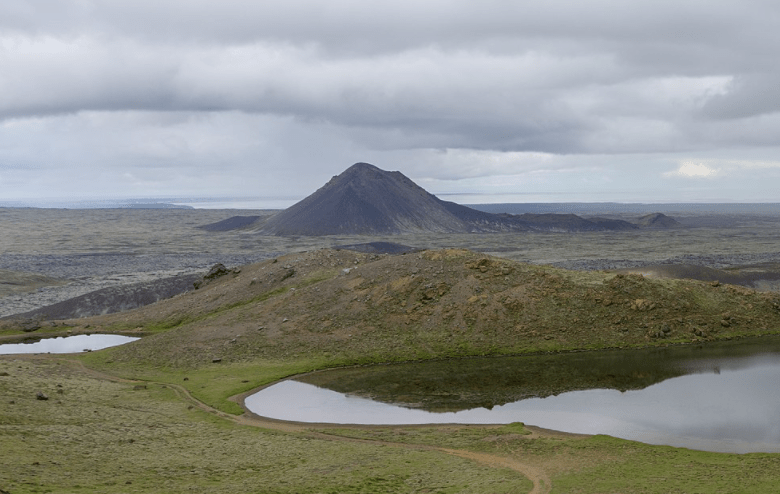
Fig 16: Mount Kelir, cropped from an image by Michal Klajban, published under CC BY-SA 4.0.  Source: Wikimedia Commons

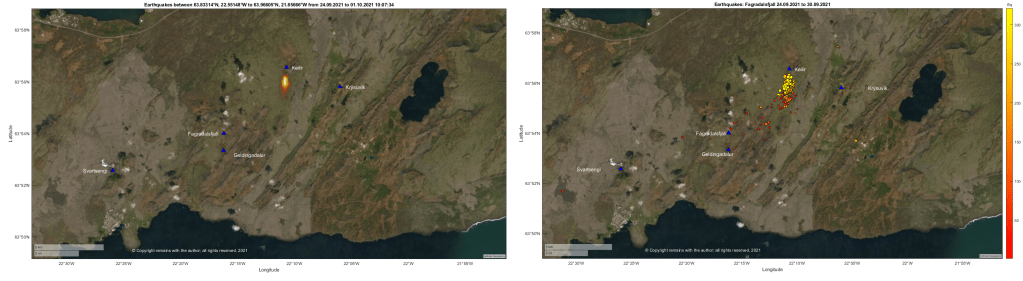
Mount Kelir is at the northern end of the earthquake swarm which started on 22 February 2021. In that swarm, earthquakes started near Mount Kelir and migrated towards and beyond Fagradalsfjall prior to the eruption at Geldingadalir on 19 March 2021.

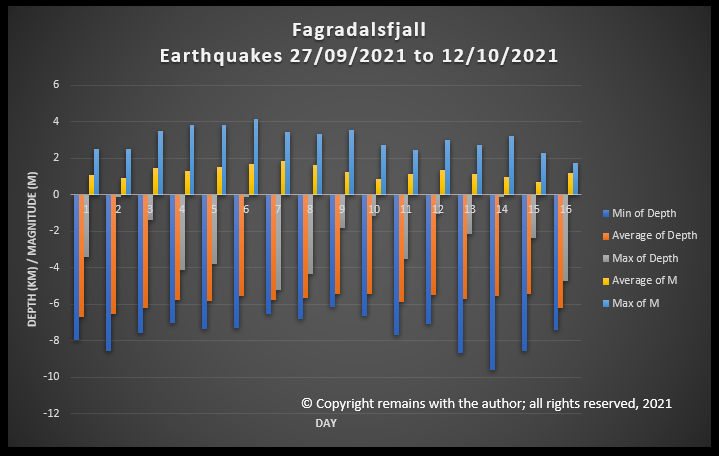
The current swarm which started on 27 September 2021 near Mount Kelir is ongoing at the time of writing.  Over 10,000 earthquakes have been recorded, of which IMO have confirmed c. 1,245.  It is thought that an eruption may ensue near Mount Kelir.

We have plotted the earthquakes and made a video of the geoscatter and scatter plots.

Fig 17:  Analysis of the swarm by depth and magnitude by the author.  © Copyright remains with the author; all rights reserved, 2021.
Fig 18:  Video of geoscatter plots and scatter plots of the current swarm by the author.  © Copyright remains with the author; all rights reserved, 2021.

Whether or not a new eruptive site emerges, magma migrates to the existing site at Fagradalsfjall, or, it all quietens down, only time will tell.  At the moment the swarm is migrating SSW. 

Armchair Volcanologist

© Copyright remains with the author; all rights reserved, 2021.

Source for raw earthquake data:  Icelandic Met Office: IMO

12.10.2021 1: Update on La Palma Seismicity

Good Morning!

Let’s take look at status of the eruption and seismicity at La Palma.

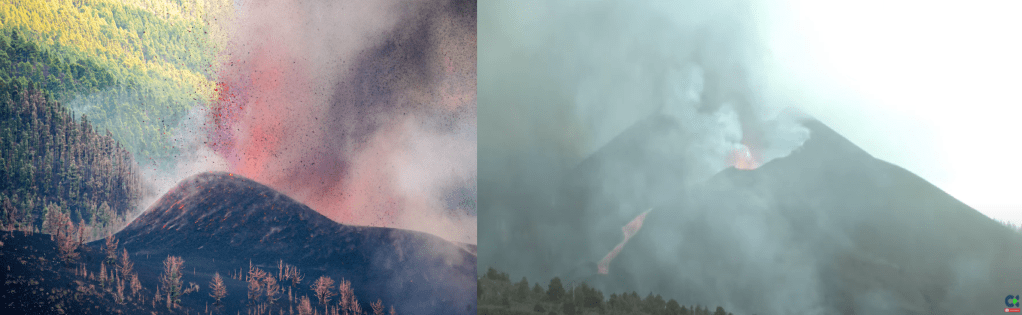
The eruption is still going strong.  The cone has grown substantially, despite partial collapses.

Fig 11: Cone growth.  On the left, the new cone on 20 September, 2021, cropped from an image by Eduardo Robaina, published under CC BY-SA 3.0; on the right, screen shot earlier today from RTVC

The following was reported earlier today:

  • The lava reached the cement works, Callejón de la Gata, today.  Local residents were confined to their homes due to the risk of toxic fumes from burning chemicals.
  • A  large volume of lava was emitted after the wall of the lava lake [cone?] was destroyed.
  • The northern arm of the lava flow is now 300 metres from the sea and expected to make a new lava delta near the beach of Perdido.
  • 591.1 hectares have been affected by lava.  This includes 132 hectares of crops , of which 70 hectares were banana crops; 33 hectares vineyards; and, 8 hectares avocado crops.
  • The maximum width of the lava flow is 1,520 metres.
  • 1,281 buildings have been impacted, of which 1,186 have been destroyed.
  • The lava delta is now 34 hectares.
  • Seismicity remains high.  To  date, over 35,000 earthquakes have been recorded.  The most recent earthquakes remain below 10km, with depths reaching more than 20km.

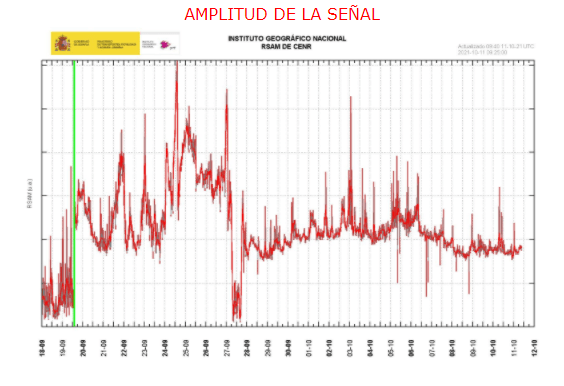
The high level of seismicity is thought to indicate rising magma because there have been spasmodic tremors and a strong volcanic tremor at 18 Hz; the latter may be from depressurisation of magma at a depth of c. 10km.  In the absence of increased ground deformation, it is not known when or how magma may reach the surface.  If it reaches the surface, it may follow the current conduit or emerge at new fissures.

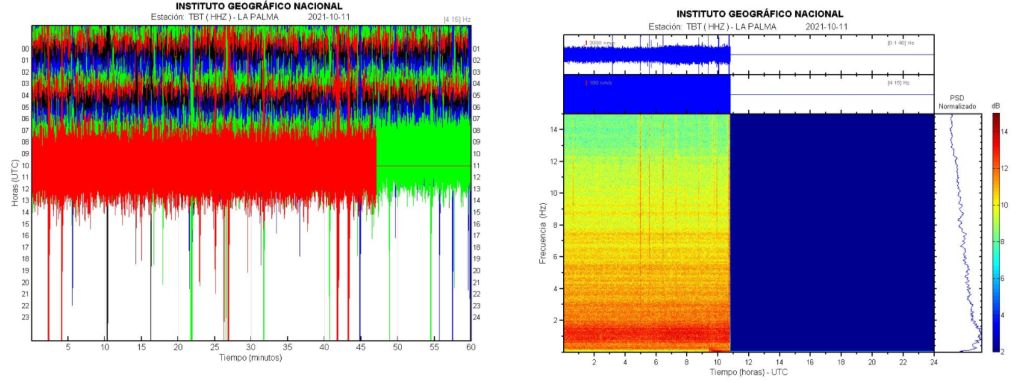
Fig 12:  Amplitude of seismic signal, source: IGN.  Green line denotes onset of the eruption.
Fig 13:  Seismic signal, source: IGN

We have updated our earthquake data and have plotted the swarm from 27 September 2021to present.  The results are shown in the video below.

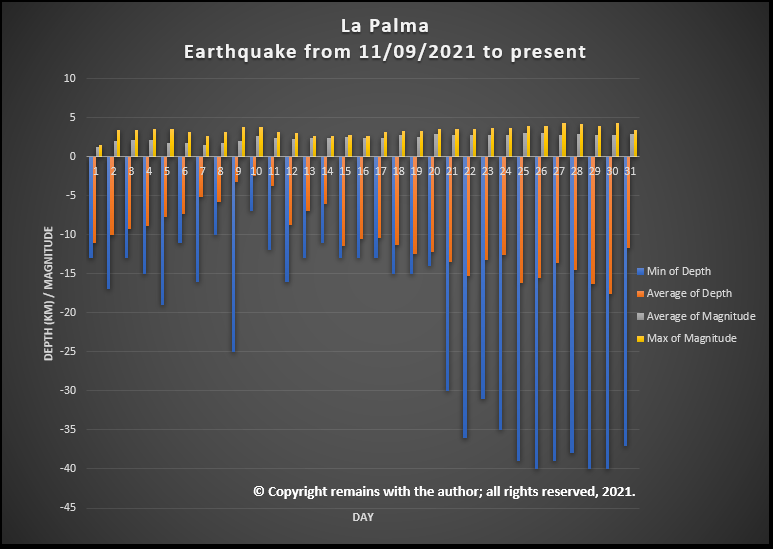
Fig 14: Analysis of the earthquake swarm from 11 September 2021 to present by the author.  © Copyright remains with the author; all rights reserved, 2021.
Fig 15: Video showing geoscatter plots and scatter plots by the author of the swarm from 27/09/2021 to present

Armchair Volcanologist

© Copyright remains with the author; all rights reserved, 2021.

Sources:

El Mundo: www.elmundo.es

VolcanoDiscovery:  www.volcanodiscovery.com

IGN: www.ign.es

04.10.2021: Update Fagradalsfjall Seismic Swarm near Kelir

The swarm near Mount Kelir is ongoing.  IMO report that 6.200 earthquakes have occurred in the swarm, although c.624 have been confirmed at the time of writing (Sources:  IMO_Earthquakes and  Skjálfta-Lísa (vedur.is)).

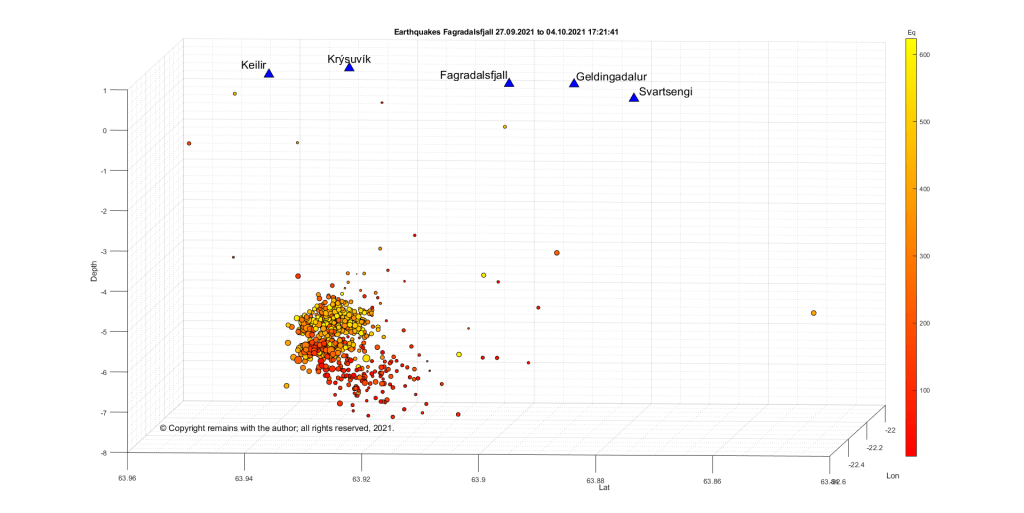
Fig 8: Geoscatter plot of the current swarm SSW Mount Kelir by the author. Colour denotes time (using earthquake number), red is the oldest and yellow the youngest.  © Copyright remains with the author; all rights reserved, 2021

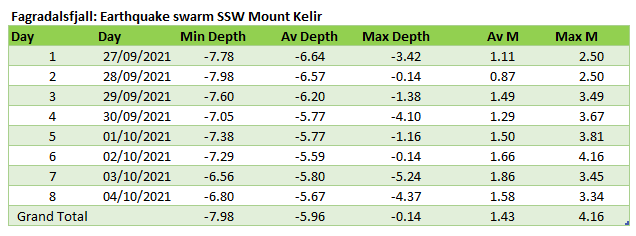
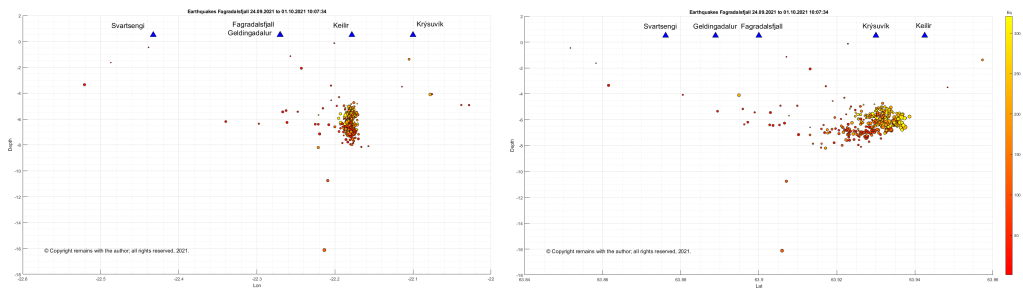
We have analysed and plotted the swarm.  It would appear that the swarm is ascending but still in the crust. The largest earthquake with a magnitude of 4.16 had a depth of 5.669 km. 

Fig 9: Numerical analysis of the swarm by the author.  © Copyright remains with the author; all rights reserved, 2021.

The possible ascent of the swarm is more visible in the scatter plot looking at it in an easterly direction.

Fig 10: Scatter plot of the swarm by the author.  Colour denotes time (using earthquake number), red is the oldest and yellow the youngest. © Copyright remains with the author; all rights reserved, 2021.

04.10. 2021: Update on the Cumbre Vieja Eruption

Fig 6: Plot of earthquakes from 11/09/2021 to 04/10/2021 10:13:11 by the author.   © Copyright remains with the author; all rights reserved, 2021
  • Part of the main cone collapsed at c. 9:10 pm last night; some vents have now merged.
  • Effusive activity has increased.  Lava flows have merged; the flow is 1km wide at its widest point.
  • The lava delta is now 29.7 hectares.  This has impacted the surfing beach at Los Guirres.
  • 400 hectares of land has been covered by lava and 4,819 hectares covered by ash.  1,047 buildings have been damaged, including 947 destroyed.
  • 20% of the banana crop has been lost. The village  of La Bombilla, built for banana plantation workers, is now under threat.
  • The seismic swarm is ongoing, with most recent earthquakes between 7km  – 14km depth.

We have updated our earthquake plots for the most recent swarm (11/09/2021 to 04/10/2021 14:30:59).  The swarm reactivated on Day 17.

Fig 7: Earthquake  plots by the author for the swarm 11/09/2021 to present. © Copyright remains with the author; all rights reserved, 2021

Sources for updates as before: El Mundo and IGN.

01.10.2021 (original post)

Good Morning! Today we provide an update on Fagradalsfjall, Cumbre Vieja (with video of earthquake swarms) and Askja.

Fagradalsfjall, Iceland

Fig 1: Mount Kelir, cropped from an image by Michal Klajban, published under CC BY-SA 4.0.  Source: Wikimedia Commons

Fagradalsfjall celebrated the six-month anniversary of the start of the eruption, which occurred on 19 March 2021, by taking a break.  Low level activity has been observed since 18 September 2021.

An earthquake swarm stared on 27 September 2021 south of Mount Kelir.  This is located near the northern end of the earthquake swarms earlier this year which preceded the eruption at Geldingadalir.

We have plotted the swarm to see what is going on.

Fig 2a: Plots by the author of the earthquake swarm from 27/09/2021 to present. Geodensity plot on the left and geoscatter plot on the right.  The colour code in the geoscatter plot is time: red is the oldest, yellow the newest. Time is approximated by earthquake sequence.  © Copyright remains with the author; all rights reserved, 2021.
Fig 2b: Plots by the author of the earthquake swarm from 27/09/2021 to present. Scatter depth v longitude plot on the left and scatter depth v latitude plot on the right.  The colour code is time: red is the oldest, yellow the newest. Time is approximated by earthquake sequence.  © Copyright remains with the author; all rights reserved, 2021.

While it is not clear what the cause of the swarm is (new magma or the crust adjusting to changes in tension), people are advised to avoid the area for the time being.  If an eruption does occur near Kelir, it is expected to be similar to that at Fagradalsfjall.   The aviation code is still orange.

Cumbre Vieja, Canary Islands

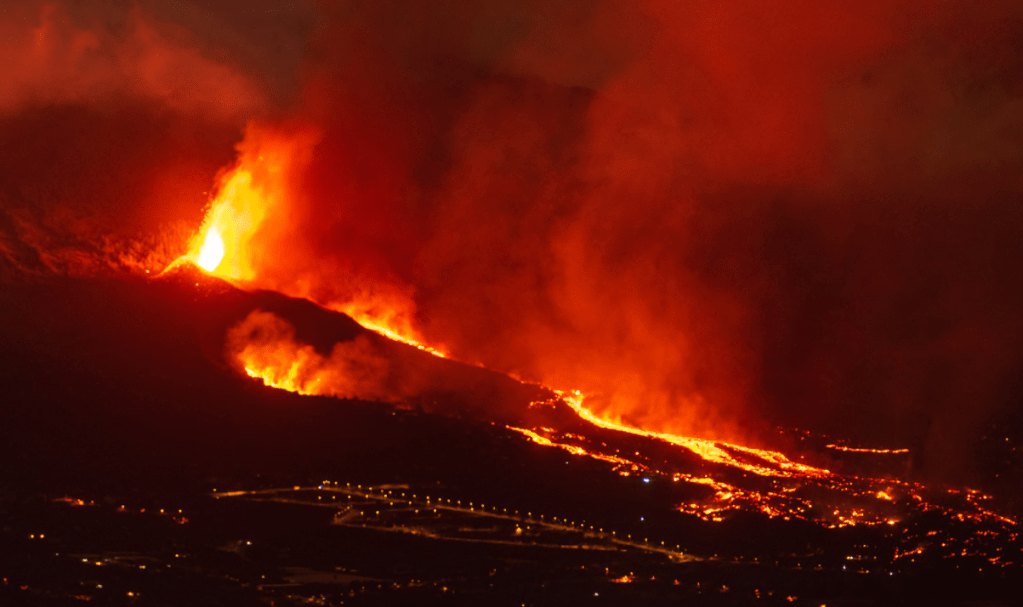
Fig 3: Cumbre Vieja eruption on 20/09/2021, cropped from an image by Eduardo Robaina, published under CC BY-SA 3.0.  Source: Wikimedia Commons

The eruption is still going strong.  The vents have produced ash columns, jetting lava and effusive lava flows.

Lava reached the sea, following the opening of a new vent earlier this week, which emitted more effusive lava. The lava travelled at 300 m/hr, crossing the coastal road and cascading over 100m high cliffs at Los Guirres. The lava is forming a delta, which has reached an impressive size 21 hectares. 

There are now four eruptive vents: a new effusive vent opened 400m north of the main vent on Thursday; and, two more opened on Friday 15 metres apart and 600m north west of the main cone.  Lava from Thursday’s new vent also made it to the sea via a flow parallel to the original one.  A fumarolic field has developed on the north side of the main vent.

Over 80 million cubic metres of lava have been erupted.  Sadly, this has damaged 1,005 buildings, of which 870 have been destroyed.  30.2km of road has been impacted, of which 27.7km have been destroyed.  Ash now covers 3,172.9 hectares of land.

SO2 levels are higher but not considered a risk for the population at the moment.

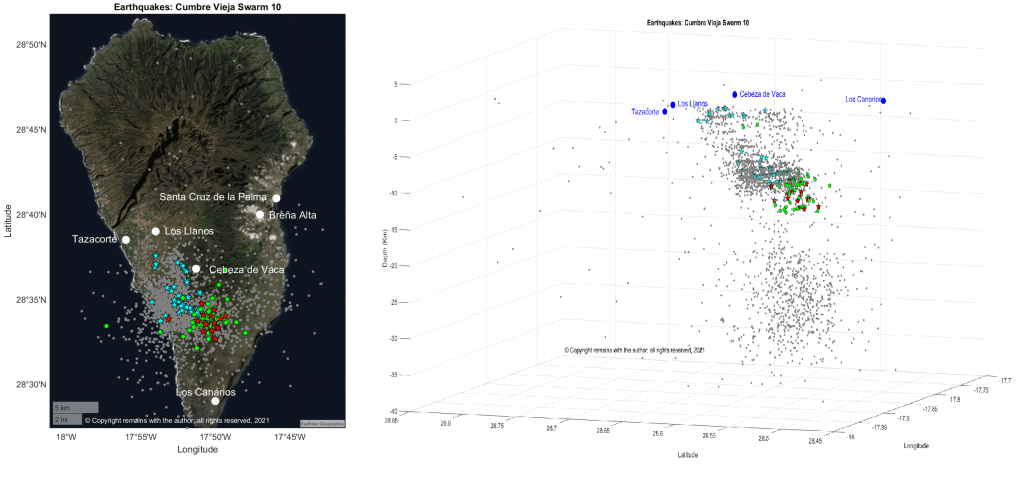
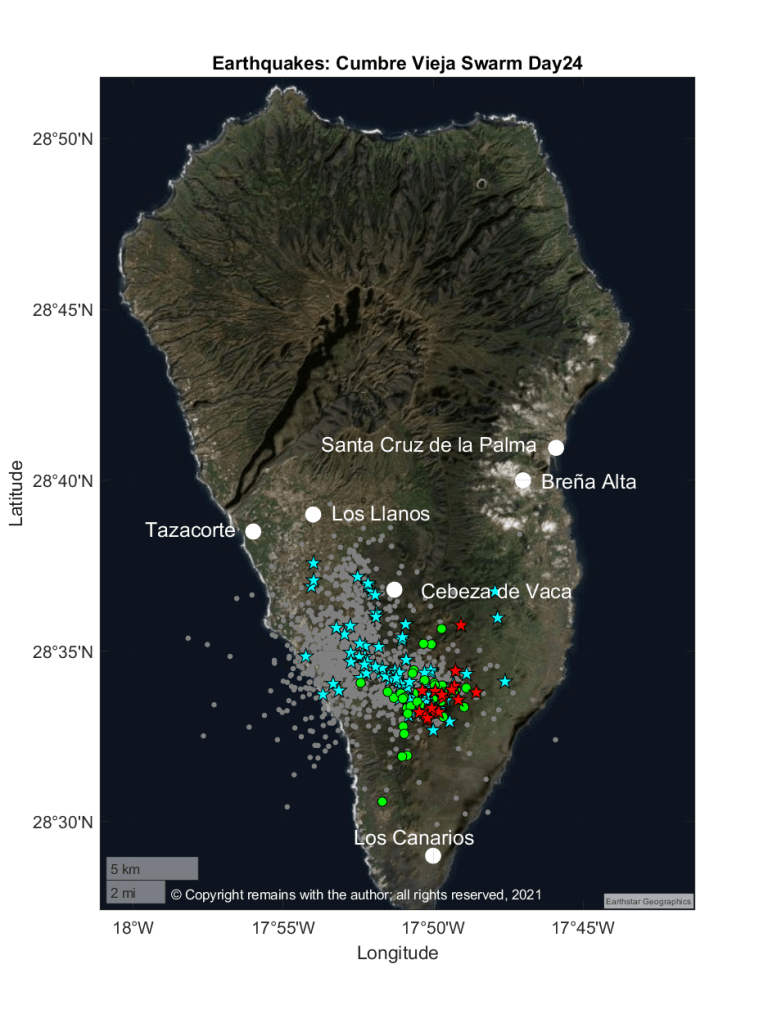
Earthquakes are occurring near the area start of the swarm which preceded the eruption.  They are deeper than the earlier swarm leading to concern that lava may be fed from a deeper reservoir.   We have plotted the current swarm and previous swarms from 2017 to date. 

Fig 4: Plots by the author of the most recent earthquake activity at Cumbre Vieja.  For plotting purposes, the activity has been labelled as a new swarm, which started on 27 September 2021. Green circles are the current swarm earthquakes < 3.0M; red stars are current swarm earthquakes ≥3.0M; grey circles are earthquakes < 3.0M from 2017 to 26.09.2021; and cyan stars are earthquakes ≥3.0M from 2017 to 26.09.2019 (all are in fact from the previous swarm starting 11 September 2021).  © Copyright remains with the author; all rights reserved, 2021.

We have compiled a video of the earthquake swarms from 2017 to present.

Fig 5: Video by the author showing the progress of the earthquake swarms from 2017 to present. © Copyright remains with the author; all rights reserved, 2021.

Askja

Seismicity is still occurring.  The Icelandic authorities are continuing to monitor this.  The aviation code is still yellow. 

We have not had time to update our earthquake plots, but will do so in due course.

Armchair Volcanologist

© Copyright remains with the author; all rights reserved, 2021

Sources:

Plots are the authors own work.

Information and raw earthquake data:

Fagradalsfjall: Home-page – Icelandic Meteorological Office | Icelandic Meteorological office (vedur.is)

Cumbre Vieja: Instituto Geográfico Nacional (ign.es) & EL MUNDO – Diario online líder de información en español

A Quick Look at Iceland: Total Earthquakes by Year 2009 to 23 October 2020

Good Morning!

While we are waiting to see if there is any volcanic activity at Grímsvötn or her neighbours, let’s take a look at how the current seismic activity in Iceland compares to previous years. 

Our database, comprised of earthquake data downloaded from IMO (see Sources below), now goes back to 29 December 2008 and extends to 23 October 2020, although we may reupload the last week soon because IMO may have been in the process of updating the record when we downloaded the data. 

Fig 1: Iceland: Total Earthquakes by Year and Magnitude by the author, using data downloaded from IMO (see Sources below).  © Copyright remains with the author; all rights reserved, 2020.

From our graph, we can see that the total number of earthquakes was up in 2010, 2014, 2017 and 2020.  In 2010, Eyjafjallajökull erupted, in 2014, Barðarbunga erupted at the Holuhraun fissure; in 2017, there was no subaerial volcanic activity, although Katla may have had some subglacial activity, and, in 2020, there is rifting both in the Reykjanes Peninsula and Tjörnes Fracture Zone but we have yet to see what, if any, volcanic activity emerges.  Interestingly, the 2011 eruption of Grímsvötn did not push the total earthquakes up in 2011.

Let’s take a look at activity by region. Here we look at the four main volcanic regions: the Tjörnes Fracture Zone, Vatnajökull, Myrdalsjökull and the Reykjanes Peninsula, where there is most seismic activity.

Fig 2: Iceland Total Earthquakes by Region and Year by the author, using data downloaded from IMO (see Sources below). Note: not all regions

Fig 3: Iceland Total Earthquakes > 2.0M by Region and Year by the author, using data downloaded from IMO (see Sources below). Note: not all regions are shown.  © Copyright remains with the author; all rights reserved, 2020.

We see that the eruption of Eyjafjalljokull increased the number of earthquakes in Myrdalsjökull but not to the extent that the eruption of Barðarbunga at the Holuhraun fissure and subsidence in the caldera pushed up the earthquakes for Vatnajökull in 2014 and subsequent years.  In fact, the total number of earthquakes in all regions, except Myrdalsjökull, has remained elevated since Holuhraun.

Our database does not extend back far enough to draw any firm conclusions, however, it would appear that rifting events such as Holuhraun produce far more earthquakes than volcanic activity on its own. 

Tjörnes Fracture Zone and on the Reykjanes Peninsula

This rather begs the question as to what is happening this year with the large earthquake swarms both in the Tjörnes Fracture Zone and on the Reykjanes Peninsula.  Unless our database does not go back far enough, neither the 2011 Grímsvötn nor the 2014 Barðarbunga eruption was preceded by such large earthquake swarms in other regions.

The fact that there is significantly raised activity this year in both regions suggests to us that we may be witnessing the normal plate separation on the Mid Atlantic Ridge (it is not entirely smooth), possible local magma ascent, and / or the plates accommodating an ascending blob of magma from the mantle plume, which is believed to be under the Vatnajökull icecap. There is ground deformation at several spots under the Vatnajökull icecap which points to magma ascent. 

IMO have reported that there could be a magmatic intrusion at depth on the Reykjanes Peninsula; this is supported by ground deformation. 

Gas measurements, ground deformation and recent seismic activity at Grímsvötn (not enough to show in our graphs but above the background levels for the volcanic system) have led to the Icelandic authorities to consider that an eruption is possible there in the not too distant future and to raise the alert level a notch (see earlier article). 

It is too soon to tell whether or not the rifting events, themselves, will result in eruption(s); it is possible that it is just a coincidence that we are seeing two large rifting events at roughly the same time – both areas are seismically active.  Time will tell. 

In the meantime, we will continue to watch.

The Armchair Volcanologist

© Copyright remains with the author; all rights reserved, 2020.

Sources:

For raw earthquake data and updates:

Icelandic Met Office: https://en.vedur.is/