Good Afternoon,
An earthquake of magnitude of 6.5, 56 km west of Tonopah, Nevada, started an earthquake swarm on 15 May 2020; at the time of writing there had been 1,032 quakes. Last year there was a large swarm to the south in the Eastern California Sheer Zone. This prompted me to take a look at earthquake activity in both California and Nevada.
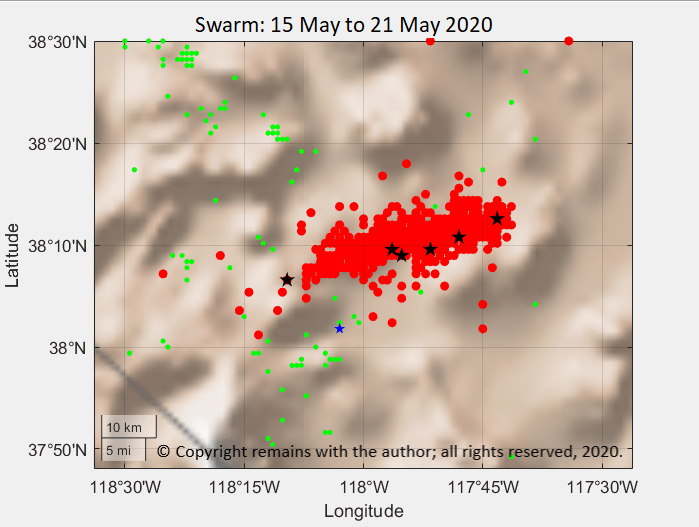
The May 2020 swarm occurred in the Walker Lane Deformation Belt. According to USGS(1), this area has produced two dozen earthquakes with magnitude over 5.0M, mostly to the west and south. In December 1968, there was a 6.8M quake 50 km to the north; and, in January 1934, a 6.5M 40km to the north west.
Geological Setting
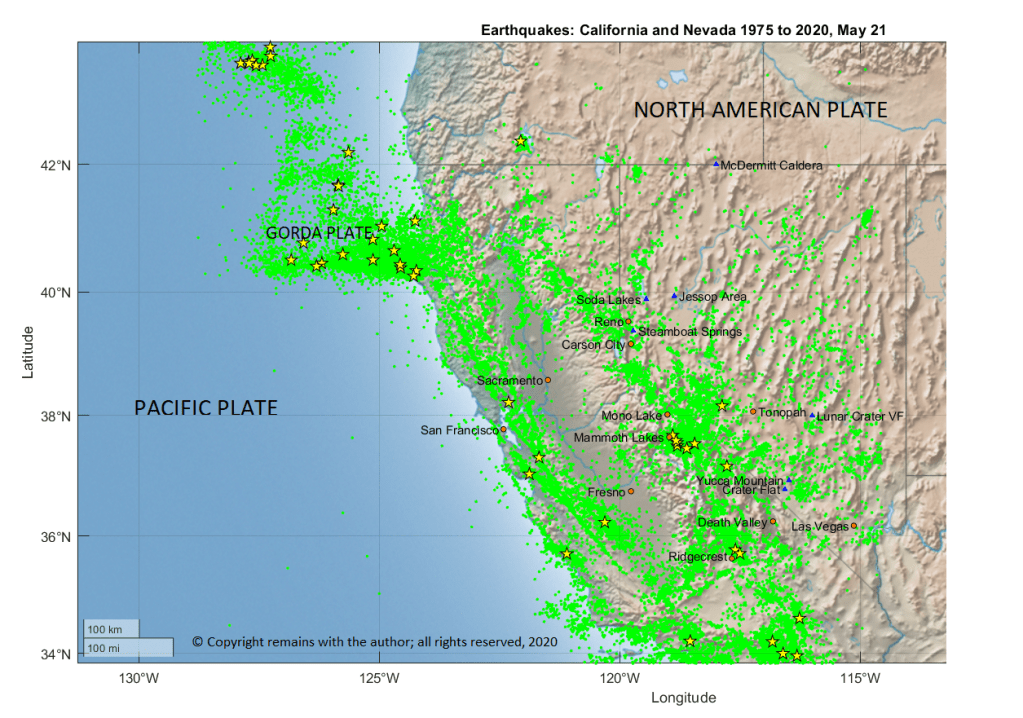
The North American Plate and Pacific Plates slide past each other at the San Andreas Fault(2) on the west coast of North America. There are small plates, the Gorda Plate(3) and Juan de Fuca Plates to the north of California, believed to be the remnants of the much larger Farallon Plate which subducted under the North American Plate.
The San Andreas Fault, a transform fault, accommodates 75+% of the relative motion between the North American and Pacific Plates. The Walker Lane Deformation Belt(4), itself, takes up between 15% to 25% of the boundary motion.
The Mendocino Fracture Zone(5) links the junction between the San Andreas Fault and Cascadia Subduction Zone to the Gorda Ridge on the western boundary of the Gorda Plate.
The Walker Lane Deformation Belt is a roughly 800km long trough, roughly aligned with the California / Nevada state border: the northern end lies at the junction of the Honey Lake Fault Zone, Warm Springs Valley Fault Zone, the Pyramid Lake Fault Zone and the southern boundaries of the Modoc Plateau and Columbia Plateau; and, the southern end lies at the intersection of Death Valley and the Garlock Fault.
The Eastern California shear zone is a portion of the Walker Lane Deformation Belt that links Owens Valley to the San Andreas Fault. It is an area that has produced several quakes of 7+M: 1872 Lone Pine quake in Owens Valley; 1992 Landers Earthquake; 1999 Hector Mine earthquake; and, most recently, the 2019 Ridgecrest swarm.
Seismic Activity 1975 to May 21, 2020
This swarm is not the first in the area. If we look at seismic activity in California and Nevada, we should see the activity from the Walker Lane Deformation Belt to the San Andreas Fault.
We downloaded earthquake data between 43.860°N, 128.786°W and 33.68°N, 114.548°W with magnitude over 2.5 from USGS’ site(1). In the plot below, we can see earthquakes clearly delineating the plate boundaries of the Gorda Plate, Pacific Plate and the North American Plate.
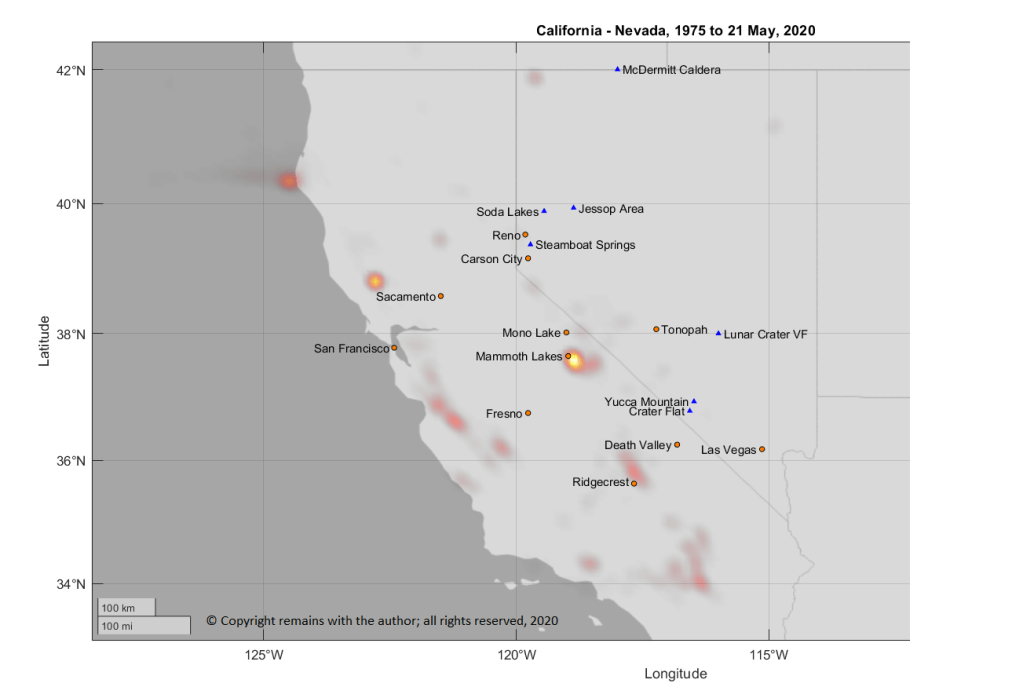
A geodensity plot of the above data set, weighted by earthquake magnitude, shows the areas of most activity: Mammoth Lakes, an area to the west of Sacramento, and the Mendocino Fracture Zone, east of the southern boundary of the Gorda Plate.
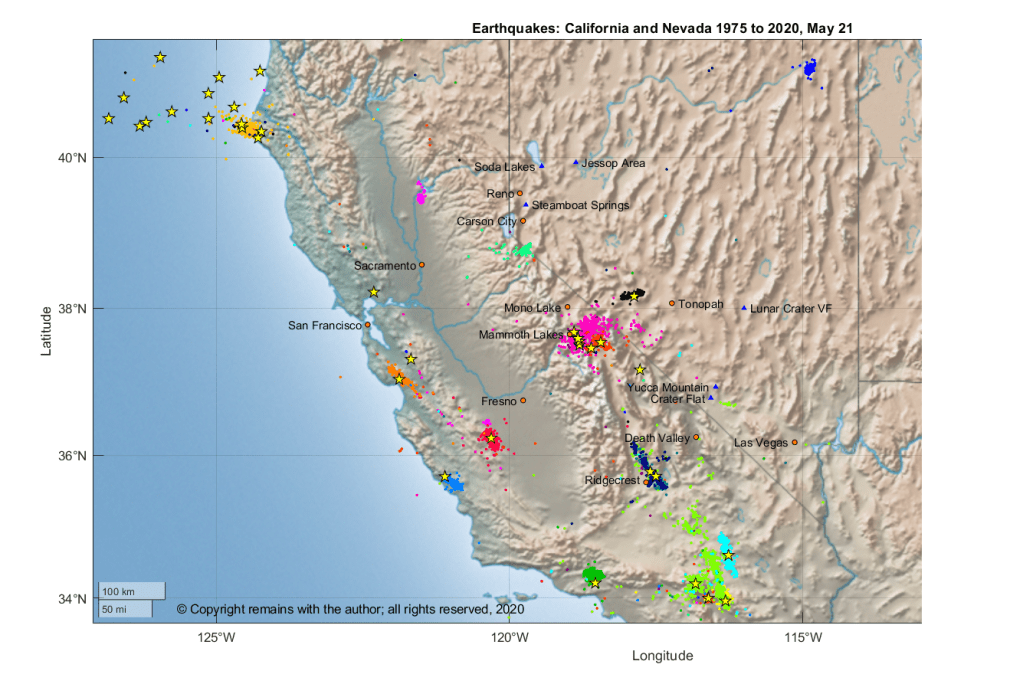
We looked through the data set to find the larger earthquake swarms; we found 17 swarms (groups of earthquakes exceeding 30 per day). With the exception of two swarms in April 1992, this was successful. In April 1992, there appears to be two swarms occurring at the same time so we split them based on geographic location.
The swarms correlate with the areas of activity displayed in the geodensity plot, with the exception of the area to the west of Sacramento. The activity to the west of Sacramento has not experienced any large swarms or quakes over 6.0.
Mammoth Lakes(6) is located near the Long Valley Caldera and Mammoth Mountain, an area of rhyolitic, rhyodacite and dacite lava domes and hot springs. Mammoth Mountain last erupted around 700 years ago, with a small phreatic eruption, but still produces large volumes of CO2.
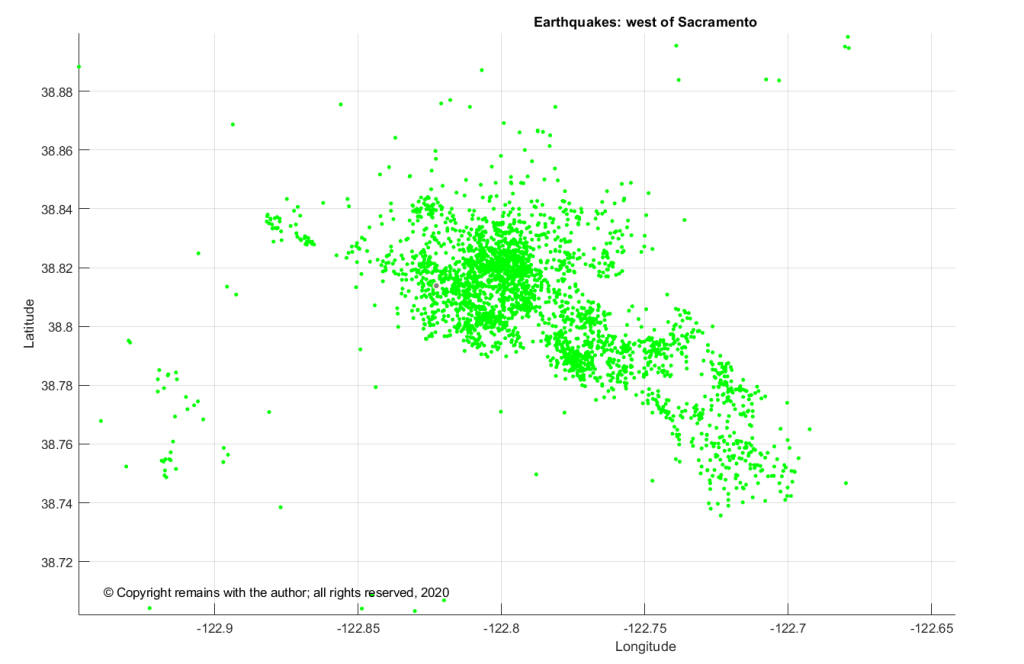
Looking more closely at the area to the west of Sacramento (38.74°N, 122.9°W to 38.86°N,122.7°W), we found that it has had 2,746 earthquakes spread consistently throughout the period from 1975 to May 21, 2020, of which the maximum magnitude was 5.01. the activity is located near Clear Lake(7), California, and the Clear Lake Volcanic Field. The Clear Lake Volcanic Field has not erupted for thousands of years but is not wholly inactive, with volcanic type earthquakes, hot springs and seepage of volcanic gas.
Although 44 years of earthquakes feels like a long period to study, this is a very short period of time geologically-speaking so any apparent trends may not be representative and, while very interesting and worthy of investigation, may not be enough for future predictions.
So how would geologists make predictions or update risk assessments? In addition to the type of work above, they would look at ground deformation and movement (the ground may stretch before fracturing), and, for volcanoes, volcanic gas emissions, and gravitational and temperature changes.
The Armchair Volcanologist
21 May 2020
© Copyright remains with the author; all rights reserved, 2020
References & Further Reading
Earthquake data was downloaded from USGS; the rest from Wikipedia.
- USGS https://earthquake.usgs.gov/
- San Andreas Fault, Wikipedia: https://en.wikipedia.org/wiki/San_Andreas_Fault
- Gorda Plate, Wikipedia: https://en.wikipedia.org/wiki/Gorda_Plate
- Walker Lane, Wikipedia: https://en.wikipedia.org/wiki/Walker_Lane
- Mendocino Fracture Zone, Wikipedia: https://en.wikipedia.org/wiki/Mendocino_Fracture_Zone
- Mammoth Lakes, Wikipedia: https://en.wikipedia.org/wiki/Mammoth_Lakes,_California
- Clear Lake, Wikipedia: https://en.wikipedia.org/wiki/Clear_Lake_(California)
Plots are the author’s own work.
