Good Afternoon!
It’s back to Iceland to finish off a post I started before being diverted by the earthquake swarm in Nevada.
Having looked at the recent activity at the Reykjanes Peninsula, let’s now look at the Tjörnes Fracture Zone, where the Mid Atlantic Ridge leaves Iceland to head northwards. Here, current seismic activity is predominantly tectonic. Our study is based on the same data set used for the introduction to Iceland and the Reykjanes Peninsula (earthquake data downloaded from the Icelandic Meteorological Office(1) from January 2016 to April 12, 2020, updated to May 3, 2020).
Geological Setting
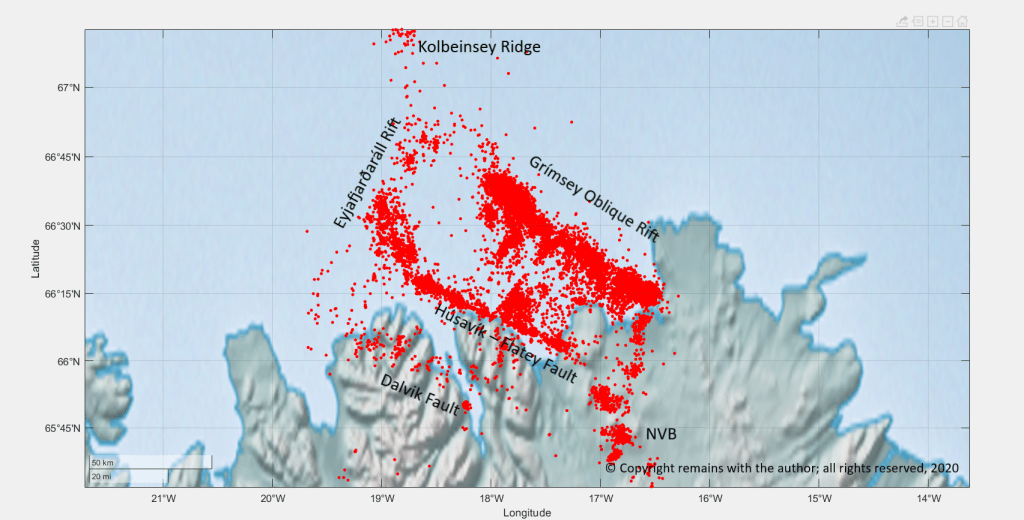
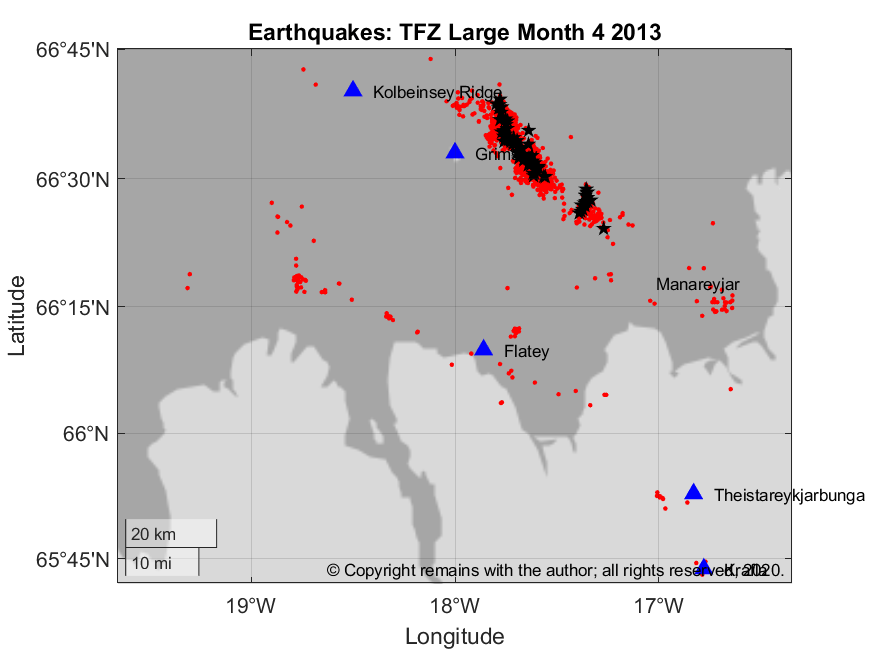
The Tjörnes Fracture Zone (TFZ) is a complex area of transform and extensional faulting connecting the Kolbeinsey Ridge, the Western Volcanic Zone and the Northern Volcanic Zone. The Kolbeinsey Ridge, itself, is slow spreading at a rate of 10mm per year. The main faults in the area are: the EyjaFjarðaráll Rift, the Húsavík-Flatey Fault (the TFZ, itself), the Grímsey Oblique Rift and the Dalvik Fault. Both hydrothermal and seismic activity cluster on the faults. The Húsavík-Flatey Fault has produced earthquakes with magnitudes in the region of 7.0.
Grímsey is an inhabited island on the Arctic Circle. Its main industries are fishing and tourism(2).
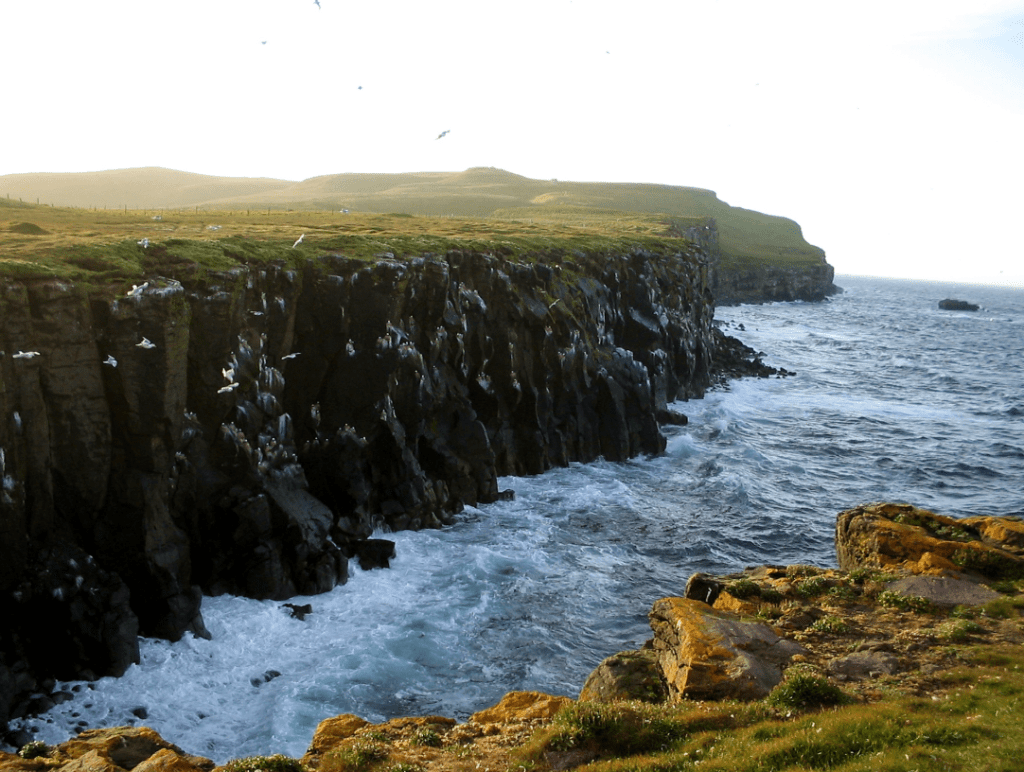
Flatey is a small island in Skjálfandi Bay in northern Iceland. It is inhabited in the summer for the tourist season, being home to puffins, terns whimbrels and plovers, amongst others(3).
According to GVP(4) a submarine eruption occurred in 1868 on the Manareyjar Ridge, north of Manareyjar Island, at the south eastern end of the system; the lavas were basalt / picro basalt. A submarine eruption or dyke intrusion in 1999 caused an earthquake swarm 180km north of Grimsey and 100km north of Kolbeinsey Island on the Southern Kolbeinsey Ridge. Volcanic activity occurred in 1372 and 1755, but its whereabouts is unclear.
Seismic Activity
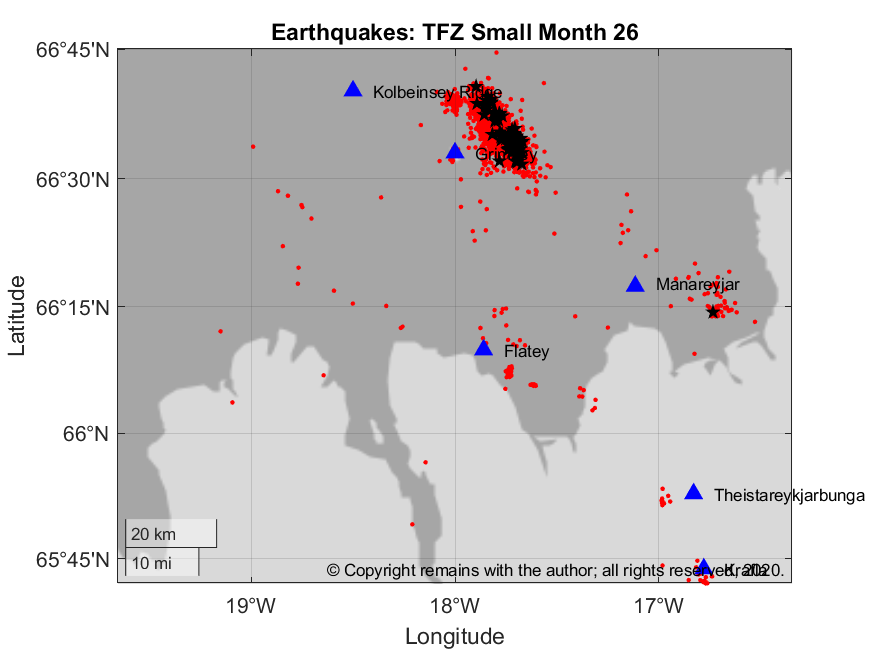
In the period from January 2016 to May 3, 2020, there were 26,762 earthquakes reported by the Icelandic Meteorological Office (IMO)(2) for the region. 131 earthquakes had a magnitude of 3.0 or more; 67 occurred in month 26 (February 2018) on the Skajálfandadujúp Rift, 52 miles ENE of Grímsey, the largest of which was 5.21M.
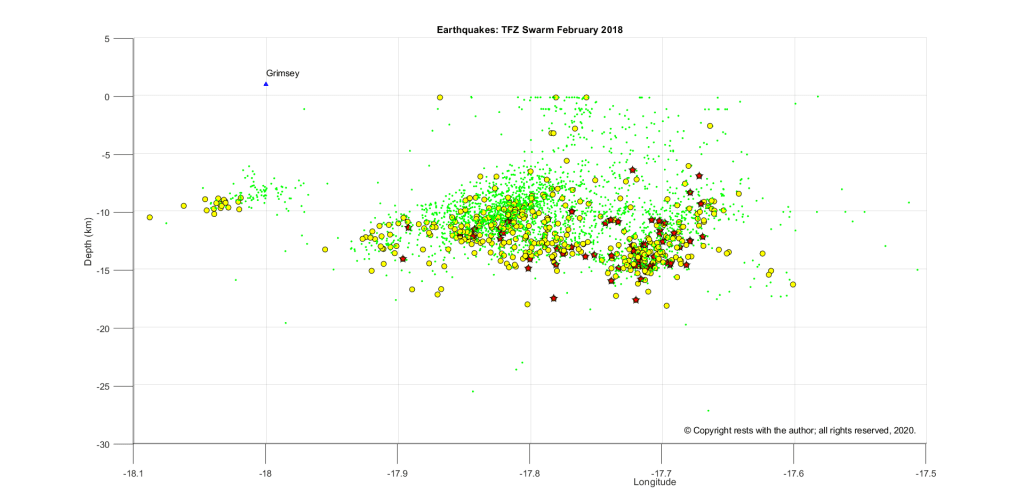
A depth plot of the February 2018 swarm shows that most earthquakes over 3.0M occur in the lithosphere.
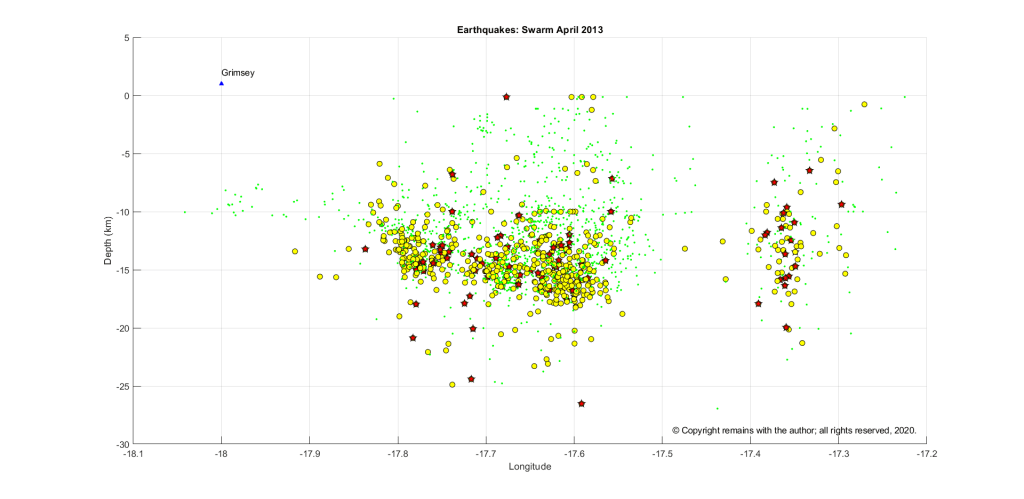
According to IMO, these swarms have occurred before; the most recent being in May & September 1969, December 1980, September 1988 and April 2013. The data for most of the earlier swarms is not publicly available on IMO’s website, but we can get data for the April 2013 swarm. In that swarm, there were 84 earthquakes with a magnitude of 3 or more; the largest of which had a magnitude of 5.37.
A depth plot of this swarm shows that most earthquakes over 3.0M also occurred in the lithosphere.
How does this compare to the activity on the Reykjanes Peninsula?
In the Tjörnes Fracture Zone, most seismic activity is occurring in the lithosphere. There is no reported volcanic activity associated with the two swarms we looked.
Apart from the recent large swarm, the Reykjanes Peninsula shows much less activity in the same period; again, most activity was in the lithosphere. The recent swarm, itself, was atypical (still ongoing at the time of writing, but at a reduced rate) and accompanied by ground uplift – hence the increased monitoring put in place there.
I am not Icelandic so apologies for any typos in Icelandic names.
The Armchair Volcanologist
29 May 2020
© Copyright remains with the author; all rights reserved, 2020
References & Further Reading:
- Icelandic Meteorological Office: https://en.vedur.is
- Grímsey: https://en.wikipedia.org/wiki/Grímsey
- Flatey, Skjálfandi: https://en.wikipedia.org/wiki/Flatey,_Skjálfandi
- Smithsonian Institution Natural History Museum Global Volcanism Program (GVP): https://volcano.si.edu
- “Present Kinematics of the Tjörnes Fracture Zone North Iceland, from campaign and continuous GPS measurements”, Sabrina Metzger, Sigurjón Jónsson, Gillis Danielsen, Sigrún Hreinsdóttir, François Jouanne,Domenico Giardini, Thierry Villemin, Geophysical Journal International, Volume 192, Issue 2, 1 February 2013, Pages 441–455, https://doi.org/10.1093/gji/ggs032
Credits:
Raw earthquake data downloaded from the Icelandic Met Office: https://en.vedur.is
Plots are the author’s own work.
