Good evening!
New Earthquake Plots
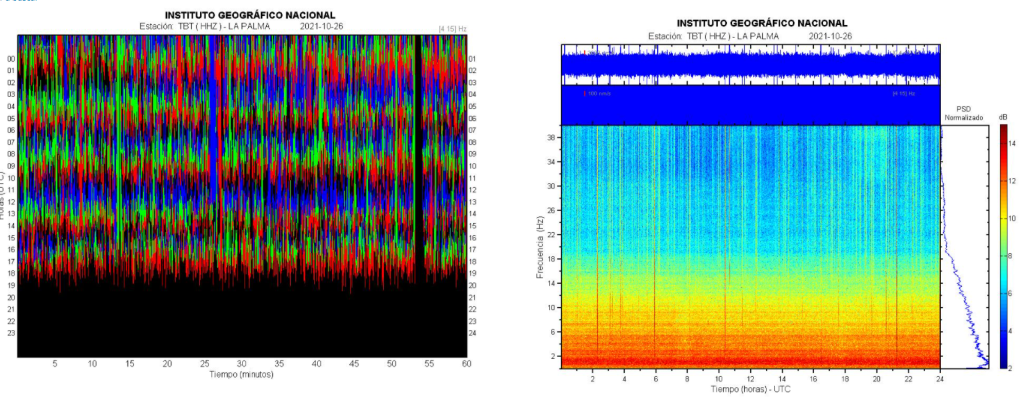
It has been a week since we updated our last earthquake plots for La Palma so time to take another look. The eruption has continued in the meantime, with seismicity and seismic signals increasing. Earthquake activity continues mainly within the two levels 7 -16km and 30 to 42km identified in our previous plots.
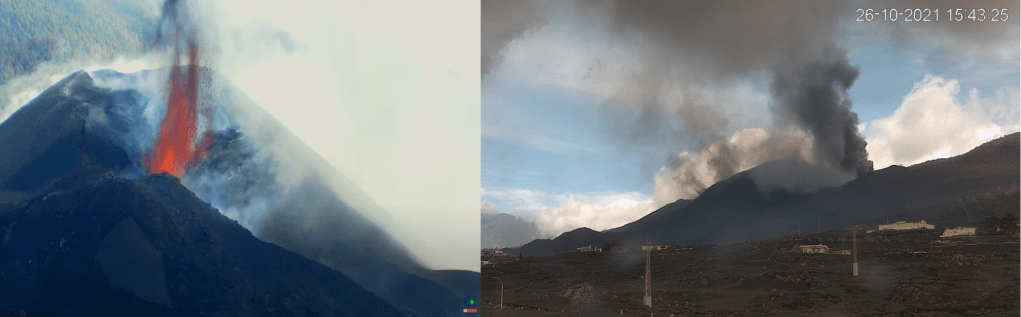
Several partial collapses of the main cone have occurred. The latest was yesterday, releasing a large amount of the lava to the west, which went over existing lava flows.
The latest statistics reported on 26th October 2021 are:
- 908.2 hectares of land have been affected by lava.
- 2,162 buildings haven been destroyed by lava, with a further 124 suffering damage.
- 66.2km of roads have been lost, with a further 3.4km damaged.
- 6,800 hectares of land have been covered by ashfall (reported 22nd October 2021).
- Cost of lost banana plantations c.100m Euros, 150 hectares are under lava and others are in the exclusion zones; other crops, vineyards and livestock farming are also impacted.
- SO2 emissions 40,800 tons per day. CO2 emissions up.
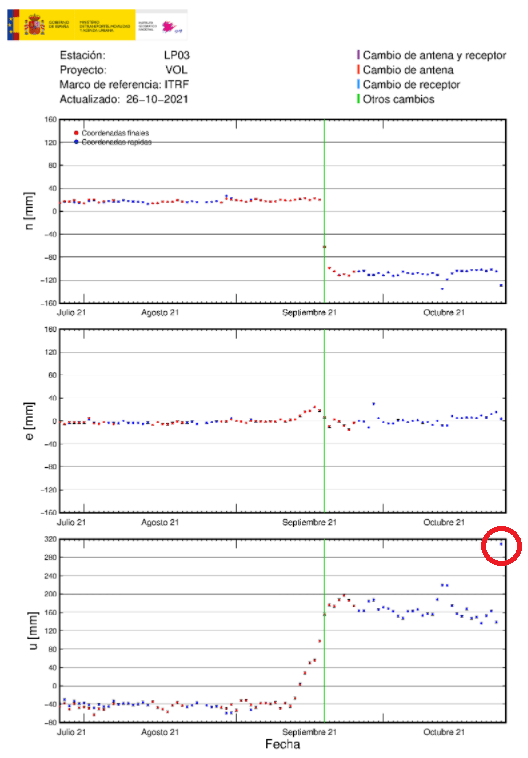
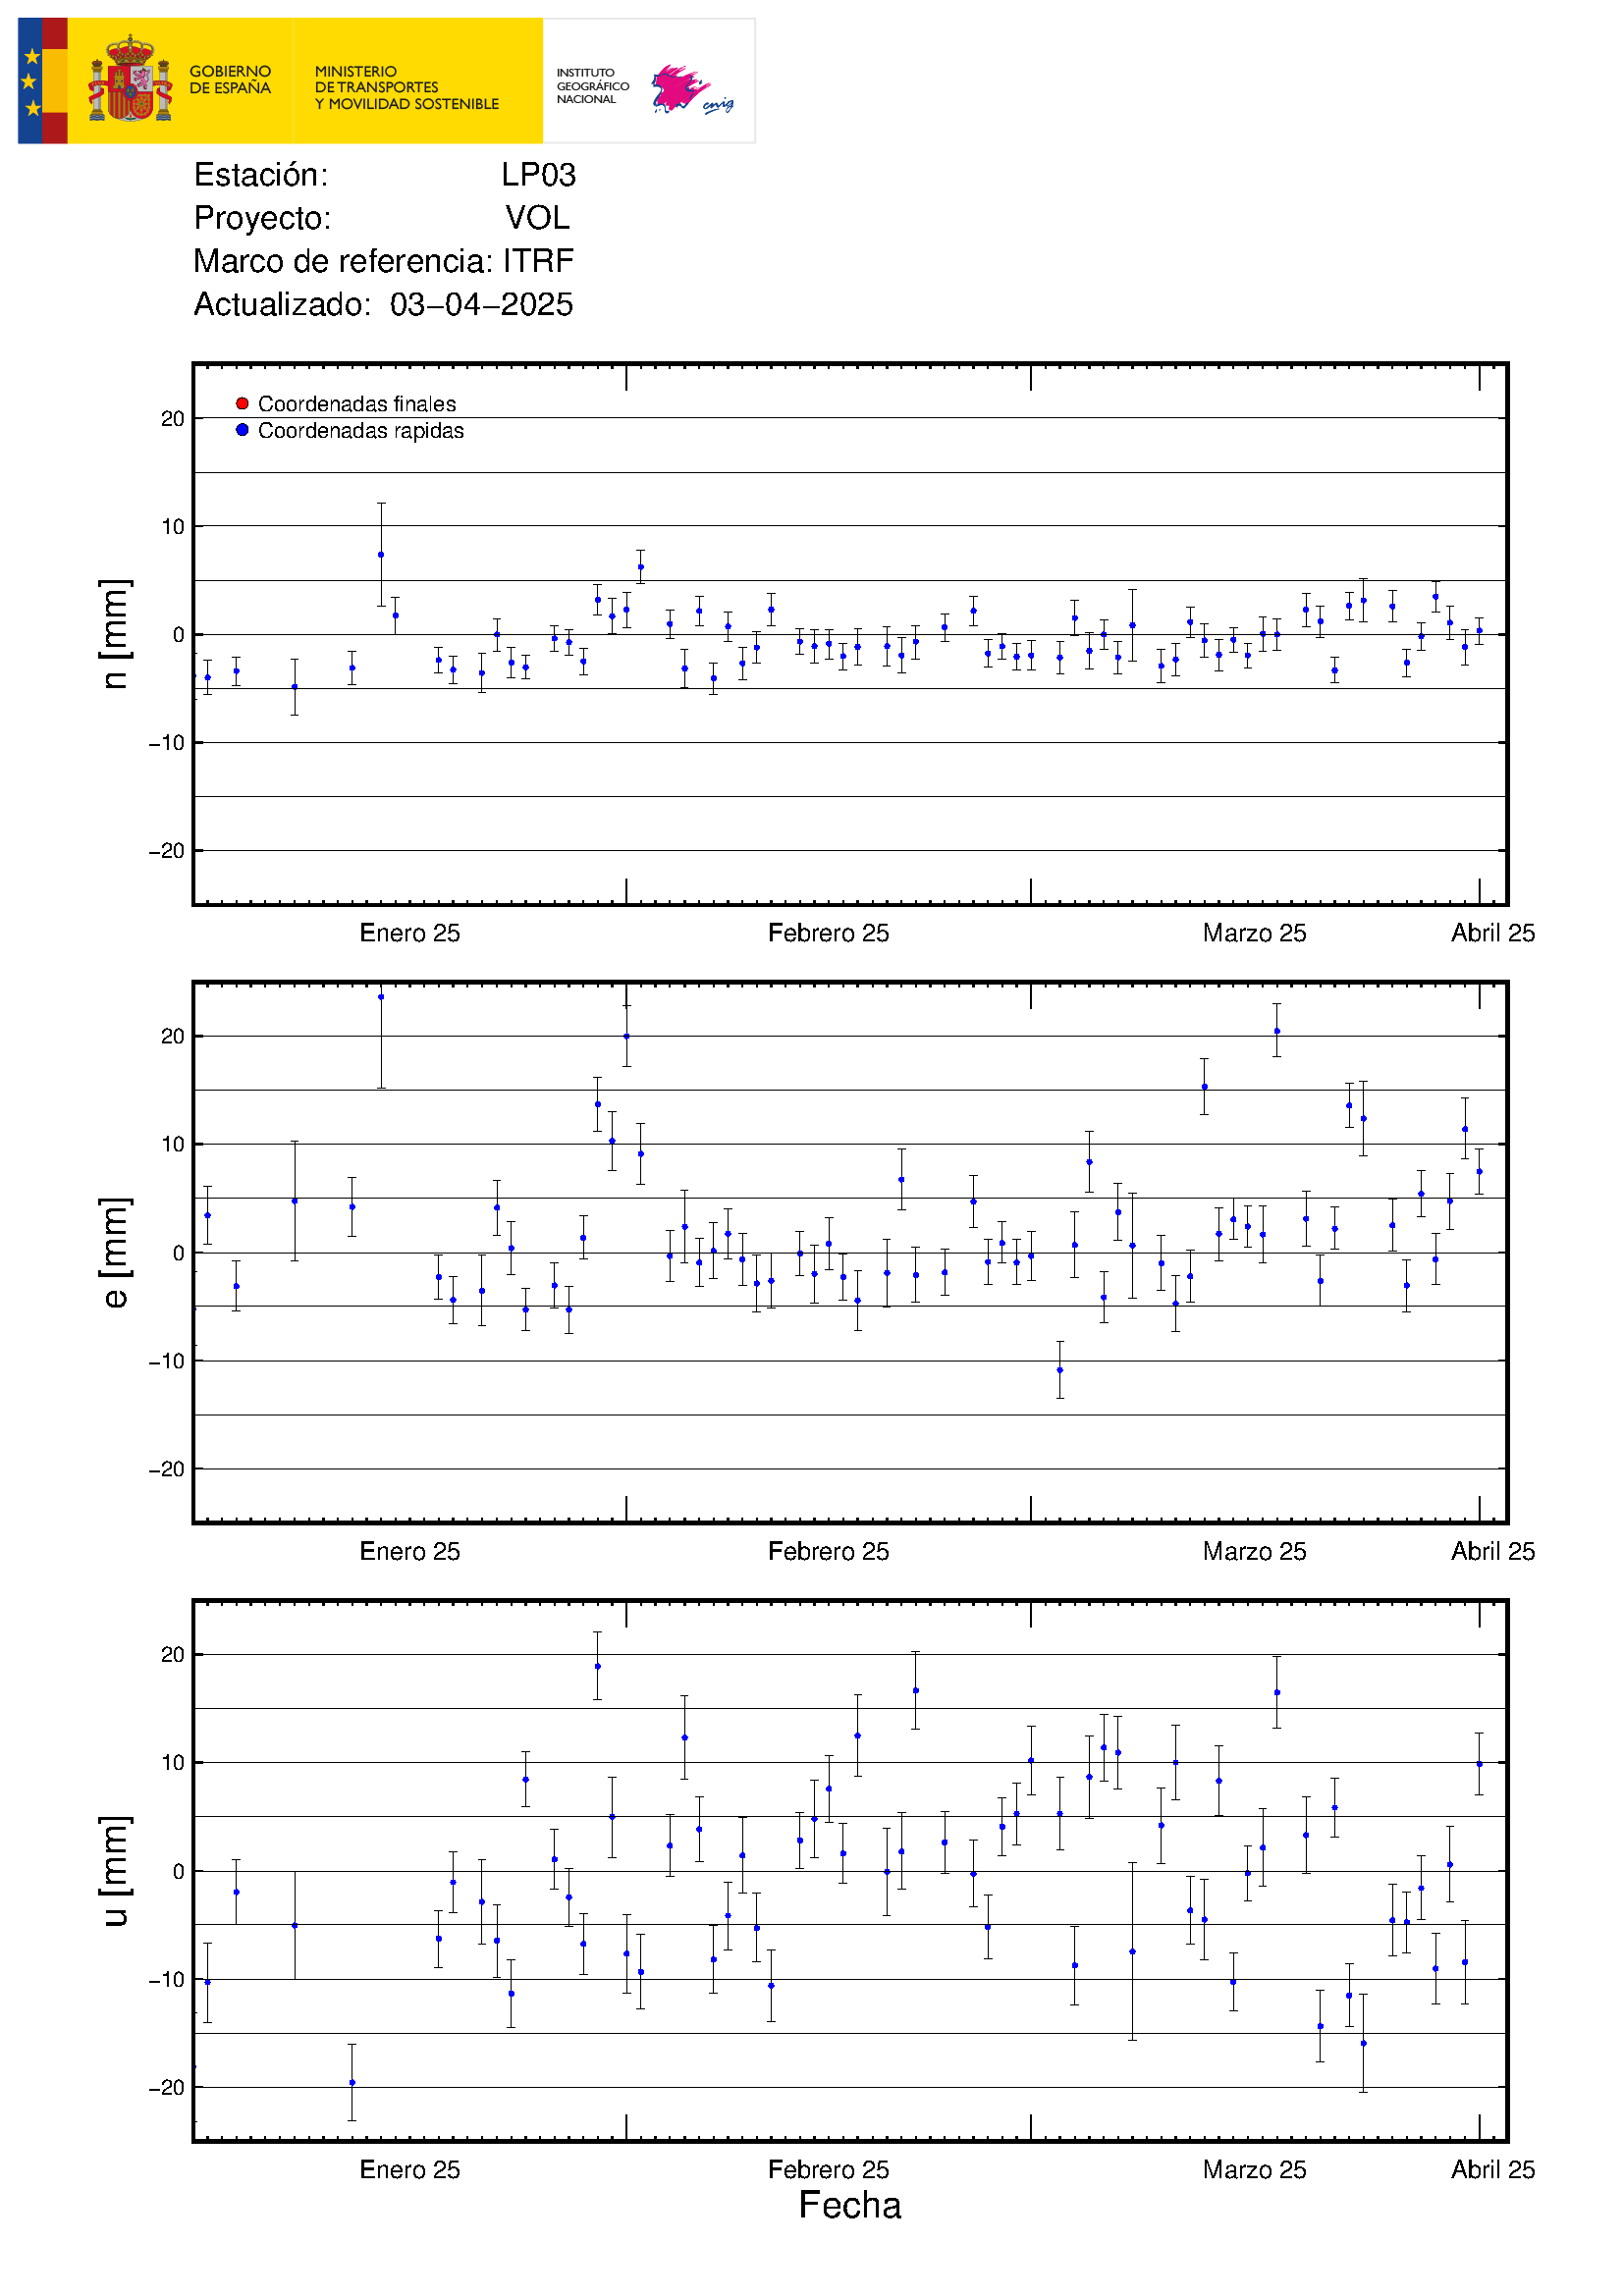
In the last 24 hours ground uplift of 10cm has been recorded at the station on the south of the volcano near the eruption site, which the volcanologists monitoring the eruption think may signal an increase in lava flow or the opening of a new vent.
Recent Seismicity
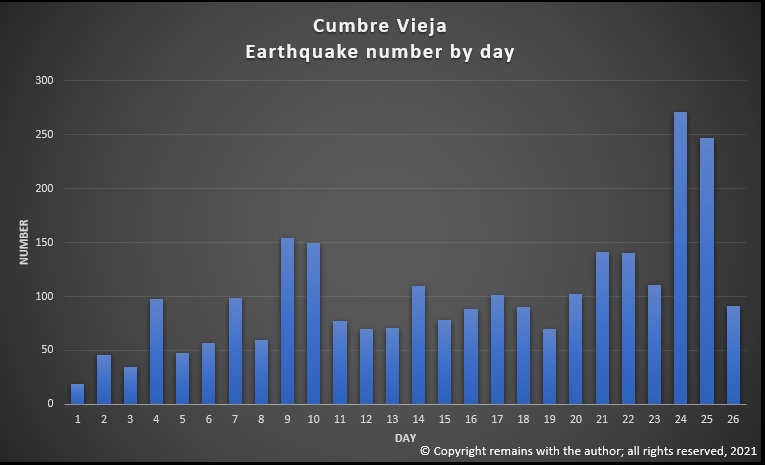
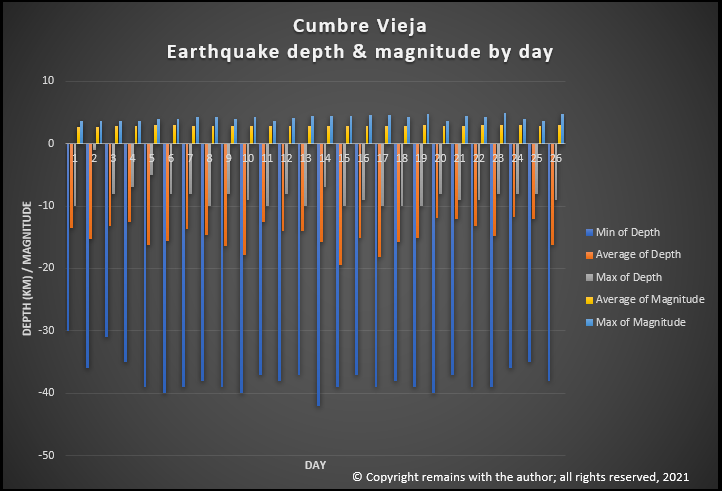
We have made geoscatter and scatter plots of the swarm from day 21, the onset of the deeper earthquakes. We have also made plots of the earthquakes over 3.0M, as these tend to get lost in the in the middle level swarm (7-16km).
There are now a few earthquakes between the two swarms but little in the way of reported earthquakes heading for the surface; the latter may mean that lava is flowing freely through the existing conduit, or that a new conduit may be in the offing. The hike in ground deformation reported above near the eruption site may indicate that whatever ensues, it is likely to be near the current eruption site – speculation on our part.
The eruption is now in its sixth week, lasting longer than recent previous eruptions, with no sign of waning. Has the initial eruption of magma created the right conditions for new magma to erupt from a greater depth, e.g. by creating a pathway for it and/or removing some of the constraining pressure? Only time, and a lot of research by the experts, will tell.
Armchair Volcanologist
© Copyright remains with the author; all rights reserved, 2021.
Sources
News reports: El Mundo, https://www.elmundo.es and El Time, https://www.eltime.es/
Raw earthquake data: Instituto Geográfico Nacional (ign.es)
