Tag Archives: ground deformation

Cumbre Vieja Eruption, Update 19 November 2021

Good evening!

The eruption of Cumbre Vieja continues unabated with Strombolian activity, lava fountains from many vents, lava flows, and ash emissions. .  As of 16 November 2021, Copernicus reported that 1,042.1 hectares of land have been covered by lava.  Rainfall now adds to the hazards created by volcanic ash.  The cone reached a height of 1,130m by 10 November 2021. Sadly, one fatality has occurred; one person who had gone to assist with ash clearance was found dead in his home.

Fig 1: Screenshot on 19/11/2021 from RTVC’s webcam monitoring the eruption.  Source: DIRECTO | Erupción del volcán en La Palma – YouTube

Seismicity picked up again in the last few days along with a ground uplift detected at GPS stations LP03 and LP06.

Fig 2: Earthquake count by day by the author for earthquakes from 11/09/2021 to 19/11/2021 (part day), created from publicly available earthquake data provided by IGN.  © Copyright remains with the author; all rights reserved, 2021.
Fig 3: Ground deformation at GPS stations LP03 and LP06.  Source: IGN

 To date there have been 5 earthquakes of 5 Mag. or more.

Fig 4: List of earthquakes greater than or equal to 5 Mag. for earthquakes from 11/09/2021 to 19/11/2021 (part day), extracted from publicly available earthquake data provided by IGN.  © Copyright remains with the author; all rights reserved, 2021.

Here are updated earthquake plots.  All of the action is centred around two depths: 7 -16 km and 30 -39 km, with a very few earthquakes in between; there are a few earthquakes with depths of more than 39 km.

Fig 5: Earthquake count by depth by the author for earthquakes from 11/09/2021 to 19/11/2021 (part day), extracted from publicly available earthquake data provided by IGN.  © Copyright remains with the author; all rights reserved, 2021.

For the updated video, we have provided the scatter plots for only earthquakes greater than  or equal to 3.0 Mag. because the smaller earthquakes obscure the action; all earthquakes are included in the geoscatter plots.

Fig 6: Video by the author of geoscatter plots for earthquakes from 11/09/2021 to 19/11/2021 (part day) and scatter plots of earthquakes greater than or equal to 3.0 Mag. for the same period.  © Copyright remains with the author; all rights reserved, 2021.

Magma still appears to be stalling at the two depths: 7 -16 km and 30 -39 km prior to ascent (refer to La Palma: Earthquakes and Magma Plumbing for more information).  How much of it reaches the surface remains to be seen.

Armchair Volcanologist

© Copyright remains with the author; all rights reserved, 2021.

Sources:

Raw earthquake data: Instituto Geográfico Nacional (IGN)

Other links are provided in the text.

La Palma, Update 26.10.2021

Good evening! 

New Earthquake Plots

It has been a week since we updated our last earthquake plots for La Palma so time to take another look.  The eruption has continued in the meantime, with seismicity and seismic signals increasing.  Earthquake activity continues mainly within the two levels 7 -16km and 30 to 42km identified in our previous plots.

Fig 1: screenshots of the eruption 26.10.2021 from local webcams: left, TV Canarias live stream (source: https://www.youtube.com/watch?v=INvrtMg5tSQ); and, right, Hotel Galeon (source: https://eruption.acme.to/slideshow.php?getcam=hotelelgaleon)  (still photos).

Several partial collapses of the main cone have occurred.  The latest was yesterday, releasing a large amount of the lava to the west, which went over existing lava flows.

The latest statistics reported on 26th October 2021 are:

  • 908.2 hectares of land have been affected by lava. 
  • 2,162 buildings haven been destroyed by lava, with a further 124 suffering damage.
  • 66.2km of roads have been lost, with  a further 3.4km damaged.
  • 6,800 hectares of land have been covered by ashfall (reported 22nd October 2021).
  • Cost of lost banana plantations c.100m Euros, 150 hectares are under lava and others are in the exclusion zones; other crops, vineyards and livestock farming are also impacted.
  • SO2 emissions 40,800 tons per day. CO2 emissions up.

In the last 24 hours ground uplift of 10cm has been recorded at the station on the south of the volcano near the eruption site, which the volcanologists monitoring the eruption think may signal an increase in lava flow or the opening of a new vent.

Fig 2: Ground deformation at the station nearest the eruption site.  We have circled the latest data point to make it easier to spot.  Green line marks the onset of the eruption (added by IGN). Source: IGN
Fig 3: Seismic signal today.  Source: IGN

Recent Seismicity

Fig 4:  Plot by the author of earthquake number by day; Day 1 is 1 October 2021, Day 26 is 26 October 2021.  © Copyright remains with the author; all rights reserved, 2021.
Fig 5:  Plot by the author of earthquake depth and magnitude by day; Day 1 is 1 October 2021, Day 26 is 26 October 2021.  © Copyright remains with the author; all rights reserved, 2021.

We have made geoscatter and scatter plots of the swarm from day 21, the onset of the deeper earthquakes.  We have also made plots of the earthquakes over 3.0M, as these tend to get lost in the in the middle level swarm (7-16km). 

Fig 6: Geoscatter and scatter plots of the earthquakes between 1st October 2021 and 26th October 2021 (08:06:14) by the author.  © Copyright remains with the author; all rights reserved, 2021.
Fig 7: Geoscatter and scatter plots of the earthquakes greater than 3.0M between 1st October 2021 and 26th October 2021 (08:06:14) by the author.  © Copyright remains with the author; all rights reserved, 2021.

There are now a few earthquakes between the two swarms but little in the way of reported earthquakes heading for the surface; the latter may mean that lava is flowing freely through the existing conduit, or that a new conduit may be in the offing.  The hike in ground deformation reported above near the eruption site may indicate that whatever ensues, it is likely to be near the current eruption site – speculation on our part.

The eruption is now in its sixth week, lasting longer than recent previous eruptions, with no sign of waning. Has the initial eruption of magma created the right conditions for new magma to erupt from a greater depth, e.g. by creating a pathway for it and/or removing some of the constraining pressure? Only time, and a lot of research by the experts, will tell.

Armchair Volcanologist

© Copyright remains with the author; all rights reserved, 2021.

Sources

News reports: El Mundo,  https://www.elmundo.es  and El Time, https://www.eltime.es/

Raw earthquake data: Instituto Geográfico Nacional (ign.es)

A Quick Update for Grímsvötn: Alert level: Yellow

The Icelandic Met Office (IMO) has updated the aviation alert for Grímsvötn from green to yellow today (30.09.2020) because the volcano’s activity is above background level, now at a level comparable to that which preceded previous eruptions.  They note:

  • Above average seismicity for September 2020;
  • Deepening cauldrons in the ice-cap round the caldera from geothermal activity;
  • Surface deformation exceeding that which preceded the 2011 eruption;
  • Magmatic gases detected in the summer of 2020.

An eruption is not considered imminent.

Water levels in the sub-glacial lake are high indicating possible jökulhlaups in the coming months.   Draining of the lake by a jökulhlaup depressurised the system before the 2011 eruption, so an eruption is considered possible in the event of a jökulhlaup.

Activity may decrease without an eruption in this instance; only time will tell.

Jumping the gun a bit on our next post in the volcanic risk mitigation series, the IMO’s alert is an example of using alert levels to highlight the increased risk of an eruption to those who need to know, without being unduly alarmist – a straightforward statement of the facts supporting the current status. For the exact wording of the alert, please follow the link below.

Fig 1: Eruption column 3 hours after the onset of the 2011 eruption of Grímsvötn. Source: Sigurjónsson, O. (2011 May 21). Grímsvötn: photo 10 of 14. Retrieved from http://icelandicvolcanoes.is/?volcano=GRV

Grímsvötn is located under the Vatnajökull ice-cap in an active rift zone of the Eastern Volcanic Zone, Iceland. She erupts frequently; her last in 2011 was a large VEI 4, which impacted local farmers and livestock and aviation in Europe.

Update (02/10/2020)

Googling around a bit more, I note that Iceland’s Department of Civil Protection and Emergency Management, Almannavarnir, have reported in their 25 September 2020 bulletin that an eruption is considered likely this Autumn (use Google Translate or other tool, if you need to, as it is in Icelandic).

For more information, please visit IMO.

The Armchair Volcanologist

30 September 2020

Source and Further Reading:

Icelandic Met Office: https://en.vedur.is/   &  https://en.vedur.is/about-imo/news/the-aviation-color-code-for-grimsvotn-changed-from-green-to-yellow

Almannavarnir: https://www.almannavarnir.is/frettir/

Google Translate: https://translate.google.com/

Famous Eruptions – Introduction

All good books on volcanoes describe well-known eruptions, including Vesuvius 79 AD, Tambora 1815, Krakatau 1883, Mount Peleé 1902, Katla 1918, Mount St. Helens 1980, Pinatubo 1991.  Who are we to be any different?

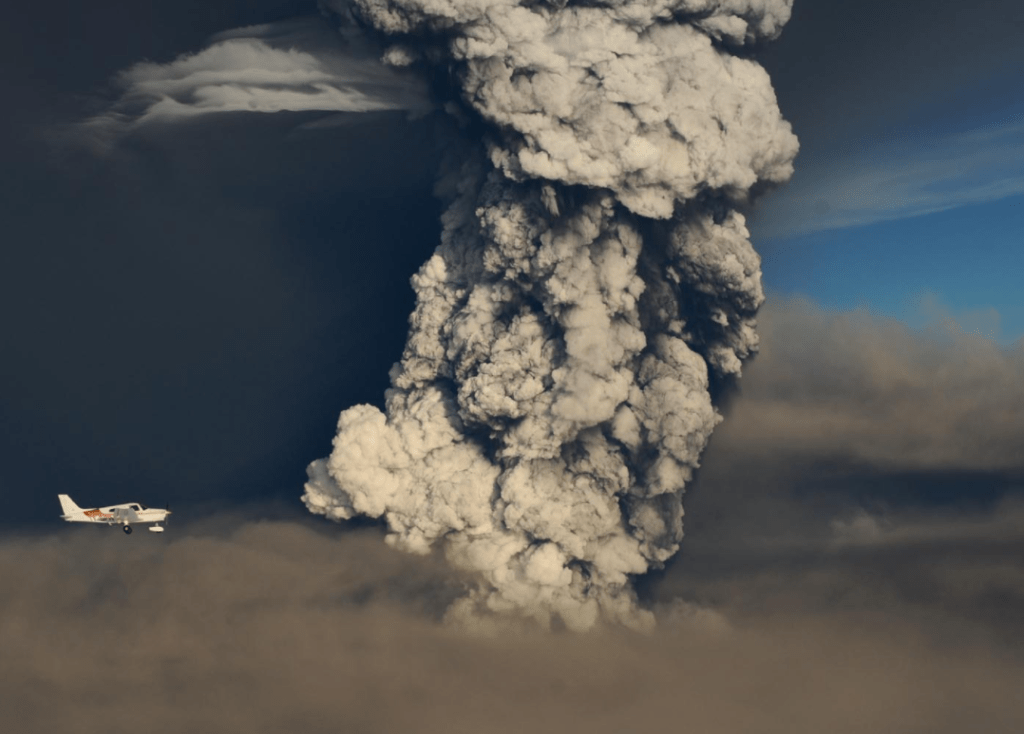
There is a good reason for this. Most famous eruptions are large and explosive, causing loss of life and considerable property damage – in other words, headline-grabbing.   Later eruptions have impacted aviation – volcanic ash and jet engines are not a good mix; airports near erupting volcanoes are closed and flights re-routed to avoid the ash clouds. 

Catastrophic events are the reason volcanology is such an important subject. Understanding these and other eruptions is important to find out how to minimise the risk; i.e. reduce loss of life.

Researchers have shown that volcanoes usually very kindly give us some warning in the lead up to an eruption.  Magma is viscous, rarely moves fast and, when moving, causes earthquakes, usually small, but some are felt without equipment.  As magma ascends, degassing starts to occur, some of which is detectable at the surface.  Rising magma also causes ground deformation, e.g.  it causes the volcano to inflate, measurable by tilt-meters and GPS, and some of which may even be visible to the naked eye (Mount St Helens). 

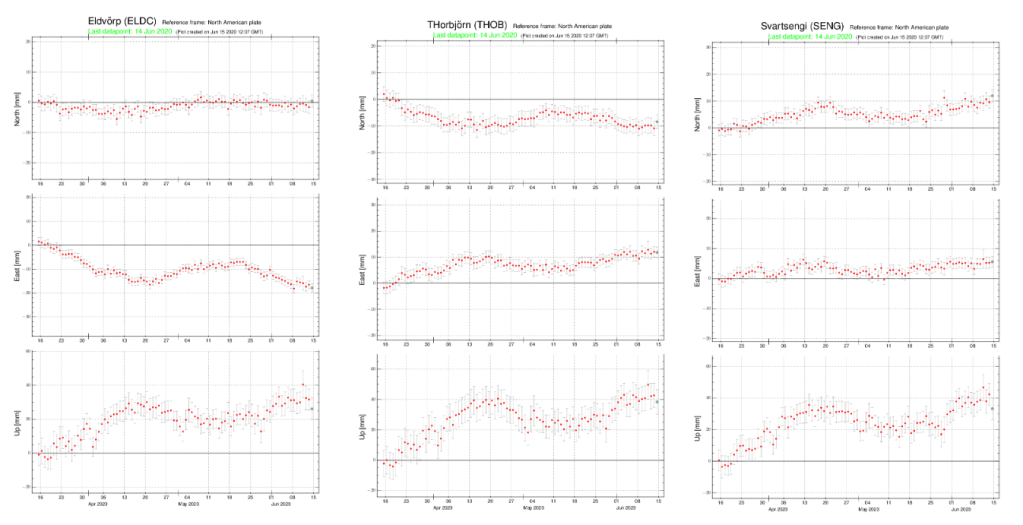
I read somewhere that the first piece of equipment required to monitor a volcano is a seismometer, the second is another seismometer, as is the third; earthquakes are often the first sign of impending trouble (if I can remember / find the source, I will accredit it properly). Scientists observing volcanoes will have a raft of equipment in place: seismometers, GPS stations, tilt-meters and gas monitoring; satellite monitoring may also detect ground deformation.  Drones may be used to inspect craters which are not readily accessible or where it would be unsafe to visit. Our maps of Iceland include some GPS stations as markers to indicate where the earthquakes are occurring but still evidence that Iceland has several in place at its active volcanoes.

Given that volcanoes give some warning, why are people killed?  Unfortunately, magma ascent and the build up to an eruption is a slow process with many stops and starts.  A major eruption may be preceded by a few small throat clearing events before the volcano unleashes the main eruption. An evacuation may take place, but if it is quiet between the precursors and the main event, people may think that the volcano has finished and return home to be at ground zero at the wrong time, irrespective of whether or not any alert is in place. People living close to volcanoes tend to be farmers with strong bonds to both their land and livestock. On the other hand, the volcano may not behave as expected – e.g. a phreatic eruption or edifice failure.  Volcano hazard assessment is an interesting topic for future posts.

We will also look at some of the more famous eruptions over the coming weeks.

We’ve already touched a bit on Katla (The Katla Volcanic System, Myrdaksjökull – the not so cuddly Katla) and Mount St Helens (Mount St Helens – 18 May 1980 Eruption) so we’ll carry on by looking at Tambora’s 1815 eruption (Tambora 1815).

The Armchair Volcanologist

7 July 2020

A Quick Update on Activity on the Reykjanes Peninsula

Good Afternoon!

The earthquake swarm which started in December 2019 is continuing, let’s have a quick update on the stats.

Statistics

There have been 19,675 earthquakes in the Reykjanes Peninsula area 64.4°N, 23.0°W to 63.7°N, 21.0°W for the period 1 Jan 2016 to 14 June 2020, of which 14,258 (72%) have occurred in the last six months, most associated with the swarm near Svartsengi.

Fig 1: Statistics for the earthquake swarm to date by the author.  Month from start refers to the start of our data extraction (January 2016). © Copyright remains with the author; all rights reserved, 2020.

Seismic Activity

Our updated scatter plots show that there is more shallow small earthquake activity above the lithosphere than in our earlier plots. 

Fig 2: Latitude v Longitude geoscatter plot and depth plot for earthquake activity in the vicinity of Svartsengi 1/01/2016 to 14/06/2020 by the author.  Green dots denote earthquakes <2M; yellow dots, earthquakes greater than or equal 2.0M and less than 3.0M; red stars, greater than or equal to 3M.  © Copyright remains with the author; all rights reserved, 2020

Geodensity Plots

The geodensity plots for months 48 (December 2019) onwards (Figs 3.1 and 3.2) show that the most intense action started to the east of Mt Thorbjörn and has migrated west to Svartsengi and beyond.

Fig 3.1 Geodensity plots: top row months 48 and 49 (December 2019 and January 2020); bottom row month 50 and 51 (February 2020 March 2020) by the author. Note that the colour intensity is calculated based on the data set for the specified month. © Copyright remains with the author; all rights reserved, 2020
Fig 3.2 Geodensity plots: top row months 52 and 53 (April 2020 and May 2020); bottom row month 54 (June 2020, to 14/06/2020) by the author. Note that the colour intensity is calculated based on the data set for the specified month.  © Copyright remains with the author; all rights reserved, 2020.

Uplift

IMO has confirmed that uplift has resumed in the vicinity of Mount Þorbjörn.  Ground deformation is clearly visible on the GPS plots.

Fig 4: Uplift in the vicinity of Mt Þorbjörn as shown in recent GPS plots published by IMO: GPS Þorbjörn. THOB moved south eastwards, SENG moved north eastwards and ELDC moved westward; all showed uplift.

Summary

We are still looking at an unusually large swarm, accompanied by continued uplift in the vicinity of Mt Þorbjörn.

At the time of writing, there has been no change in the uncertainty phase declared by Icelandic Civil Protection .

The Armchair Volcanologist

15 June 2020

Sources:

Raw earthquake data and GPS plots downloaded from the Icelandic Met Office: https://en.vedur.is

Earthquake plots are the author’s own work.

© Copyright remains with the author; all rights reserved, 2020