Tag Archives: Askja

Updates on Activity at Fagradalsfjall, Cumbre Vieja, and Askja as of October 2021

We are no longer updating this post; future updates will be included in new posts.

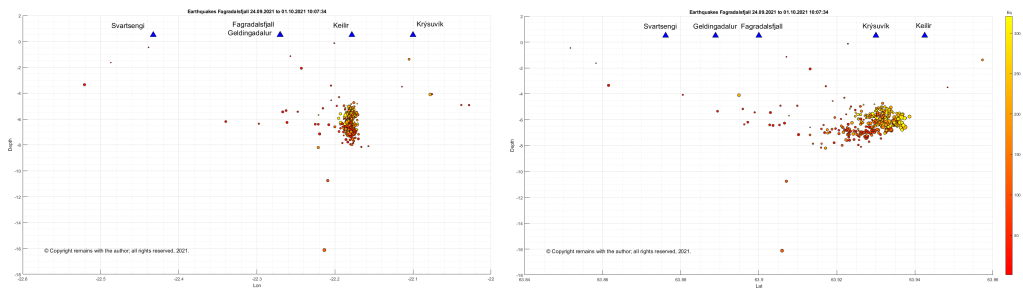
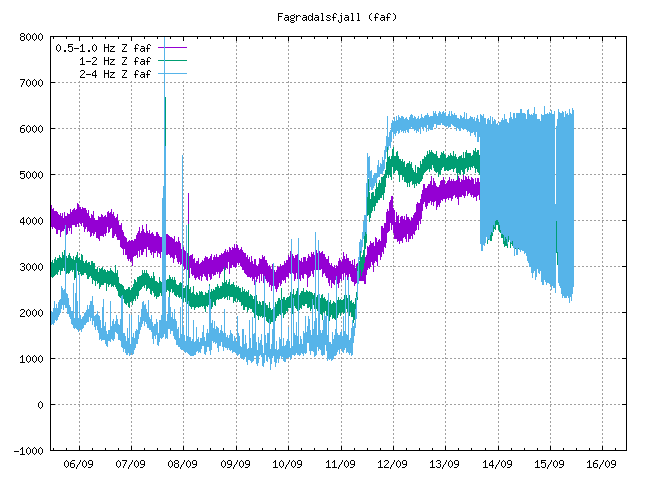
Update 2 12.10.2021: Plots of the Earthquake Swarm SSW of Mount Kelir, 27/09/2021 to Date

Fig 16: Mount Kelir, cropped from an image by Michal Klajban, published under CC BY-SA 4.0.  Source: Wikimedia Commons

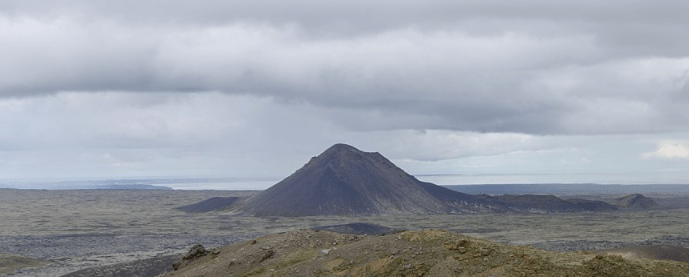
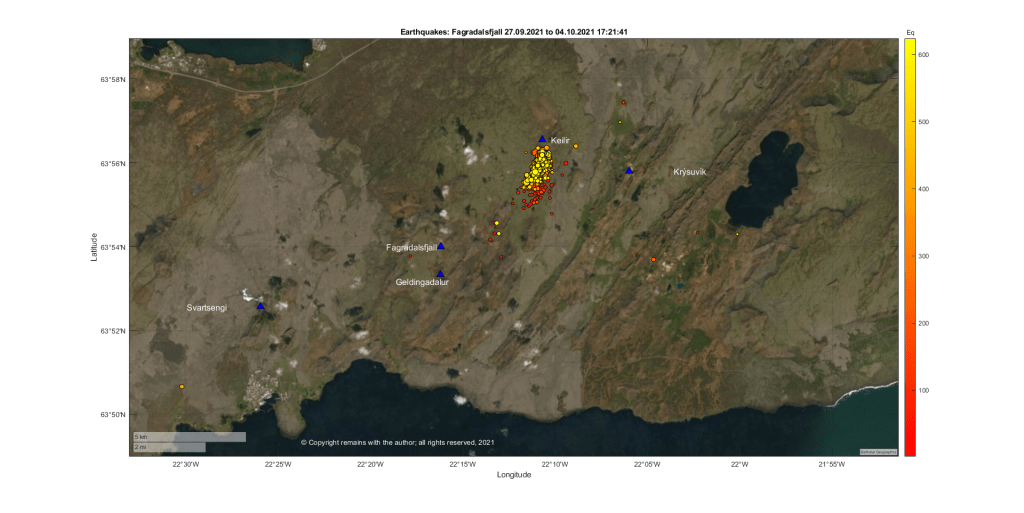
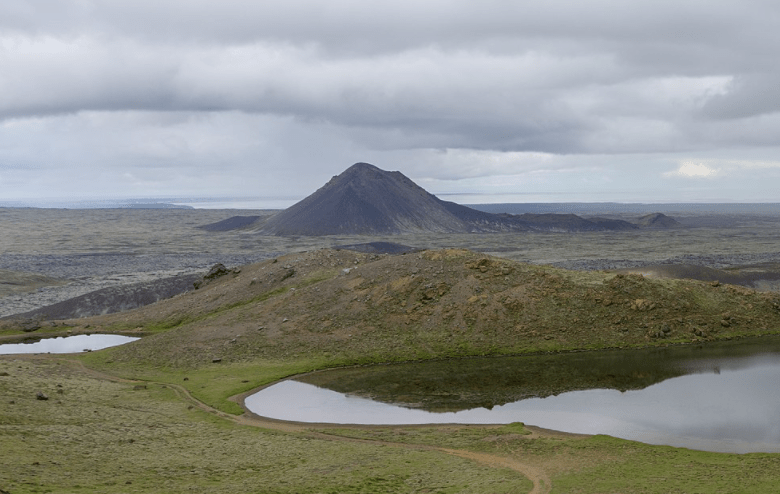
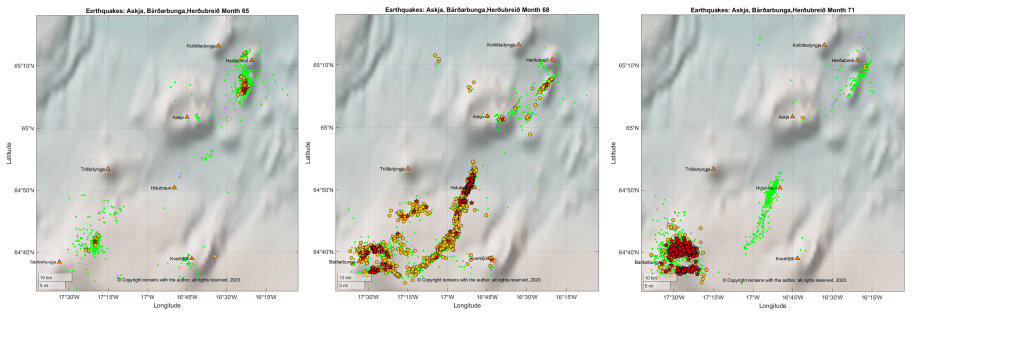
Mount Kelir is at the northern end of the earthquake swarm which started on 22 February 2021. In that swarm, earthquakes started near Mount Kelir and migrated towards and beyond Fagradalsfjall prior to the eruption at Geldingadalir on 19 March 2021.

The current swarm which started on 27 September 2021 near Mount Kelir is ongoing at the time of writing.  Over 10,000 earthquakes have been recorded, of which IMO have confirmed c. 1,245.  It is thought that an eruption may ensue near Mount Kelir.

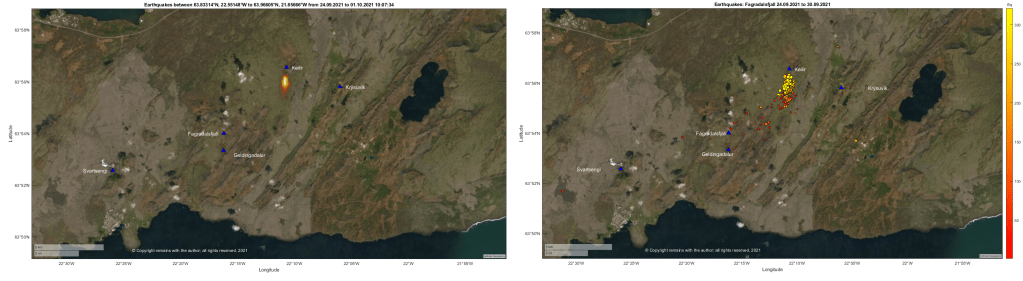
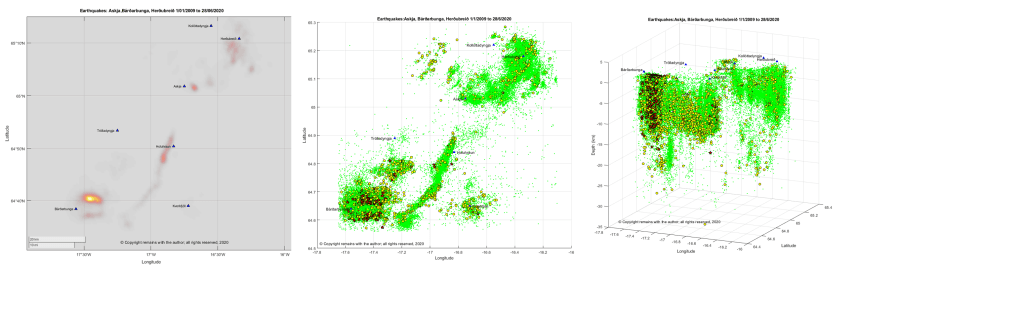
We have plotted the earthquakes and made a video of the geoscatter and scatter plots.

Fig 17:  Analysis of the swarm by depth and magnitude by the author.  © Copyright remains with the author; all rights reserved, 2021.
Fig 18:  Video of geoscatter plots and scatter plots of the current swarm by the author.  © Copyright remains with the author; all rights reserved, 2021.

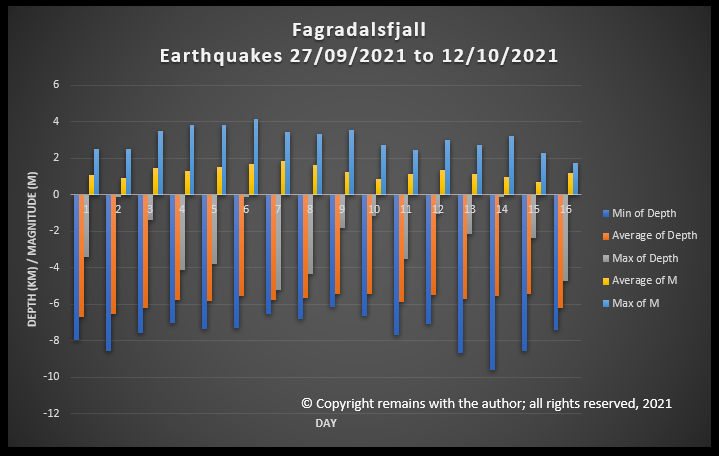
Whether or not a new eruptive site emerges, magma migrates to the existing site at Fagradalsfjall, or, it all quietens down, only time will tell.  At the moment the swarm is migrating SSW. 

Armchair Volcanologist

© Copyright remains with the author; all rights reserved, 2021.

Source for raw earthquake data:  Icelandic Met Office: IMO

12.10.2021 1: Update on La Palma Seismicity

Good Morning!

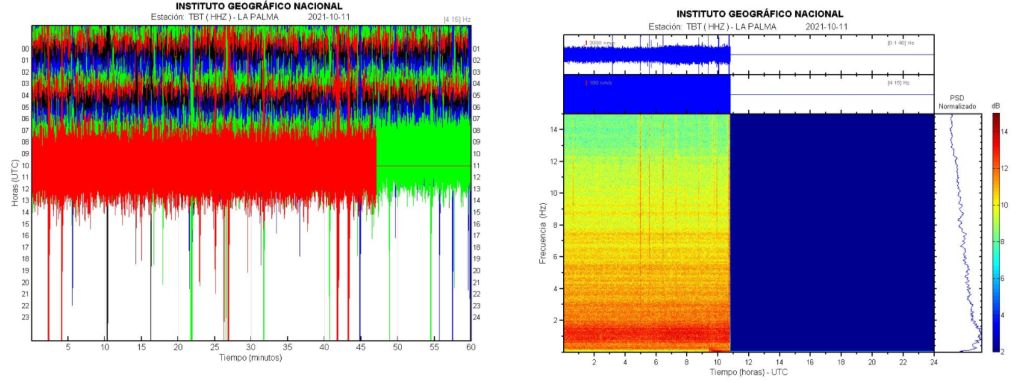
Let’s take look at status of the eruption and seismicity at La Palma.

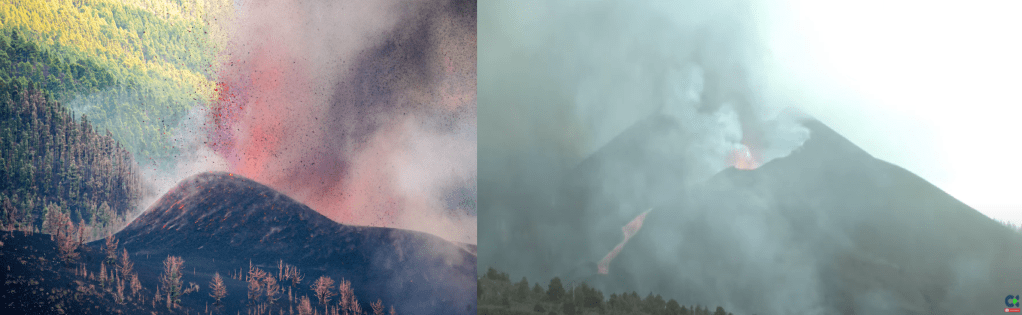
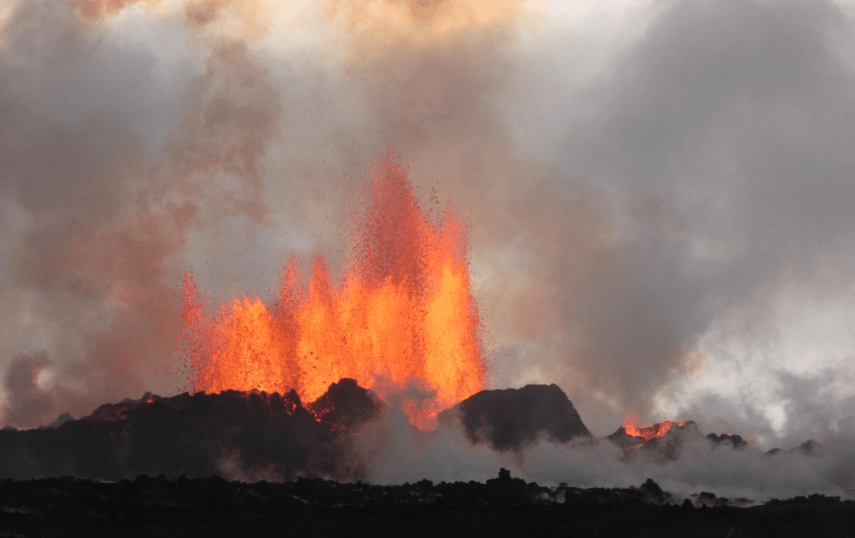
The eruption is still going strong.  The cone has grown substantially, despite partial collapses.

Fig 11: Cone growth.  On the left, the new cone on 20 September, 2021, cropped from an image by Eduardo Robaina, published under CC BY-SA 3.0; on the right, screen shot earlier today from RTVC

The following was reported earlier today:

  • The lava reached the cement works, Callejón de la Gata, today.  Local residents were confined to their homes due to the risk of toxic fumes from burning chemicals.
  • A  large volume of lava was emitted after the wall of the lava lake [cone?] was destroyed.
  • The northern arm of the lava flow is now 300 metres from the sea and expected to make a new lava delta near the beach of Perdido.
  • 591.1 hectares have been affected by lava.  This includes 132 hectares of crops , of which 70 hectares were banana crops; 33 hectares vineyards; and, 8 hectares avocado crops.
  • The maximum width of the lava flow is 1,520 metres.
  • 1,281 buildings have been impacted, of which 1,186 have been destroyed.
  • The lava delta is now 34 hectares.
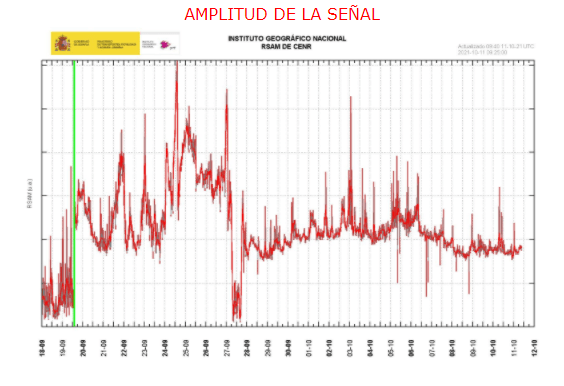
  • Seismicity remains high.  To  date, over 35,000 earthquakes have been recorded.  The most recent earthquakes remain below 10km, with depths reaching more than 20km.

The high level of seismicity is thought to indicate rising magma because there have been spasmodic tremors and a strong volcanic tremor at 18 Hz; the latter may be from depressurisation of magma at a depth of c. 10km.  In the absence of increased ground deformation, it is not known when or how magma may reach the surface.  If it reaches the surface, it may follow the current conduit or emerge at new fissures.

Fig 12:  Amplitude of seismic signal, source: IGN.  Green line denotes onset of the eruption.
Fig 13:  Seismic signal, source: IGN

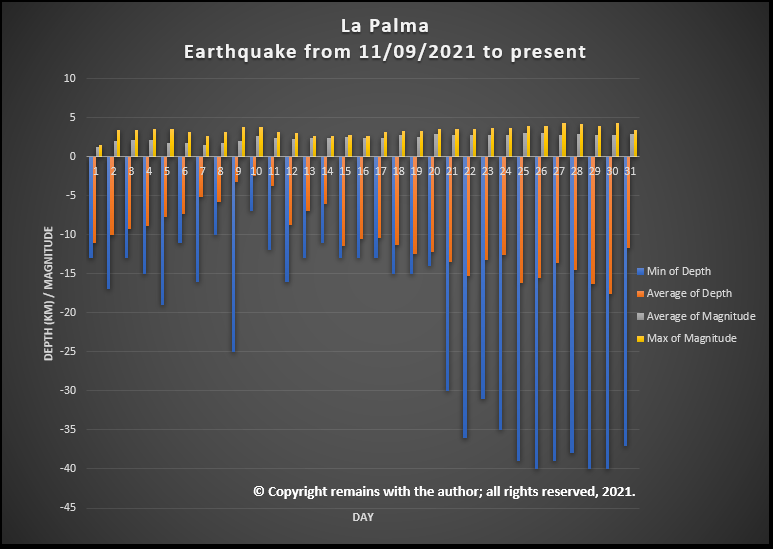
We have updated our earthquake data and have plotted the swarm from 27 September 2021to present.  The results are shown in the video below.

Fig 14: Analysis of the earthquake swarm from 11 September 2021 to present by the author.  © Copyright remains with the author; all rights reserved, 2021.
Fig 15: Video showing geoscatter plots and scatter plots by the author of the swarm from 27/09/2021 to present

Armchair Volcanologist

© Copyright remains with the author; all rights reserved, 2021.

Sources:

El Mundo: www.elmundo.es

VolcanoDiscovery:  www.volcanodiscovery.com

IGN: www.ign.es

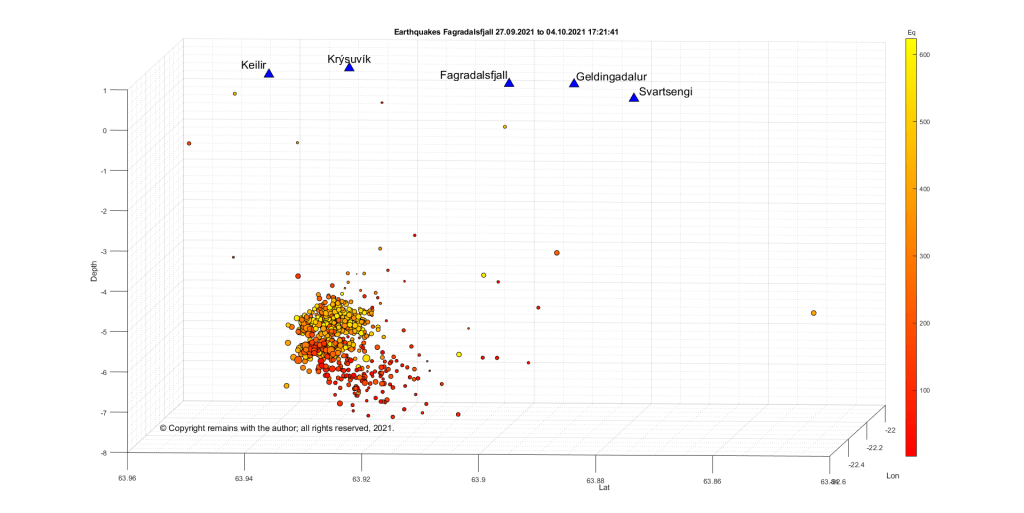
04.10.2021: Update Fagradalsfjall Seismic Swarm near Kelir

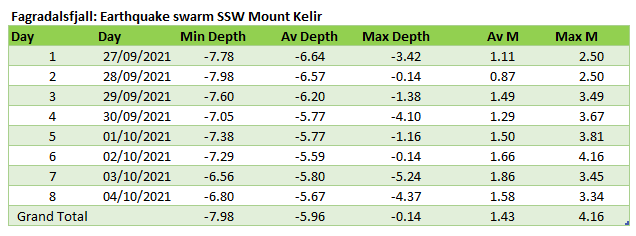
The swarm near Mount Kelir is ongoing.  IMO report that 6.200 earthquakes have occurred in the swarm, although c.624 have been confirmed at the time of writing (Sources:  IMO_Earthquakes and  Skjálfta-Lísa (vedur.is)).

Fig 8: Geoscatter plot of the current swarm SSW Mount Kelir by the author. Colour denotes time (using earthquake number), red is the oldest and yellow the youngest.  © Copyright remains with the author; all rights reserved, 2021

We have analysed and plotted the swarm.  It would appear that the swarm is ascending but still in the crust. The largest earthquake with a magnitude of 4.16 had a depth of 5.669 km. 

Fig 9: Numerical analysis of the swarm by the author.  © Copyright remains with the author; all rights reserved, 2021.

The possible ascent of the swarm is more visible in the scatter plot looking at it in an easterly direction.

Fig 10: Scatter plot of the swarm by the author.  Colour denotes time (using earthquake number), red is the oldest and yellow the youngest. © Copyright remains with the author; all rights reserved, 2021.

04.10. 2021: Update on the Cumbre Vieja Eruption

Fig 6: Plot of earthquakes from 11/09/2021 to 04/10/2021 10:13:11 by the author.   © Copyright remains with the author; all rights reserved, 2021
  • Part of the main cone collapsed at c. 9:10 pm last night; some vents have now merged.
  • Effusive activity has increased.  Lava flows have merged; the flow is 1km wide at its widest point.
  • The lava delta is now 29.7 hectares.  This has impacted the surfing beach at Los Guirres.
  • 400 hectares of land has been covered by lava and 4,819 hectares covered by ash.  1,047 buildings have been damaged, including 947 destroyed.
  • 20% of the banana crop has been lost. The village  of La Bombilla, built for banana plantation workers, is now under threat.
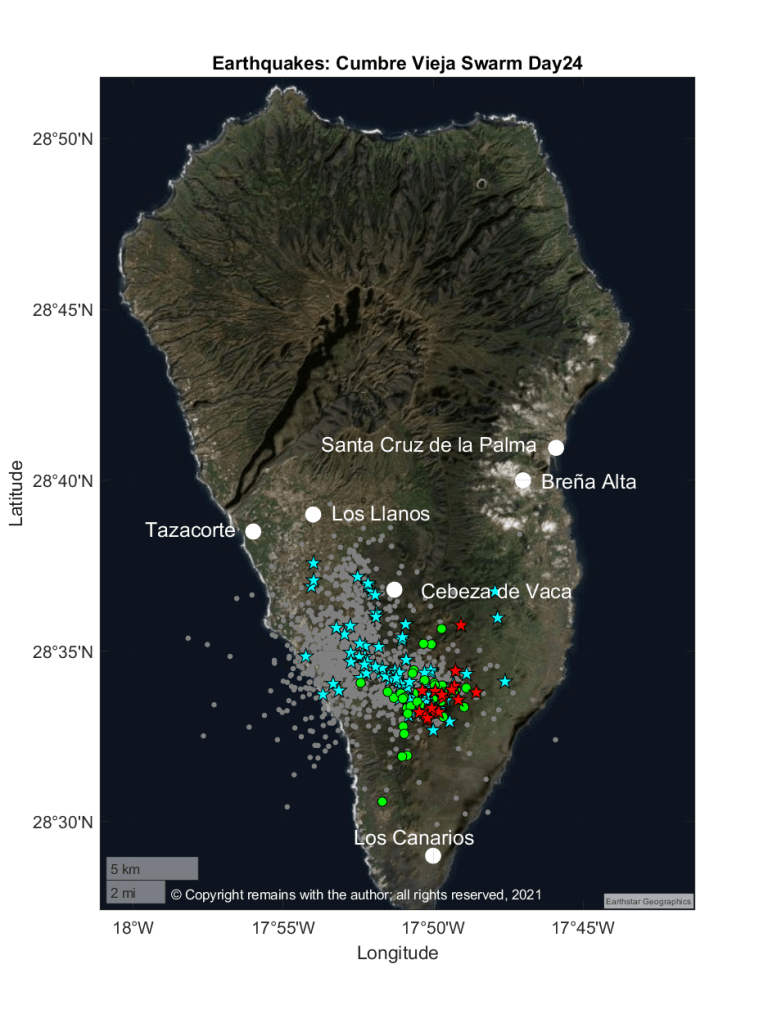
  • The seismic swarm is ongoing, with most recent earthquakes between 7km  – 14km depth.

We have updated our earthquake plots for the most recent swarm (11/09/2021 to 04/10/2021 14:30:59).  The swarm reactivated on Day 17.

Fig 7: Earthquake  plots by the author for the swarm 11/09/2021 to present. © Copyright remains with the author; all rights reserved, 2021

Sources for updates as before: El Mundo and IGN.

01.10.2021 (original post)

Good Morning! Today we provide an update on Fagradalsfjall, Cumbre Vieja (with video of earthquake swarms) and Askja.

Fagradalsfjall, Iceland

Fig 1: Mount Kelir, cropped from an image by Michal Klajban, published under CC BY-SA 4.0.  Source: Wikimedia Commons

Fagradalsfjall celebrated the six-month anniversary of the start of the eruption, which occurred on 19 March 2021, by taking a break.  Low level activity has been observed since 18 September 2021.

An earthquake swarm stared on 27 September 2021 south of Mount Kelir.  This is located near the northern end of the earthquake swarms earlier this year which preceded the eruption at Geldingadalir.

We have plotted the swarm to see what is going on.

Fig 2a: Plots by the author of the earthquake swarm from 27/09/2021 to present. Geodensity plot on the left and geoscatter plot on the right.  The colour code in the geoscatter plot is time: red is the oldest, yellow the newest. Time is approximated by earthquake sequence.  © Copyright remains with the author; all rights reserved, 2021.
Fig 2b: Plots by the author of the earthquake swarm from 27/09/2021 to present. Scatter depth v longitude plot on the left and scatter depth v latitude plot on the right.  The colour code is time: red is the oldest, yellow the newest. Time is approximated by earthquake sequence.  © Copyright remains with the author; all rights reserved, 2021.

While it is not clear what the cause of the swarm is (new magma or the crust adjusting to changes in tension), people are advised to avoid the area for the time being.  If an eruption does occur near Kelir, it is expected to be similar to that at Fagradalsfjall.   The aviation code is still orange.

Cumbre Vieja, Canary Islands

Fig 3: Cumbre Vieja eruption on 20/09/2021, cropped from an image by Eduardo Robaina, published under CC BY-SA 3.0.  Source: Wikimedia Commons

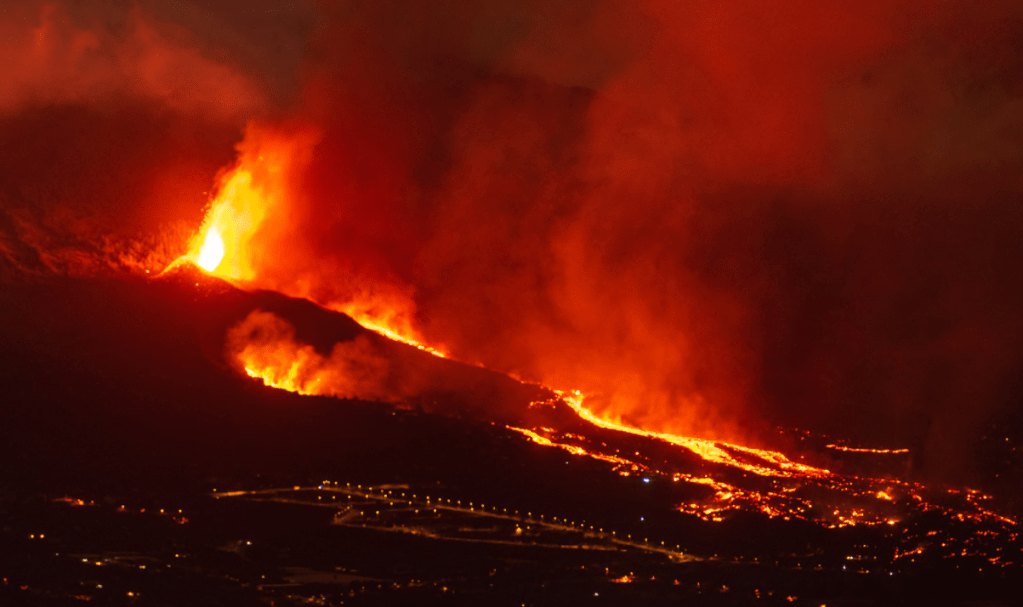
The eruption is still going strong.  The vents have produced ash columns, jetting lava and effusive lava flows.

Lava reached the sea, following the opening of a new vent earlier this week, which emitted more effusive lava. The lava travelled at 300 m/hr, crossing the coastal road and cascading over 100m high cliffs at Los Guirres. The lava is forming a delta, which has reached an impressive size 21 hectares. 

There are now four eruptive vents: a new effusive vent opened 400m north of the main vent on Thursday; and, two more opened on Friday 15 metres apart and 600m north west of the main cone.  Lava from Thursday’s new vent also made it to the sea via a flow parallel to the original one.  A fumarolic field has developed on the north side of the main vent.

Over 80 million cubic metres of lava have been erupted.  Sadly, this has damaged 1,005 buildings, of which 870 have been destroyed.  30.2km of road has been impacted, of which 27.7km have been destroyed.  Ash now covers 3,172.9 hectares of land.

SO2 levels are higher but not considered a risk for the population at the moment.

Earthquakes are occurring near the area start of the swarm which preceded the eruption.  They are deeper than the earlier swarm leading to concern that lava may be fed from a deeper reservoir.   We have plotted the current swarm and previous swarms from 2017 to date. 

Fig 4: Plots by the author of the most recent earthquake activity at Cumbre Vieja.  For plotting purposes, the activity has been labelled as a new swarm, which started on 27 September 2021. Green circles are the current swarm earthquakes < 3.0M; red stars are current swarm earthquakes ≥3.0M; grey circles are earthquakes < 3.0M from 2017 to 26.09.2021; and cyan stars are earthquakes ≥3.0M from 2017 to 26.09.2019 (all are in fact from the previous swarm starting 11 September 2021).  © Copyright remains with the author; all rights reserved, 2021.

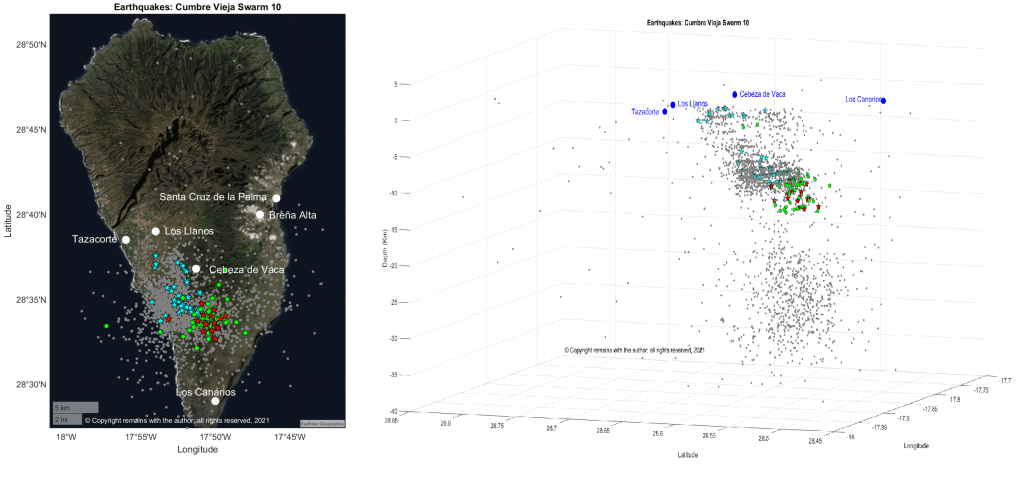
We have compiled a video of the earthquake swarms from 2017 to present.
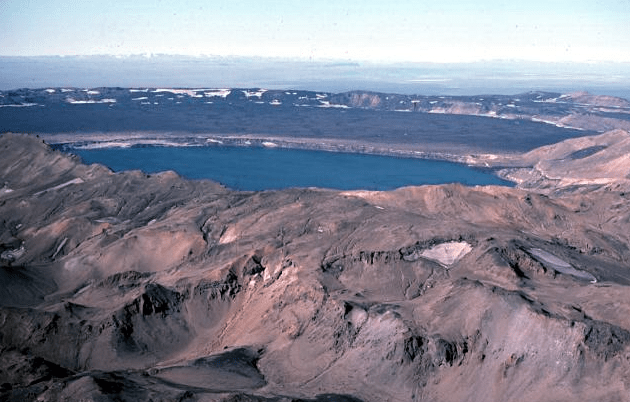
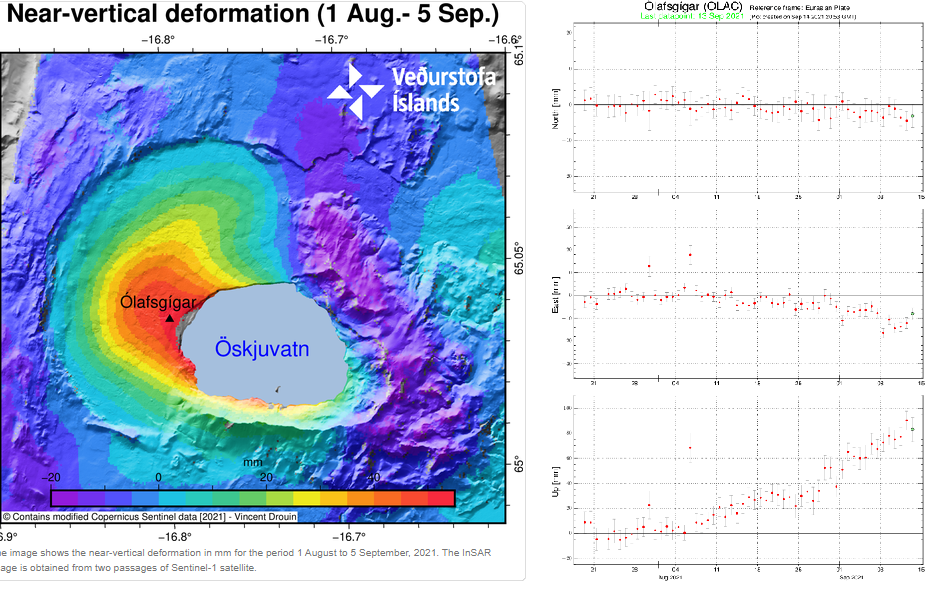
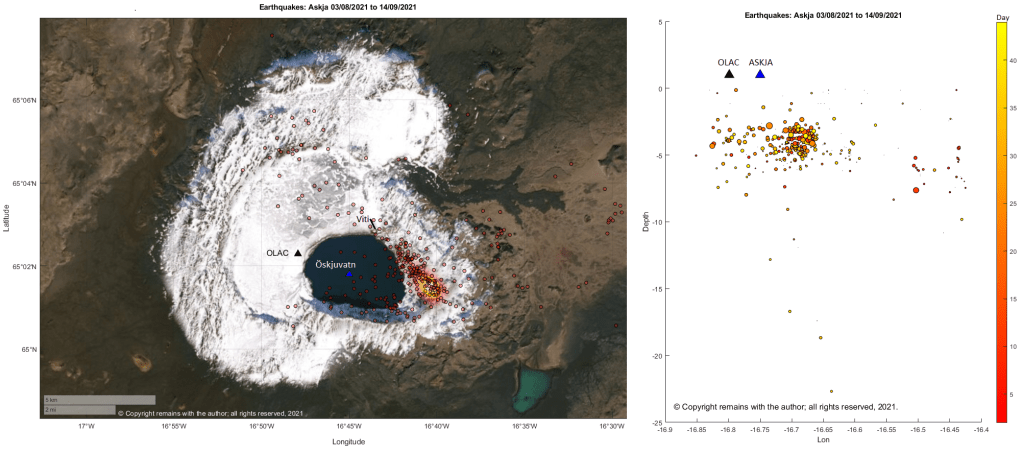
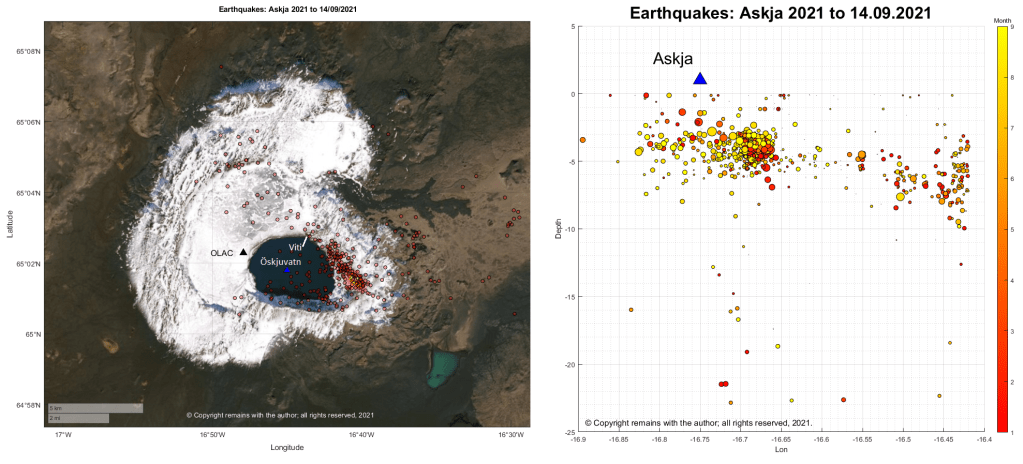
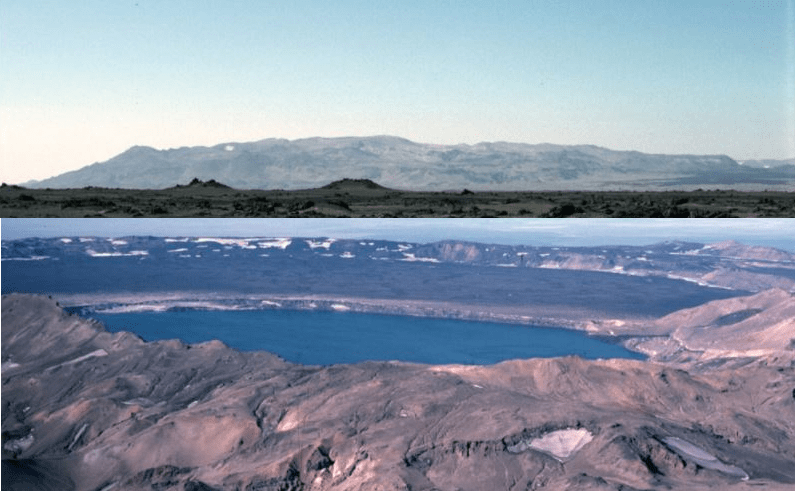
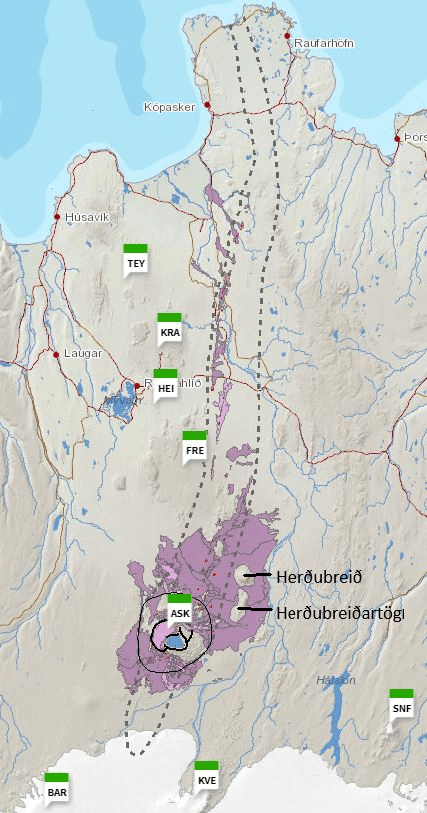
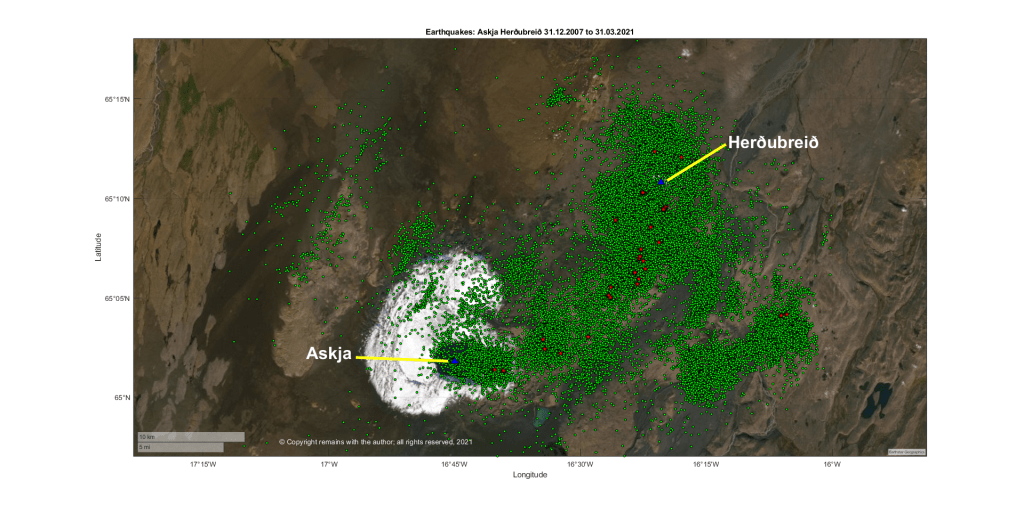
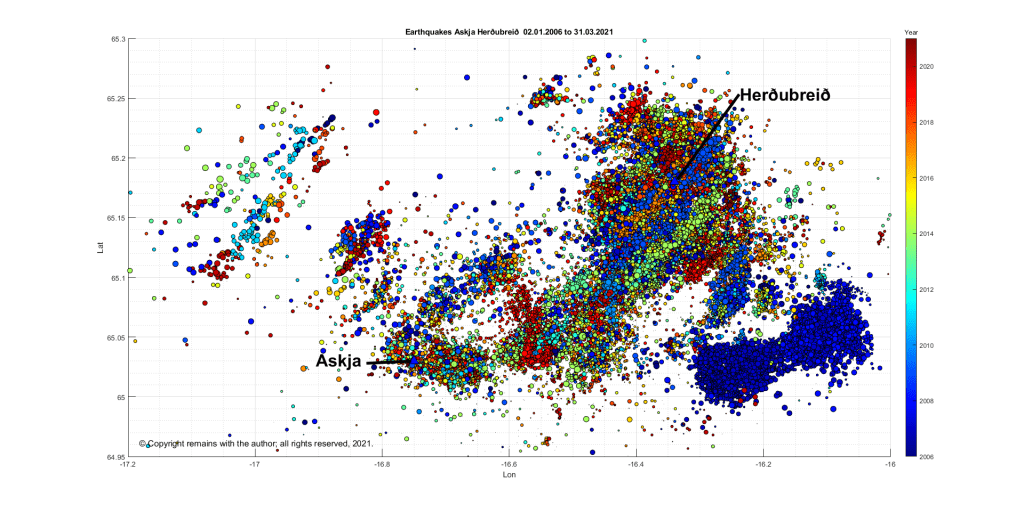
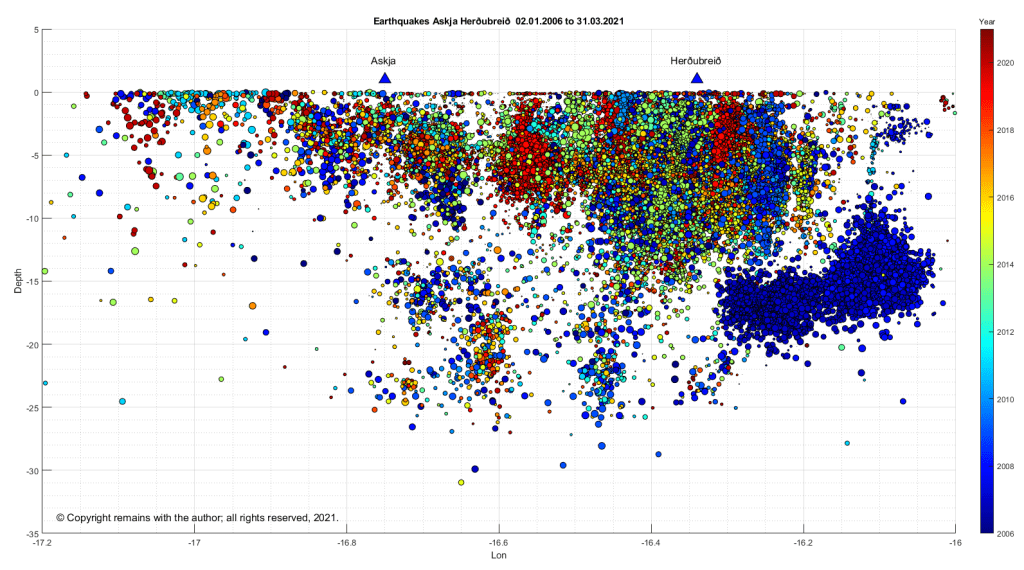
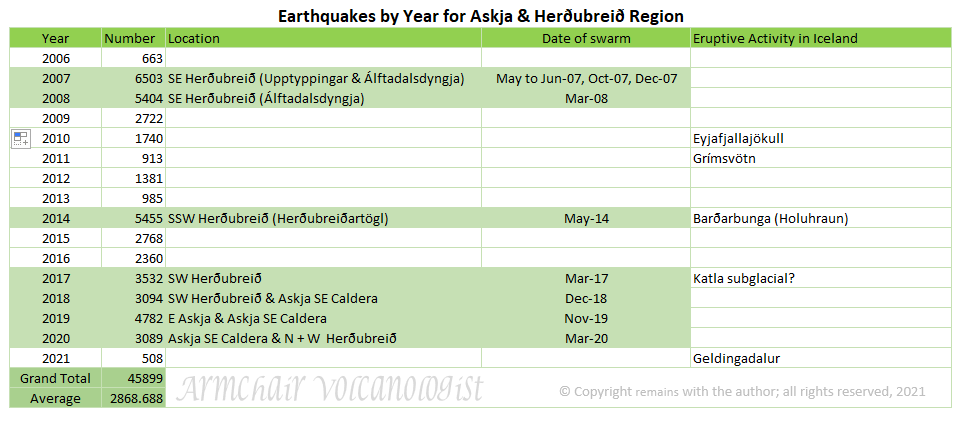
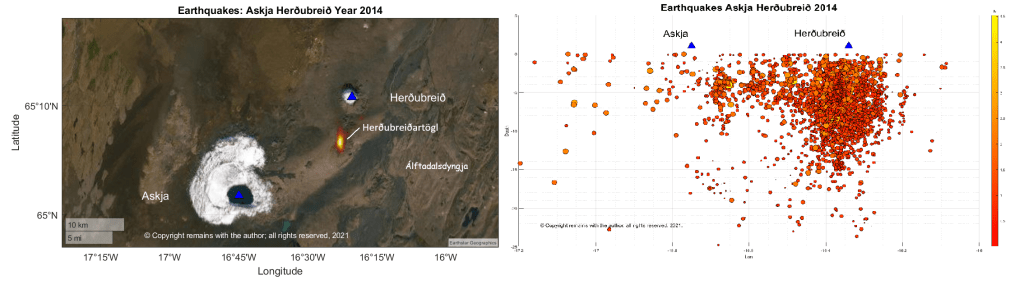
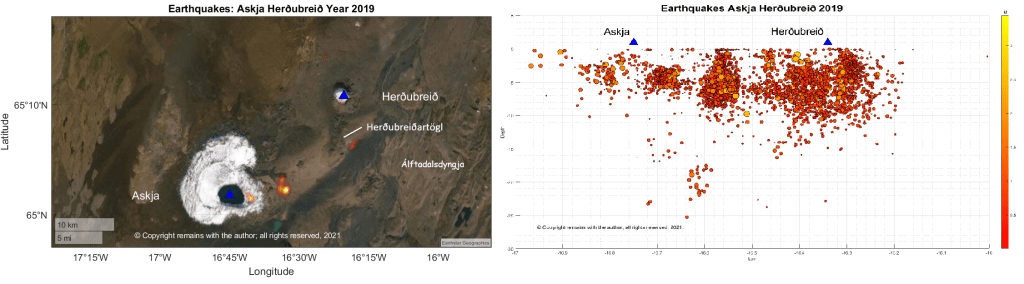
Fig 5: Video by the author showing the progress of the earthquake swarms from 2017 to present. © Copyright remains with the author; all rights reserved, 2021.

Askja

Seismicity is still occurring.  The Icelandic authorities are continuing to monitor this.  The aviation code is still yellow. 

We have not had time to update our earthquake plots, but will do so in due course.

Armchair Volcanologist

© Copyright remains with the author; all rights reserved, 2021

Sources:

Plots are the authors own work.

Information and raw earthquake data:

Fagradalsfjall: Home-page – Icelandic Meteorological Office | Icelandic Meteorological office (vedur.is)

Cumbre Vieja: Instituto Geográfico Nacional (ign.es) & EL MUNDO – Diario online líder de información en español

Update on Askja, Fagradalsfjall, Mount Merapi, Grímsvötn, La Soufrière St. Vincent, Mount Pelée, Mount Nyiragongo

Good Afternoon!

Time to check out the current status of the volcanoes we have been following, especially as the situation has changed for some.  

Askja

Fig 1: Image of Askja caldera by  M Ryan, USGS, public domain.

Inflation, thought to be caused by a magma intrusion at a depth of 2km-3 km, started in early August.  GPS data and satellite images detected uplift of 5cm per month; the uplift centred on the western edge of the Öskjuvatn caldera.

The aviation code was raised to yellow on 9 September 2021, following near vertical uplift of 7cm.

Fig 2: Deformation.  Sources: IMO and GPS tímaraðir (vedur.is)

We will take a quick look at local seismicity.  Raw earthquake data was downloaded from IMO for the period 1995 to 14.09.2021 for our plots.

Fig  3a: Left: Geodensity plot of earthquakes from 1995 to 09.09.2021, overlain with earthquakes from 03.08.2021 to 14.09.2021.  Right: scatter plot of earthquakes from 03.08.2021 to 14.09.2021 (colour denotes day from start).  All plots by the author. © Copyright remains with the author; all rights reserved, 2021

The epicentres of current earthquake swarm are mostly to the east of the Öskjuvatn caldera following a near linear route, starting at, or near, the area of maximum earthquake density for the period 1995 to 09.09.2021, and heading for the Viti explosion crater; seismic activity is on the opposite side from the area of maximum uplift. 

Seismicity for 2021 looks pretty similar; the current swarm follows the pattern of earlier seismicity. 

Fig  3b: Left: Geodensity plot of earthquakes from 01.01.2021 to 09.09.2021, overlain with earthquakes from 01.01.2021 to 14.09.2021.  Right: scatter plot of earthquakes from 01.01.201 to 14.09.2021 (colour denotes month).  All plots by the author. © Copyright remains with the author; all rights reserved, 2021.

More information on earlier seismicity can be found in our earlier article: Askja and Herðubreið, The Start of Our Exploration of the Northern Volcanic Zone, Iceland

Fagradalsfjall

Fig 4a: Crater at Fagradalsfjall erupting on 14 September 2021. 

The crater at fissure 5 has grown considerably since we last posted about it; it now dominates the surround hills.  The eruption paused on 2nd September 2021, taking a well-earned break; steam and gas emissions continued.  The eruption resumed a couple of days ago.  The aviation code remains orange.

Fig 4b: Tremor plot, Fagradalsfjall (faf).  Source: IMO

Mount Merapi

Fig 5:  Merapi 2011 with Prambanan in the foreground, cropped from an image of Prambanan by Arabsalam, published under CC BY-SA 4.0.  Source: Prambanan Java243.  Prambanan is an 8th Century Hindu temple compound located approximately 17 kilometres (11 mi) northeast of the city of Yogyakarta and designated a UNECSO World Heritage Site.

Both lava domes situated below the south west caldera rim continue to grow, producing numerous pyroclastic flows and avalanches.

The alert level remains at thee and there is a 3km – 5km exclusion zone.

Grímsvötn

A jökulhlaup started on 1 September 2021 from the western Skaftlá caldera; the peak flow rate reached 520 m3/s on 2 September 2021.  Warnings were issued of the hazard from H2S from water draining from the caldera lake.  The ice-shelf had subsided 1m by 5 September 2021. 

On 6 September 2021, the peak flow rate increased to 610 m3/s, thought to be due to a second release of water from the caldera lake – this time on the eastern side.

The aviation code remains at yellow.

Fig 6:  Top image shows the water levels reached at Eldvatn and the lower one, flow rate.  Source: IMO

La Soufrière St. Vincent

The last ash emissions were on 22 April 2021.  Seismicity has since remained low.  Gas and steam plumes have been observed rising from the crater.

The alert level remains at orange.

Mount Pelée

Volcano-tectonic earthquakes are still occurring in the edifice at depths between 0.2km to 1.2km.  The area of discoloured, downgraded, burned and dead vegetation remains on the south west flanks. 

At the end of July 2021 underwater gas emissions started between St Pierre and the Prêcheur.  This will be investigated to ascertain how it links with the volcano.

The aviation code remains at yellow.

Mount Nyiragongo

The volcano is still active. A [gravitational] collapse in the crater caused and ash plume; ash reached Goma.  Incandescence was seen on 26th July 2021 and a gas and ash plume emerged on 4th August 2021.

Armchair Volcanologist

© copyright remains with the author; all rights reserved, 2021.

Sources:

The Smithsonian Institution’s Global Volcanism Program: GVP

Icelandic Met Office: IMO

Askja and Herðubreið, The Start of Our Exploration of the Northern Volcanic Zone, Iceland

Good Morning!

As the new volcano at Geldingadalur continues to grow, opening and closing new fissures, we have returned to our tour of Iceland.  We have now reached the Northern Volcanic Zone, where the plate boundary heads northwards from Kverkfjöll to meet the Tjörnes Fracture Zone.   Active volcanoes in the zone are Kverkfjöll, Askja, Fremrinámur, Heiðarsporðar, Krafla and Þeistareykir; Herðubreið, itself, is Pleistocene palagonite table-mountain.

We are starting with the currently most seismically active volcanoes, Askja and Herðubreið, located where the Eastern Volcanic Zone meets the Northern Volcanic Zone, north of the Vatnajökull ice-cap. The mantle plume, itself, is thought to be located to the north west of the Vatnajökull ice-cap.

Askja

Fig 1: Combined images of Askja, cropped from photos by Michael Ryan, 1984 (U.S. Geological Survey): Askja Shield (top) and Askja Caldera (bottom) from GVP

The Askja volcanic system comprises a 1,516 m high central volcano and 190 km long fissure system, the central volcano being the Dyngjufjöll massif. It has three nested calderas, the latest of which formed in a rhyolitic eruption in 1875.  The central volcano, itself, is made up of Pleistocene glacio-volcanic tuffs, hyaloclastites, pillow basalts and intercalated sub aerial lava and capped by Holocene sub aerial lavas and pumice.  The fissure system, itself, extends from beneath the Vatnajokull ice-cap to the north coast of Iceland and includes small shield volcanoes.

This volcanic system does not erupt frequently; GVP records 14 Holocene eruptions which range from VEI 0 to VEI 5, the VEI 5s occurred in c. 8910 BC and 1875.  Askja’s lava types are tholeiitic basalt / picro-basalt and rhyolite.  Her main eruption types are effusive basalt with occasion explosive basalt or rhyolite.  The 1875 eruption created a 4.5-km-wide caldera which is now filled by Öskjuvatn lake. The most recent eruption in 1961 was a VEI 2 effusive basalt one.

Fig 2:  The Askja volcanic system from Icelandic Volcanoes . The boundary of the fissure system is delineated with a dotted line, the central volcano with a black line and the calderas with bold lines.  The three letter abbreviations are other volcanic systems in the area: BAR is Barðarbunga, KVE is Kverkfjöll, SNF is Snæfell, ASK is Askja, FRE is Fremrinámur, HEI is Heiðarsporðar, KRA is Krafla and TEY is Þeistareykir.  The author has added the names Herðubreið and Herðubreiðartögl.

The Askja Fires, 1874 to 1929

Askja was little known before the Askja Fires.  The area is sparsely inhabited, sited in lava fields and ash deserts.   The Fires occurred during a volcano-tectonic episode between 1874 to 1929.

A steam column rising from the central volcano in February 1874 was the first observed sign that the volcano was active. Northern Iceland was rocked by many large earthquakes in December 1874.  Steam and ash were seen in early January 1875 and light ashfall was noted south of Öxarfjörður.  By 15 February 1875, 10m subsidence had occurred in the main caldera along with the formation of a crater erupting mud.  A basalt lava flow at Holuhraun to the south of Askja occurred around this time. 

On 18 February 1875, a fissure eruption started on the Sveinagjá fissure north of the volcano; this generated 0.2 to 0.3km3 of basaltic lava over the course of several months.

On 29 March 1975, the Plinian eruption at the central volcano started in earnest.  The initial output was a wet and sticky tephra.  Shortly after 05:30, pumice was erupted, reaching as far as Scandinavia; this phase lasted until the following day. The Víti crater was formed later in a short hydro-magmatic episode.  The caldera, itself, formed over a period of 40 to 50 years, is now filled by Öskjuvatn lake.  As the volume of the new caldera is greater than the calculated erupted volume of lava and ash, it is thought that the excess lava is stored in the fissure system.

In 1929 to 1930, five eruptions occurred on ring faults around the Öskjuvatn caldera, with a 6 km long fissure eruption occurring on the southern side of the volcano that created the Þorvaldsraun lava.

The 1875 eruption is not the first time Askja has erupted rhyolite. Two other instances have been occurred: the c.10ka Skolli eruption and one around 2.1ka; these deposited thick layers of tephra and ash from the latter reached as far afield as Scotland and Sweden.

Holuhraun, which should be familiar to those interested in volcanology, is the area where a fissure eruption occurred in 2014.  This time the central volcano responsible was Barðarbunga.  At the time there was some concern at the time that the activity in Holuhruan would extend to Askja, triggering a rhyolitic eruption.  Fortunately, that did not happen.

Herðubreið

Fig 3: Image of Herðubreið, cropped from a photo by Icemuon, published under CC BY-SA 3.0

 Herðubreið is a 1,682m high Pleistocene palagonite table-mountain (tuya) made up of pillow lavas, hyaloclastite, capped by a 300m thick lava shield. Herðubreiðartögl, a small ridge extending from the south of Herðubreið, may be part of the same system.  Although Herðubreið is close to the Askja and Kverkfjöll volcanic systems, in the absence of any post glacial activity it not known if it belongs to either system.  We are including the volcano here as it is difficult to allocate the seismic activity in the area to each volcano without more local knowledge.

Herðubreið has been studied as an indicator of climate change during the last glacial periods. Werner et al, (1996) proposed that Herðubreið developed in stages from initial sub-aerial, sub-aqueous, subglacial to sub-aerial.  The first sub-aerial activity occurred during an interglacial, creating an olivine tholeiitic shield volcano in the vicinity of Herðubreiðartögl.  A lull in volcanic activity coincided with the onset of the last ice-age. Activity resumed with the deposition of olivine tholeiites, followed by hyaloclastites in a lake environment until the volcano breached the lake surface to produce subaerial lavas. The tuya, itself, was formed during the last glacial maximum when the volcano erupted pillow lavas under hyaloclastite deposits in the ice-cap; these were later topped by subaerial lavas when the volcano broke through the ice-sheet.  At the end of the last ice-age, activity at Herðubreið had ceased, however, Herðubreiðartögl produced some later olivine tholeittic lava flows and ash deposits.

Recent Seismicity

We plotted the area between 64.95°N,17.2°W and 65.3°N,16.0°W, a total of 45,899 earthquakes.  As you can see from Fig 4, the area is very active (although perhaps we should not have used green dots in retrospect– Askja looks very unwell as a result).

Fig 4: Geoscatter plot by the author of earthquakes between 64.95°N,17.2°W and 65.3°N,16.0°W for the period 31.12.2007 to 31.03.2021. Green dots denote earthquake epicentres; red stars denote those of 3.0 or more M. Blue triangles denote volcanoes. © Copyright remains with the author; all rights reserved, 2021.

The latitude v longitude scatter plot shows that activity follows a NE-SW pattern around Herðubreið, with a swarm to the south east; activity around Askja is focussed on the SE section of the caldera with some further east.  The plots are data-heavy so we have broken these down by year.

Fig 5: Lat v Lon scatter plot by the author of earthquakes between 64.95°N,17.2°W and 65.3°N,16.0°W for the period 31.12.2007 to 31.03.2021. Colours denote year of occurrence. Blue triangles denote volcanoes. © Copyright remains with the author; all rights reserved, 2021.
Fig 6: Depth v Lon scatter plot by the author of earthquakes between 64.95°N,17.2°W and 65.3°N,16.0°W for the period 31.12.2007 to 31.03.2021. Colours denote year of occurrence. Blue triangles denote volcanoes. © Copyright remains with the author; all rights reserved, 2021.

The years with most seismic activity in the sequence are: 2007, 2008, 2014 and 2019. 

Fig 7: Earthquakes in the plotted area by year by the author.  The years highlighted in green have above average seismicity. © Copyright remains with the author; all rights reserved, 2021.

In 2007 and 2008, there was a swarm that started in Upptyppingar and progressed to Álftadalsdyngja; this is thought to be due to magma movement. 2014 is the same year as the Barðarbunga eruption at Holuhraun; perhaps some of the seismicity is the result of the crust accommodating magma movement in the region, although the swarm here preceded the swarms at Barðarbunga.   In 2019, there was a swarm to the east of the Askja caldera.

The earthquake density plots and depth v longitude plots for these years are set out in Figs 8 to 11 below.

Fig 8: Earthquake density plot and depth v lon scatter plot by the author of earthquakes between 64.95°N,17.2°W and 65.3°N,16.0°W for 2007. Colours denote year of occurrence. Blue triangles denote volcanoes. © Copyright remains with the author; all rights reserved, 2021.
Fig 9: Earthquake density plot and depth v lon scatter plot by the author of earthquakes between 64.95°N,17.2°W and 65.3°N,16.0°W for 2008. Colours denote year of occurrence. Blue triangles denote volcanoes. © Copyright remains with the author; all rights reserved, 2021.
Fig 10: Earthquake density plot and depth v lon scatter plot by the author of earthquakes between 64.95°N,17.2°W and 65.3°N,16.0°W for 2014. Colours denote year of occurrence. Blue triangles denote volcanoes. © Copyright remains with the author; all rights reserved, 2021.
Fig 11: Earthquake density plot and depth v lon scatter plot by the author of earthquakes between 64.95°N,17.2°W and 65.3°N,16.0°W for 2019. Colours denote year of occurrence. Blue triangles denote volcanoes. © Copyright remains with the author; all rights reserved, 2021.
Fig 12: Video of earthquake density plots by the author for the period 2006 to 2021(3m) for the area 4.95°N,17.2°W and 65.3°N,16.0°W . © Copyright remains with the author; all rights reserved, 2021.

Let’s see what the scientists have said. Greenfield et al (2016) have noted from seismic studies that there is considerable melt storage and transportation (movement) under the lower crust in the region (which may or may not be typical of Icelandic volcanoes – more study would be needed); there is likely to be a magma intrusive complex in the shallow crust round Askja; and, the activity round Herðubreið is caused by fracturing in the region.

The region is well monitored due to the risk of another rhyolitic eruption from Askja; this time around one may cause some disruption to aviation and communication systems, by how much would depend on the size and length of the eruption.   In the light of the reawakening of Fagradalsfjall on the Reykjanes Peninsula, perhaps the Pleistocene volcanoes should be added to the watch list, although the monitoring of Holocene volcanoes is likely to pick up unusual activity. 

La Soufrière St. Vincent

We have not forgotten La Soufrière St. Vincent; our thoughts are still with the islanders.  We will do a fuller update soon. In the meantime, the volcano is still erupting and a new lava dome is forming in the crater.  The island has lost up to 50% of its GDP.  More aid is now reaching the island.  For updates, we use News 784 (link below).

Barbados continues to clear up the volcanic ash; this is putting strain on local water supplies. For updates, we use Nation News Barbados.

The Armchair Volcanologist

© Copyright remains with the author; all rights reserved, 2021.

Sources and Further Reading:

R. Werner, H. U. Schmincke, G. Sigvaldason ,“A new model for the evolution of table mountains: volcanological and petrological evidence from Herðubreið and Herðubreiðartögl volcanoes (Iceland)”, Geologische Rundschau 85, Article number: 390 (1996). https://link.springer.com/article/10.1007/BF02422244

T. Greenfield, R. S. White, S. Roecker, “The magmatic plumbing system of the Askja central volcano, Iceland, as imaged by seismic tomography”, Journal of Geophysical Reseach: Solid Earth, AGU Publications https://agupubs.onlinelibrary.wiley.com/doi/full/10.1002/2016JB013163

Thor Thordarson (Faculty of Earth Sciences, University of Iceland) and Al Margaret Hartley (University of Manchester (November 2019). Askja. In: Oladottir, B., Larsen, G. & Guðmundsson, M. T. Catalogue of Icelandic Volcanoes. IMO, UI and CPD-NCIP. Retrieved from http://icelandicvolcanoes.is/?volcano=ASK

“Classic Geology in Europe 3: Iceland”, Thor Thordarson & Armann Hoskuldsson, Terra Publishing, Third Edition, 2009.

The Smithsonian Institution’s Global Volcanism Program (GVP): https://volcano.si.edu/

Earthquake raw data: IMO:  https://en.vedur.is/

For updates on La Soufriere St Vincent:

News 784: https://news784.com/

Nation News Barbados: https://www.nationnews.com/

For updates on the new volcano at Geldingadalur:

Icelandic Met Office: https://en.vedur.is/ (English site)

Icelandic Met Office: https:// vedur.is/ (Icelandic site)

Reykjavik Grapevine: https://grapevine.is/

Department of Civil Protection and Emergency Management | Almannavarnir

The Barðarbunga Volcanic System

Good Afternoon!

Fig 1: Barðarbunga: cropped image from photo 3 of 11 by Erik Sturkell, retrieved from Icelandic Volcanoes

In this post we continue our journey round Iceland’s many volcanoes.  We have reached the mighty Barðarbunga at the northwest corner of the Vatnajökull icecap.

Barðarbunga volcanic system lies in the Eastern Volcanic Zone, Iceland, near where the head of the mantle plume is thought to be.  The system comprises a 2,000 m high central stratovolcano with a 65 km2, 700 m deep caldera, the Veiðivötn fissure swarm running NE to SW, and the Tröllagigar and the Dyngjuháls – Holuhraun fissure swarms running NE; the entire system is c. 190 km long and 25 km wide.  

There is second central volcano in the system, Hamarinn, 20 km south west of the Barðarbunga central volcano. Hamarinn may be younger, indicated by the absence of both an intrusive complex and a caldera. 

There are geothermal areas near the caldera rim of Barðarbunga and the east of Hamarinn, the latter is the source of jökulhlaups. 

Fig 2: Map of the Barðarbunga volcanic system: central volcanoes, fissure systems and lava flows. Green barred squares indicate the locations of various volcanoes; BAR is Barðarbunga.  Retrieved from Icelandic Volcanoes.  See Sources for full accreditation.

The area is tectonically very active: the Eastern Volcanic Belt accommodates much of the separation between the North American and Eurasian Plates. The area is close to the junction with the Northern Volcanic Zone, where Barðarbunga’s neighbours, Askja and Herðubreið, can be found.

Eruptive History

According to GVP, there are 55 identifiable Holocene eruptive periods for the Barðarbunga system.  Some of the eruptive history has been hidden by the ice-cap.  However, lavas and tephra deposits on the ice-free sections of the fissures are more accessible.

Barðarbunga Central Volcano

The central volcano has had around 22 eruptions in the last 1000 years, most occurring between 1200 -1500 and in the 18th century.  The last known subaerial eruption was in 1910.

Barðarbunga’s lavas are mainly basalt/ picro basalt.  Her eruption types are explosive, phreato-magmatic with jökulhlaups, reflecting the impact of the ice-cap.  The central volcano produces eruptions in the order of VEI 3 to 4, producing tephra – both airborne and waterborne.  There is a silicic tephra layer in the ice-cap dating to the early 18th century but it is not clear that this came from Barðarbunga.  If it did, any rhyolite would have come from partial melting of the basaltic crust.

Magma is sourced from a depth of 10 km or more below the caldera; above this source is an intrusive complex and a lower density region, probably of caldera in-fill.  Magma may also be sourced direct from the mantle in the fissure swarms.  

Fissure Swarms

Fissure swarm eruptions are basaltic in the order of VEI 1 to 2, with a maximum of VEI 6 on the Veiðivötn fissure. 

The last three eruptions on the south west fissure swarm were the VEI 4 at Vatnaöldur in 877, the VEI 6 at Veiðivötn in 1477 and the VEI 2 at Tröllagigar in 1862-1864.  The first two of these were explosive tephra eruptions, producing 5 km3 to 10 km3 of tephra and small lava flows.  Both the Vatnaöldur and Veiðivötn fissures cut into the Torfajökull volcano, causing it to erupt with silicic tephra and lava.  The largest known effusive eruption on the SW fissure swarm is the Great Þjórsá lava which covers 900 km2 and reached the south coast via the Tungnaá and Þjórsá river valleys.

The Gjálp eruption in 1996 occurred on a subglacial fissure that links the Barðarbunga and Grímsvötn volcanic systems.  While it is thought that the magma was sourced from beneath Barðarbunga, based on seismic and geodetic data, the magma erupted subaerially was characteristic of Grímsvötn’s lavas.

The frequency of eruptions on the northern fissure swarm is not known; the last eruption was at Holuhraun which started on 29 August 2014 and lasted until February 2015.  Precursors to this eruption were a build up of seismic activity at Barðarbunga over seven years, which stopped immediately after the Grímsvötn 2011 eruption but resumed soon afterwards. The largest known effusive fissure eruption north of Vatnajökull is the mid Holocene 15 km3 Trölladyngja lava shield.

Holuhraun Eruption 2014 – 2015

Fig 3: Holuhraun eruption.  Cropped image from Barðarbunga: photo 8 of 11 by Alessandro La Spina, 4 September 2014. Retrieved from Icelandic Volcanoes. Note the fire fountains, spatter cones and volcanic gases.

The subaerial eruption started on 29 August 2014 at the Holuhruan vent 45 km NE of the Barðarbunga caldera; the eruption ended on 28 February 2015, having left an 85 km2 lava field and a 65 m deep depression in the Barðarbunga caldera’s ice cover.  The eruption was a large SO2 and other volcanic gas producer, however there was little ash or tephra.

The central volcano, Barðarbunga had inflated prior to the eruption then deflated during the eruption as evidenced by subsidence in the ice covering.  The volume of the subsidence was consistent with the dyke intrusion and the lava erupted at Holuraun, although there is seismic and geochemical evidence that some of the lava erupted at Holuhraun was fed direct from the mantle. It is estimated that 1.6 km3 lava was erupted. 

Since September 2015, seismic and GPS data show that the volcano has started to refill at a depth of 10 to 15 km.

Recent Seismic Activity

We looked at earthquakes in the Barðarbunga, Askja, Herðubreið and Holuhraun area (64.56°N, 17.65°W to 65.3°N, 16.1°W) for the period 1 January 2009 to 28 June 2020.  Not much activity had been noted in the area to the west and south west of Barðarbunga in our earlier plots; however, we had noted that heightened activity at Askja and Herðubreið had preceded the 2014 eruption at Holuhraun which lies between the three volcanoes, hence we included them in our plots.  The link between the centres is rifting in the crust to accommodate the separation of the North American and Eurasian Plates.

Fig 4: Earthquake plots for the period 1 January 2009 to 28 June2020: lat. v lon. geodensity and scatter plots and a depth plot; all by the author.  Green dots denote earthquakes ≤ 2 M; yellow circles, earthquakes between 2.0 M and 3.0 M; and, red stars, over 3 M.  Note in addition to the intense activity around Barðarbunga and Holuhraun, activity near Askja and Herðubreið. © Copyright remains with the author; all rights reserved, 2020.

There were 70,128 earthquakes in the period, of which 16,573 occurred before the 2014 -2015 eruption, 19,061 during the eruption and 34,494 post eruption; the average per calendar month was 247 pre eruption, 2,723 during the eruption and 539 post eruption; the maximum magnitude earthquake pre eruption was 3.9 M, during the eruption 5.5 M and 4.9 M post eruption; and, the deepest quakes had respective depths of 33.9 km, 31.0 km and 33.9 km.  These numbers include activity at Barðarbunga, itself, the Holuhraun fissure, Askja and Herðubreið.  The larger magnitude earthquakes occurred near the north and south caldera rim during the eruption.  Since the eruption all four centres have had elevated seismic activity.

Seismicity during the 2014 to 2015 Holuhraun eruption

Fig 5: Earthquake swarms: Herðubreið three months prior to the Holuhraun eruption, the swarms at Barðarbunga and Holuhraun in the first month of the eruption and then a sample three months later. The Barðarbunga and Holuhraun swarms started in August 2014 and continued with decreasing intensity to June 2015. © Copyright remains with the author; all rights reserved, 2020.

Three months prior to the eruption, there was an earthquake swarm at Herðubreið, noted here because the rifting event that preceded the Holuhraun eruption occurred on the same plate boundary.  Seismic activity at Herðubreið or Askja may be precursors to activity at Vatnajökull, if they, themselves, are not the main event or brewing something.  Something to watch out for bearing in mind the recent large swarms in the Tjörnes Fracture Zone and on the Reykjanes Peninsula.

The earthquake plots for August 2014 and November 2014 show the intense swarms from caldera collapse and also the rifting event.

We will look at Askja and Herðubreið in future posts.

The Armchair Volcanolgist

17 July 2020.

© Copyright remains with the author; all rights reserved, 2020.

Sources and Further Reading

“Barðarbunga”, Guðrún Larsen and Magnús T. Guðmundsson (Institute of Earth Sciences – Nordvulk, University of Iceland).  In: Oladottir, B., Larsen, G. & Guðmundsson, M.T., Catalogue of Icelandic Volcanoes. IMO, UI and CPD-NCIP. Retrieved from Icelandic Volcanoes: http://icelandicvolcanos.is/?volcano=BAR

Fig 2: Map. After Björnsson (1988), Gudmundsson and Högnadöttir (2007), Jóhanneson and Saemundsson (1998a & b), Sigurgeirsson et al (2015). Base data, Iceland Geo Survey, IMO, NLSI | Base map: IMO.  In: Oladottir, B., Larsen, G. & Guðmundsson, M.T., Catalogue of Icelandic Volcanoes. IMO, UI and CPD-NCIP. Retrieved from Icelandic Volcanoes: http://icelandicvolcanos.is/?volcano=BAR

Smithsonian Institution Natural History Museum Global Volcanism Program (GVP): https://volcano.si.edu

Raw earthquake data: Icelandic Meteorology Office: IMO https://en.vedur.is/earthquakes-and-volcanism/earthquakes

Plots are the author’s own work.