A Quick Update on Activity on the Reykjanes Peninsula

Good Afternoon!

The earthquake swarm which started in December 2019 is continuing, let’s have a quick update on the stats.

Statistics

There have been 19,675 earthquakes in the Reykjanes Peninsula area 64.4°N, 23.0°W to 63.7°N, 21.0°W for the period 1 Jan 2016 to 14 June 2020, of which 14,258 (72%) have occurred in the last six months, most associated with the swarm near Svartsengi.

Fig 1: Statistics for the earthquake swarm to date by the author.  Month from start refers to the start of our data extraction (January 2016). © Copyright remains with the author; all rights reserved, 2020.

Seismic Activity

Our updated scatter plots show that there is more shallow small earthquake activity above the lithosphere than in our earlier plots. 

Fig 2: Latitude v Longitude geoscatter plot and depth plot for earthquake activity in the vicinity of Svartsengi 1/01/2016 to 14/06/2020 by the author.  Green dots denote earthquakes <2M; yellow dots, earthquakes greater than or equal 2.0M and less than 3.0M; red stars, greater than or equal to 3M.  © Copyright remains with the author; all rights reserved, 2020

Geodensity Plots

The geodensity plots for months 48 (December 2019) onwards (Figs 3.1 and 3.2) show that the most intense action started to the east of Mt Thorbjörn and has migrated west to Svartsengi and beyond.

Fig 3.1 Geodensity plots: top row months 48 and 49 (December 2019 and January 2020); bottom row month 50 and 51 (February 2020 March 2020) by the author. Note that the colour intensity is calculated based on the data set for the specified month. © Copyright remains with the author; all rights reserved, 2020
Fig 3.2 Geodensity plots: top row months 52 and 53 (April 2020 and May 2020); bottom row month 54 (June 2020, to 14/06/2020) by the author. Note that the colour intensity is calculated based on the data set for the specified month.  © Copyright remains with the author; all rights reserved, 2020.

Uplift

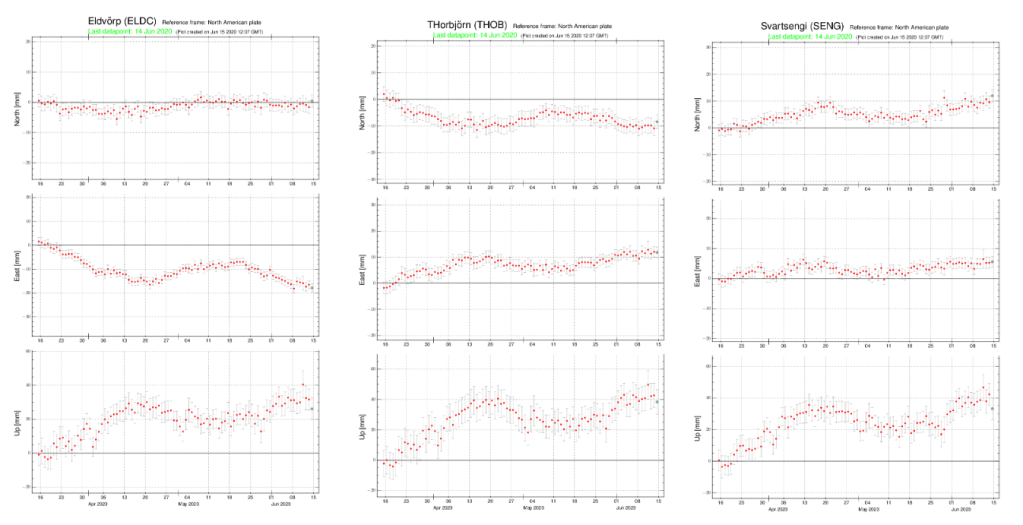
IMO has confirmed that uplift has resumed in the vicinity of Mount Þorbjörn.  Ground deformation is clearly visible on the GPS plots.

Fig 4: Uplift in the vicinity of Mt Þorbjörn as shown in recent GPS plots published by IMO: GPS Þorbjörn. THOB moved south eastwards, SENG moved north eastwards and ELDC moved westward; all showed uplift.

Summary

We are still looking at an unusually large swarm, accompanied by continued uplift in the vicinity of Mt Þorbjörn.

At the time of writing, there has been no change in the uncertainty phase declared by Icelandic Civil Protection .

The Armchair Volcanologist

15 June 2020

Sources:

Raw earthquake data and GPS plots downloaded from the Icelandic Met Office: https://en.vedur.is

Earthquake plots are the author’s own work.

© Copyright remains with the author; all rights reserved, 2020