Tag Archives: Kelir

Update on the Eruption at Litli Hrútur, 13th July 2023

Fig 1: Screenshot from Bein streymi frá eldgosinu við Litla-Hrút – RÚV.is (ruv.is)  Lava flowing south from the crater today.  Smoke from the moss fires is visible at the edge of the lava field.

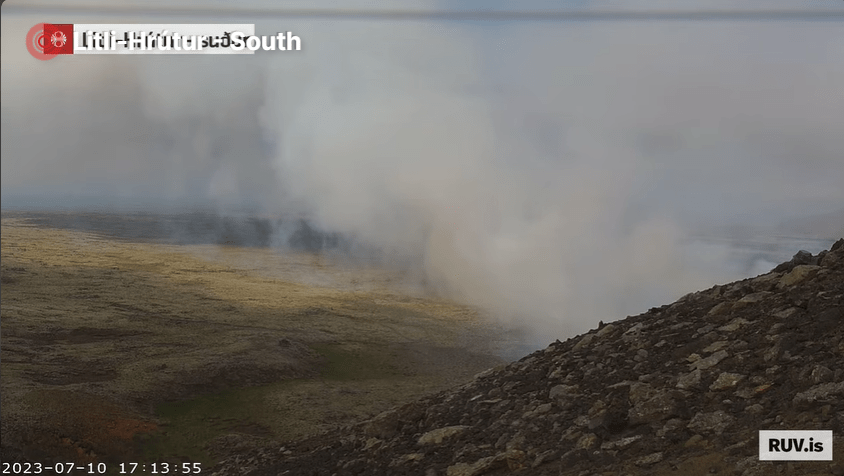
The eruption site is closed to the public right now due to the danger from volcanic gasses and smoke from moss fires; some visitors have been affected.  Also, some visitors have been taking insane risks (e.g., attempting to climb the crater wall).  High winds yesterday also caused issues.

The Institute of Earth Sciences, Iceland, have provided an update on the eruption here: Volcanic eruption at Litli-Hrút, measurement results 13 July | Institute of Earth Sciences (hi.is) .  This is summarised below.

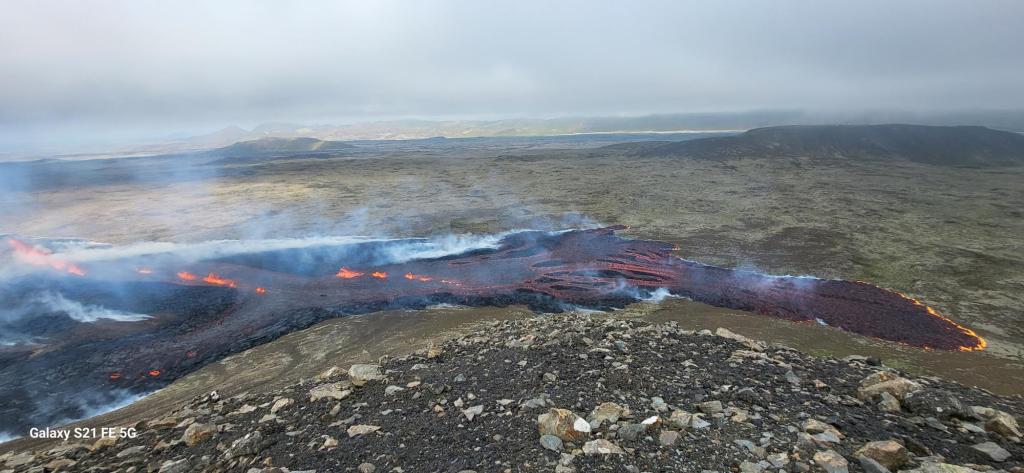
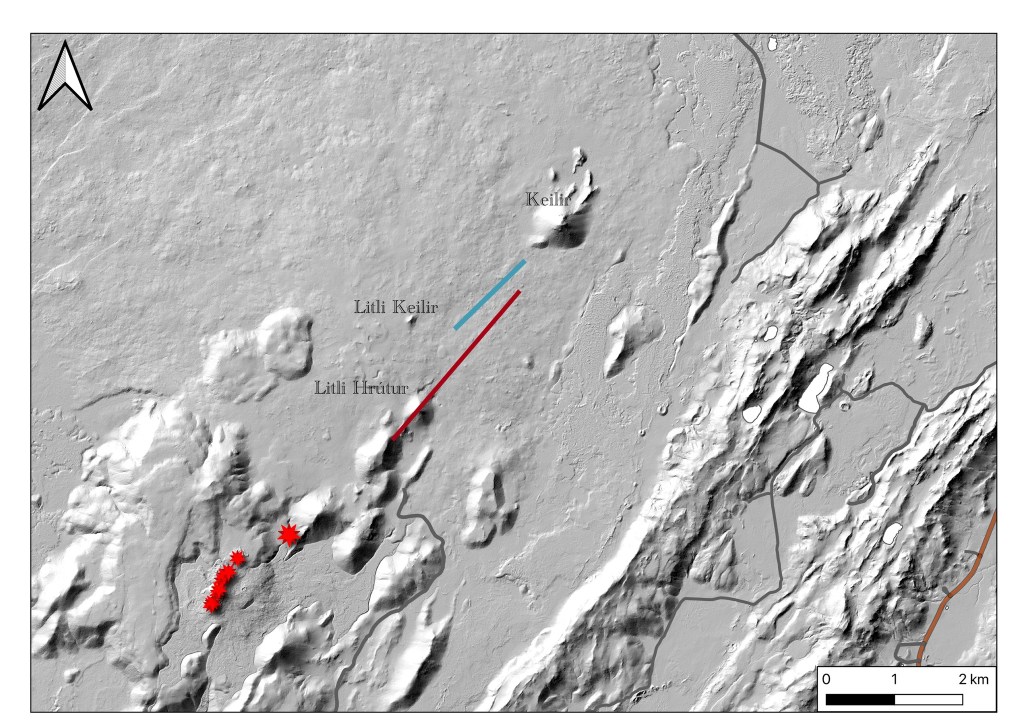
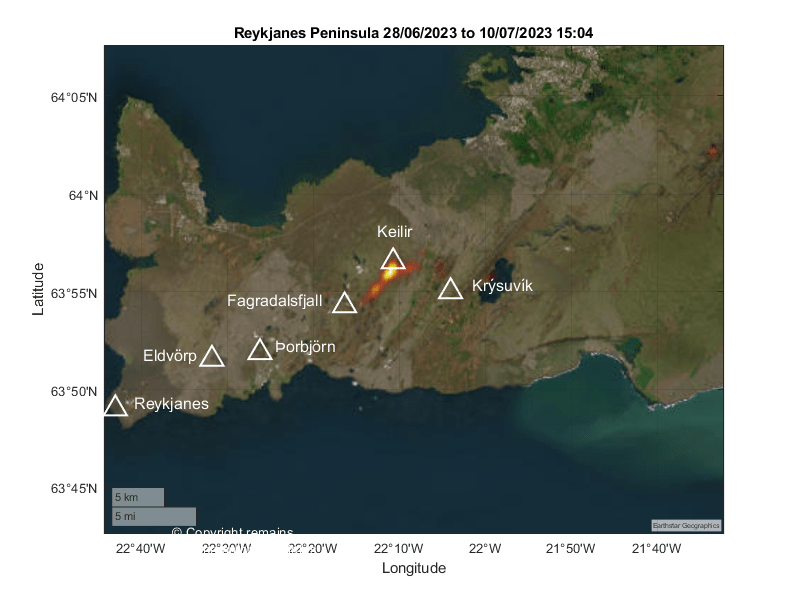
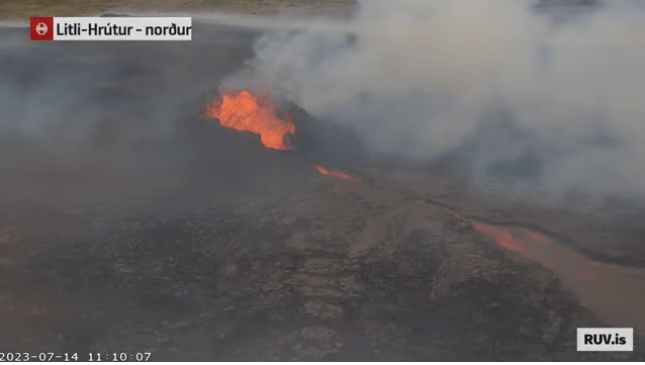
  • As we know the eruption started on 10th July 2023 at 16:40 with the opening of four fissures with a combined length of c.800m in a north easterly direction from Litli Hrútur towards Keilir.   The eruption peaked at c.21:00, diminishing to form a single crater c. 400m northeast of Litli Hrútur.
  • Lava is flowing south with an average flow rate of 13m3/s (similar to the 2021 eruption) for the period 11 July to 13 July.  As of 13 July 13:38, the lava volume is c. 3.4 million cubic metres covering an area of 0.4km2.  Calculations were performed by NLSI from Pleiades satellite images.
  • The lava composed of vesicular glass, microphenocrysts and microlites of plagioclase, olivine, clinopyroxene and spinel, similar to the 2022 lava.  Lava is estimated to have a temperature of c.1190°C.  The chemical composition is similar to that of the 2021 and 2022 eruptions: MgO wt.% = 8.5, and, K2O/Ti2O = 0.26.
  • The gas composition is similar to that of the 2022 eruption, with a high concentration of CO2.  The CO2 may have accumulated prior to the eruption.  SO2 gas emissions range from 5.4-11.5 ktonnes / day and CO2 is 7.1 – 15 5 ktonnes / day.

If lava continues to flow southwards, it may reach the 2022 lavas in Meradalir.

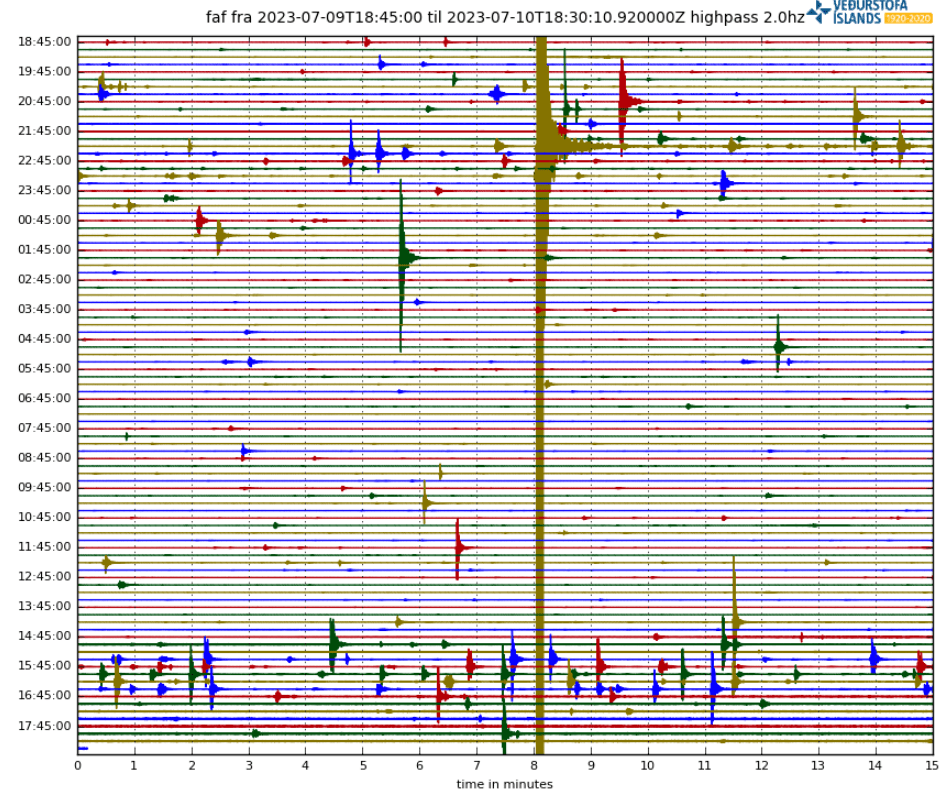
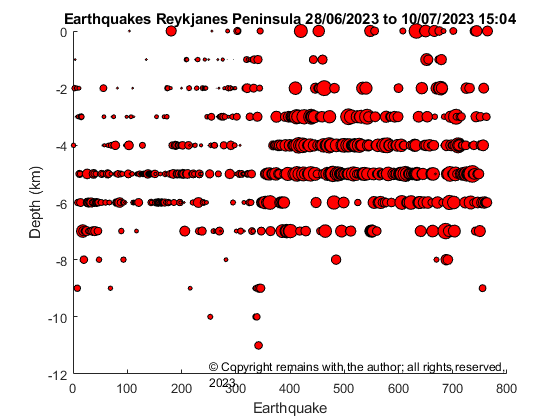
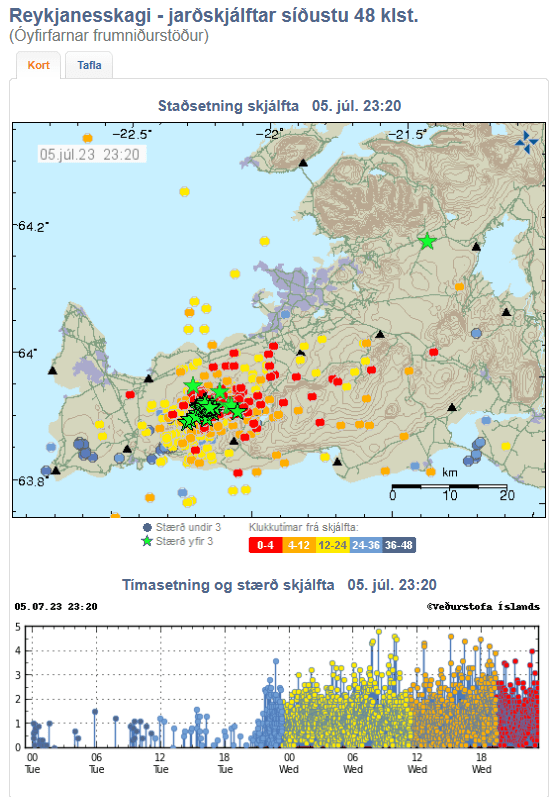
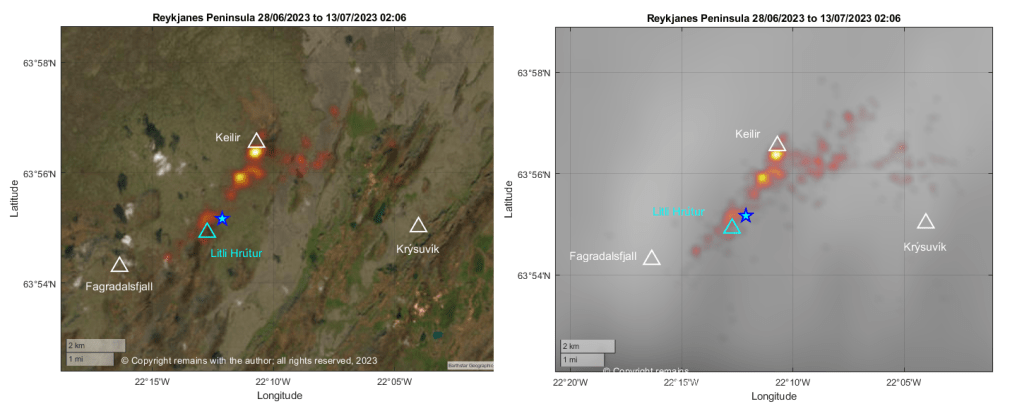
We have updated our earthquake plots to 13th July 2023 02:06, focussing more on the area between Fagradalsfjall, Keilir and Krýsuvík. 

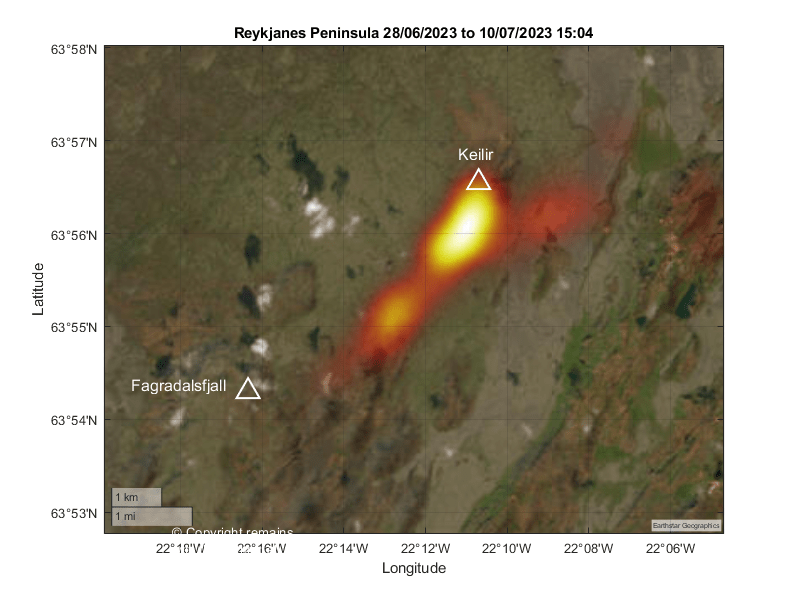
The earthquake density plot is still showing most activity southwest of Keilir and close to the eruption site, which we determined from eyeballing the location of the crater. The area southeast of Keilir is also showing more activity.  Whether the activity close to Keilir is triggered quakes, the result of faults moving to accommodate the magma intrusion, or magma-related (or, indeed, both) remains to be seen.

Fig 2: Geodensity plots by the author.  The blue star shows the approximate location of the crater. In the image to the right, we have removed the satellite image background so that the earthquakes are more visible. © Copyright remains with the author; all rights reserved, 2023. 
Fig 3:  Geoscatter plots by the author.  The blue star shows the approximate location of the crater. © Copyright remains with the author; all rights reserved, 2023. 
Fig 4:  Scatter plots by the author.  The blue star shows the approximate location of the crater. © Copyright remains with the author; all rights reserved, 2023. 
Fig 5:  Combined geoscatter & scatter plots by the author.  © Copyright remains with the author; all rights reserved, 2023. 

Armchair Volcanologist

© Copyright remains with the author; all rights reserved, 2023

Sources

Raw earthquake data: Skjálfta-Lísa (vedur.is)

Other sources are included in the text.

Eruption Started Near Litli Hrútur, Iceland

Updated for earthquake plots from 28th June 2023 to 10th July 15:04 (pre eruption) for the Reykjanes Peninsula

Fig 1: Screenshot from RUV.is webcam on Litli Hrutur. The eruption site is behind the hill. Source: https://www.ruv.is/frettir/innlent/2023-07-06-beint-streymi-fra-fagradalsfjalli-387091

The Icelandic Met Office has confirmed the onset of an eruption on the eastern and northeastern flanks of Litli Hrútur, Iceland. The eruption started around 16:40 today with the opening of three small fissures on a 200m fault. Lava is collecting in a depression then flowing southwards, with gas and steam emissions going northwestwards.

Fig 2: Image by  Benedikt Ófeigsson from IMO’s facebook page showing the two fissures. Image appears to have been taken from Lilti Hrútur. Source: https://www.facebook.com/photo/?fbid=701454135343917&set=a.312131834276151

Images taken by Jakob Vegerfors, which he posted onto Facebook, show two initial fissures. The images can be found here: https://www.facebook.com/photo?fbid=10159116738742038&set=pcb.1442657949904754 The hill in the left foreground is Litli Hrutur and the larger hill to the right in the background is Kelir.

IMO reported noticing a disturbance on the earthquake station at Fagradaslfjall last night and again at 14:00 today similar to those preceding the 2021 and 2022 eruptions.

Fig 3: Helicorder plot for Fagradalsfjall today. Source: IMO

The eruption site appears to be a little east of the southern end of the calculated position of the dyke intrusion.

Fig 4: Calculated position of the dyke instrusion (red line) from IMO. Red stars show the position of earlier eruptions (2021 and 2022). The blue line is the location of surface deformation from ICEYE wave interference images taken 7-8 July. Location of surface fracture and insert model determined by Michelle M. Parks and Vincent Droin, Icelandic Meteorological Office. Photo: Ásta Rut Hjartardóttir, University of Iceland

We have updated our earthquake plots from 28th June 2023 to 10th July 2023 15:04 for the Reykjanes Peninsula. We used the 764 confirmed earthquakes published by IMO on https://skjalftalisa.vedur.is/#/page/map. The total number of earthquakes in the swarm was c.12,000 as of 9th July 2023.

Fig 5: Geoscatter plots by the author for 28th June 2023 to 10th July 2023 15:04. Colour denotes age: red is the oldest, yellow the youngest.  © Copyright remains with the author; all rights reserved, 2023
Fig 6: Scatter plots by the author for 28th June 2023 to 10th July 2023 15:04. Colour denotes age: red is the oldest, yellow the youngest.  © Copyright remains with the author; all rights reserved, 2023
Fig 7: Scatter plots by the author of quake v depth for 28th June 2023 to 10th July 2023 15:04. Size denotes magnitude.  © Copyright remains with the author; all rights reserved, 2023
Fig 8: Geodensity plots by the author for 28th June 2023 to 10th July 2023 15:04. © Copyright remains with the author; all rights reserved, 2023
Fig 9: Zoomed in geodensity plot by the author for 28th June 2023 to 10th July 2023 15:04. © Copyright remains with the author; all rights reserved, 2023

Apparently the eruption site is difficult to get to. If you intend to visit, please follow the advice of the local authorities and stay safe.

For local news sources, try

IMO: https://en.vedur.is/ and their Facebook page, https://www.facebook.com/Vedurstofan

RUV.is: https://www.ruv.is/frettir

MBL.is: https://www.mbl.is/frettir/

For local webcams, try

https://www.ruv.is/frettir/innlent/2023-07-06-beint-streymi-fra-fagradalsfjalli-387091

Armchair Volcanologist

© Copyright remains with the author; all rights reserved, 2023.

Update on July 2023 Earthquake Swarm Fagradalsfjall to Kelir as at 7th July 2023 18:23

The earthquake swarm which started on 4th July 2023 is continuing vigorously as we write, with 7,000 earthquakes detected.  InSAR has confirmed that there is a dike intrusion between Fagradalsfjall and Kelir. IMO have said that magma is likely to have reached a depth of around 1 km by 6th July, causing a fracture of a 2.8 km length between Fagradalsfjall and Keilir, centred a little north of Litli-Hrútur. The expectation is that, if an eruption occurs, it will be in hours or days. The eruption may be short but bigger in its initial stages than the 2021 and 2022 eruptions. The alert level remains at orange.

A smaller swarm is also ongoing southwest of the peninsula on the Reykjanes ridge, near the island of Eldey.  This may be due to crustal accommodation of the magma intrusion between Fagradalsfjall and Kelir and/or it may be independent activity.  The alert level has been raised to yellow. We will look at this in later posts.

Fig 1: Earthquake map and plot of earthquake magnitude v time from IMO (preliminary results only).  Magnitude is decreasing, following the pattern of the 2021 and 2022 eruptions. Many of the “quakes” scattered over the peninsula and environs are ghosts.  Source: Reykjanes peninsula – earthquakes during the last 48 hours (Preliminary results) | Reykjanes peninsula | Icelandic Meteorological office (vedur.is)
Fig 2: InSAR image confirming dike intrusion.  See main text for attribution and description.

From IMO, Earthquake activity in Fagradalsfjall area | News | Icelandic Meteorological office (vedur.is), “COSMO-SkyMed interferogram covering the period 28 June to 6 July 2023.

The wrapped image (Fig 2) clearly shows a series of multicolored fringes centered bewtween Fagradalsfjall and Keilir. These fringes show ground deformation caused by the new dike intrusion which commenced on 4 July 2023. The maximum observed deformation related to the dike intrusion is up to 18 cm in the satellite‘s line-of-sight (los) in the NW direction.

Although the deformation signal extends over a large area of the western Reykjanes Peninsula, this does not mean there is magma beneath this entire region. The magma intrusion is situated bewteen Fagradalsfjall and Keilir. There is no indication of additional magma movements outside this area.

Several small lineaments are also visible in the interferogram which cut across the fringes. These represent fault movements/earthquakes that were triggered during the dike propagation.”

We have updated our earthquake plots to this morning, 7th July 2023 09:37 using the published earthquakes from https://skjalftalisa.vedur.is . 

Fig 3: Geoscatter plot by the author of earthquakes occurring in the current swarm on the Reykjanes Peninsula. © Copyright remains with the author; all rights reserved, 2023
Fig 4: Scatter plot by the author of earthquakes occurring in the current swarm on the Reykjanes Peninsula. © Copyright remains with the author; all rights reserved, 2023
Fig 5: Geodensity plot by the author of earthquakes occurring in the current swarm on the Reykjanes Peninsula. © Copyright remains with the author; all rights reserved, 2023.

Fig 5: Geodensity plot by the author of earthquakes occurring in the current swarm on the Reykjanes Peninsula. © Copyright remains with the author; all rights reserved, 2023.

Time will tell whether and where lava emerges with the current swarm.

Our thanks go again to the Icelandic Met Office, IMO, https://www.vedur.is/, for the raw earthquake data. For updates, please visit IMO.

Armchair Volcanologist

© Copyright remains with the author; all rights reserved, 2023

Earthquake Swarm on the Reykjanes Peninsula, 4th July 2023 to 5th July 2023.

An earthquake swarm started on the Reykjanes Peninsula, Iceland, on 4th July 2023. It is still on progress at the time of writing.

Fig 1: Earthquake swarm on the Reykjanes Peninsula. Source: https://www.vedur.is/skjalftar-og-eldgos/jardskjalftar/reykjanesskagi/

Local volcanologist have said that the likelihood of an eruption in a matter of hours or days has increased. The aviation alert level has been increased to orange.

So we have plotted the published earthquakes from https://skjalftalisa.vedur.is from 28th June 2023 to 5th July 2023 20:16 to see what is going on.

Fig 2: Geoscatter plot by the author of earthquakes occurring in the current swarm on the Reykjanes Peninsula. © Copyright remains with the author; all rights reserved, 2023
Fig 3: Scatter plot by the author of earthquakes occurring in the current swarm on the Reykjanes Peninsula. © Copyright remains with the author; all rights reserved, 2023
Fig 4: Geodensity plot by the author of earthquakes occurring in the current swarm on the Reykjanes Peninsula. © Copyright remains with the author; all rights reserved, 2023

It certainly looks like a magma intrusion close to the sites of the recent Fagradalsfjall eruptions. Time will tell whether or not and where lava emerges with the current swarm.

Our thanks go again to the Icelandic Met Office, IMO, https://www.vedur.is/, for the raw earthquake data. For updates, please visit IMO.

Armchair Volcanologist

© Copyright remains with the author; all rights reserved, 2023