Good Evening,
Today, we are looking at the earthquake plots for the Reykjanes Peninsula since the 16th July 2025 eruption on the Sundhnúkur crater row.
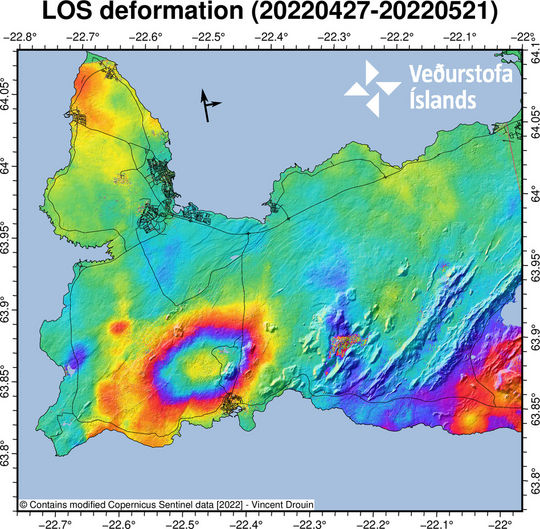
The Icelandic Met Office (IMO) are reporting that ground deformation and magma accumulation has continued under Svartsengi on the Reykjanes Peninsula, Iceland, since the 16th July 2025 eruption on the Sundhnúkur crater row. To date the cumulative uplift is just over 25cm and the estimated volume of magma accumulated is in the region of 26 million cubic metres. IMO conclude that the most likely outcome is another eruption on the Sundhnúkur crater row. Their updates can be found here: Ground uplift and magma accumulation continue beneath Svartsengi | News | Icelandic Meteorological office .
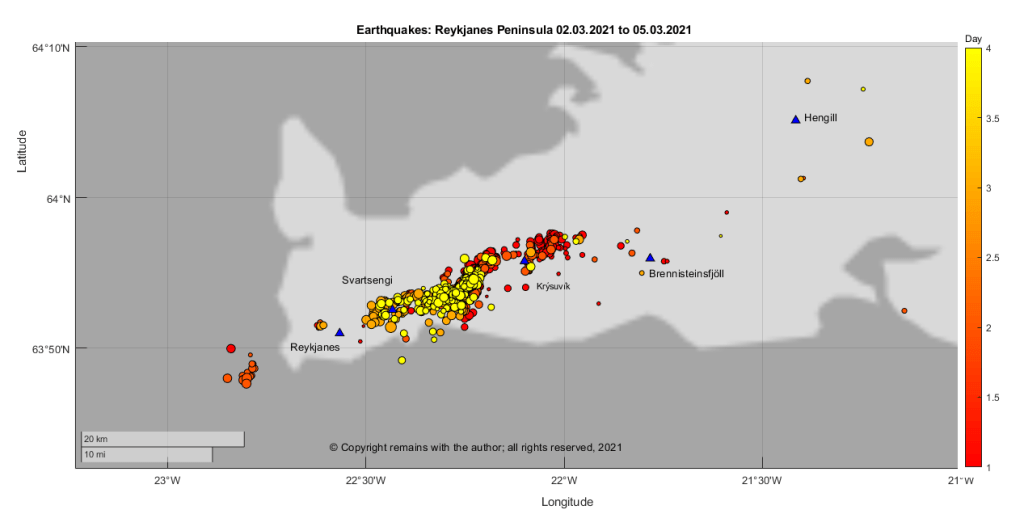
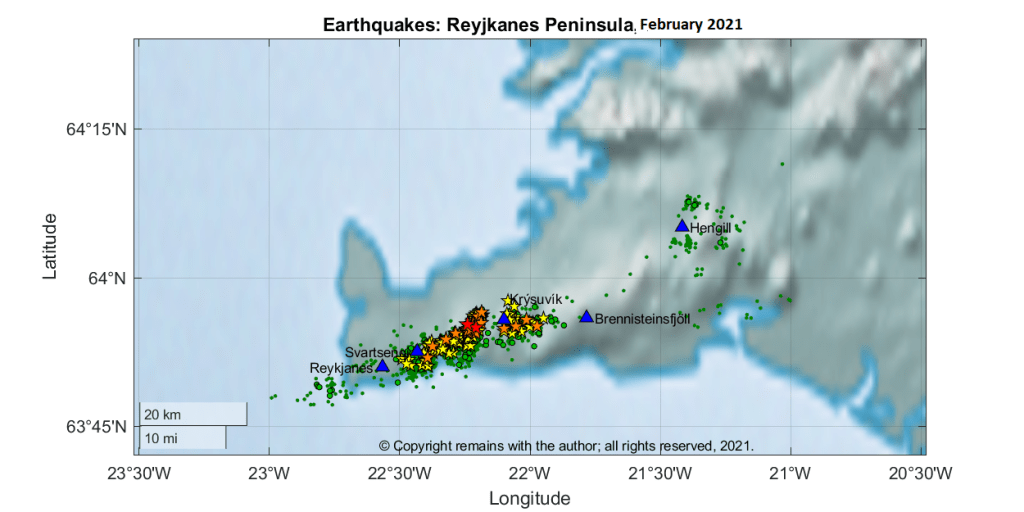
We started by plotting the earthquakes for the Reykjanes Peninsula from 16th July 2025 to 10th May 2026 for the area between 63.7°N, 23.0°W to 64.4°N, 21.0°W. This is followed by a closer look at the area covering Svartsengi and Krýsuvík.
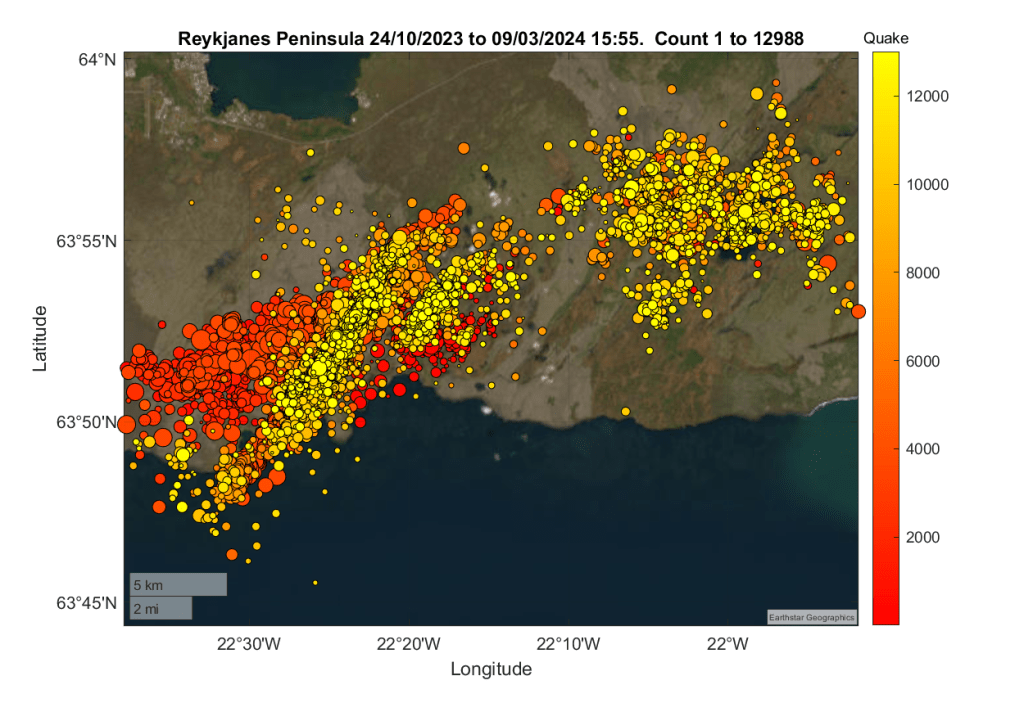
Reykjanes Peninsula, 17th July 2025 to 10th May 2026
We downloaded publicly available earthquake data from Skjálftalísa for the area above; a total of 6,186 earthquakes. Our data set includes automatically recorded earthquakes which have not been reviewed so there is less certainty about their location, especially where have been earthquake swarms.
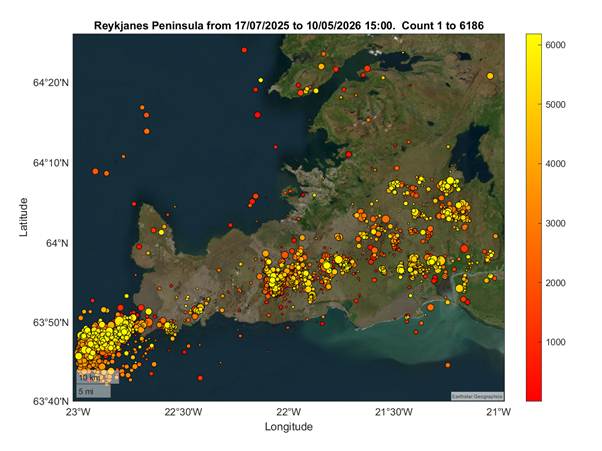
We have created a video of the sequence. Frames are captured in steps of 100 earthquakes.
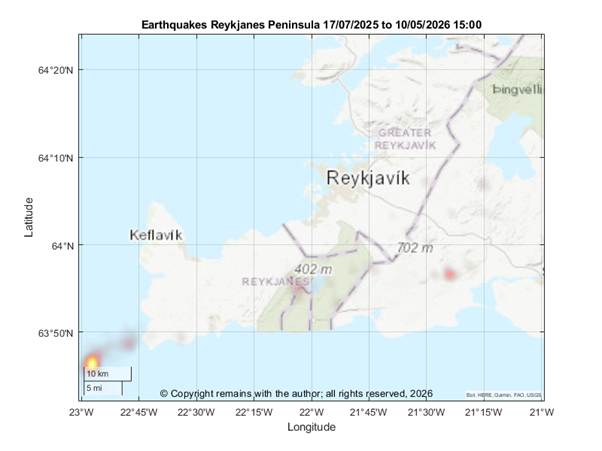
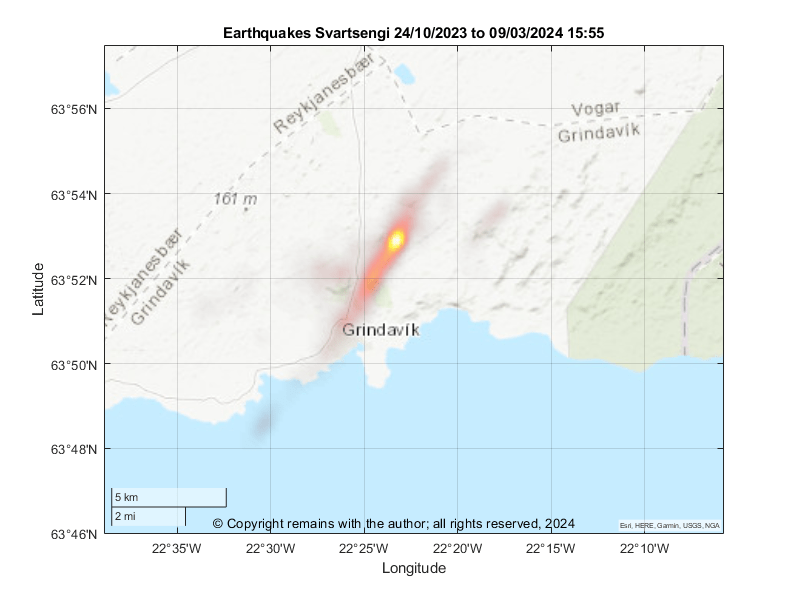
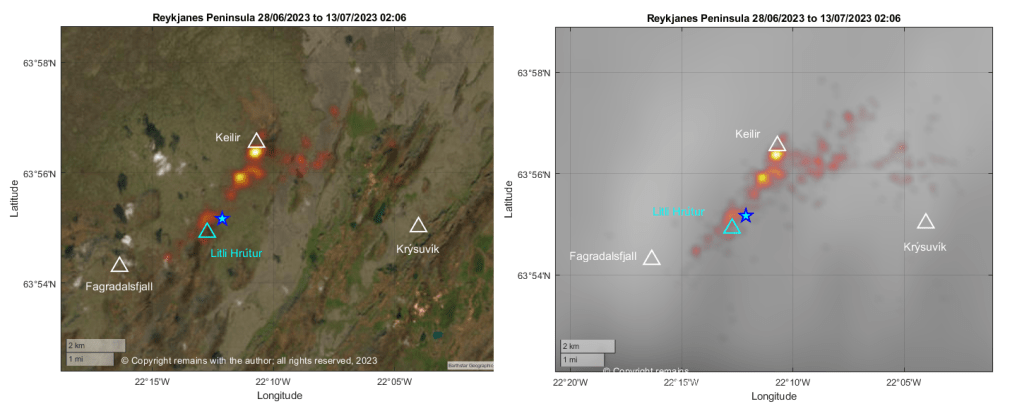
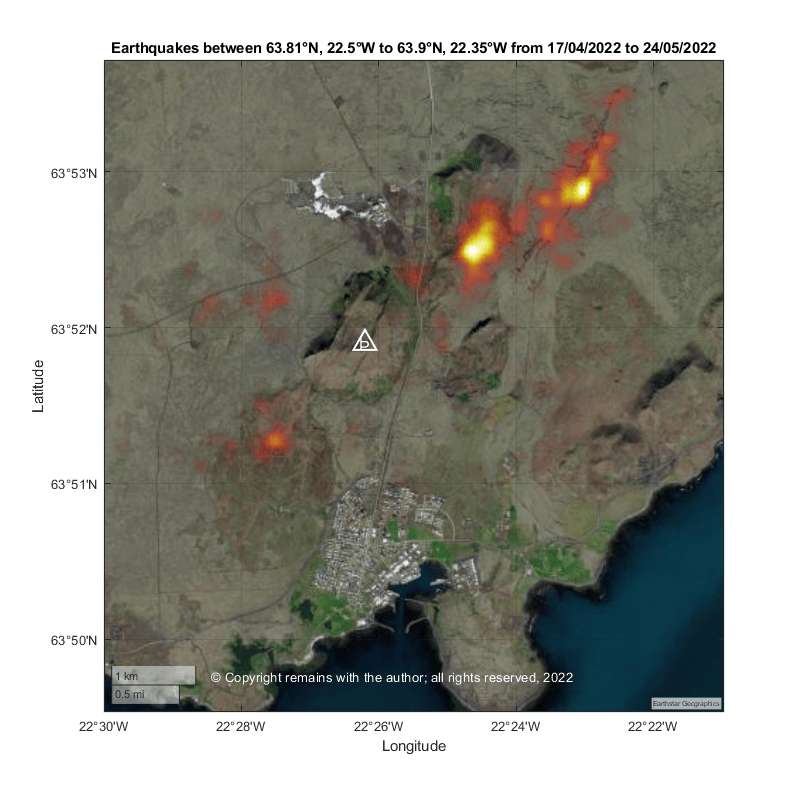
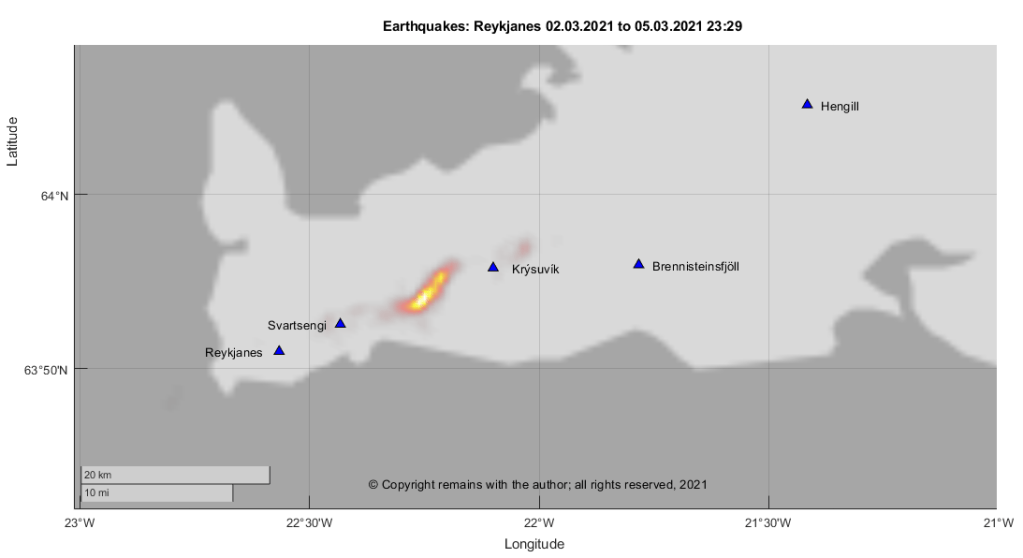
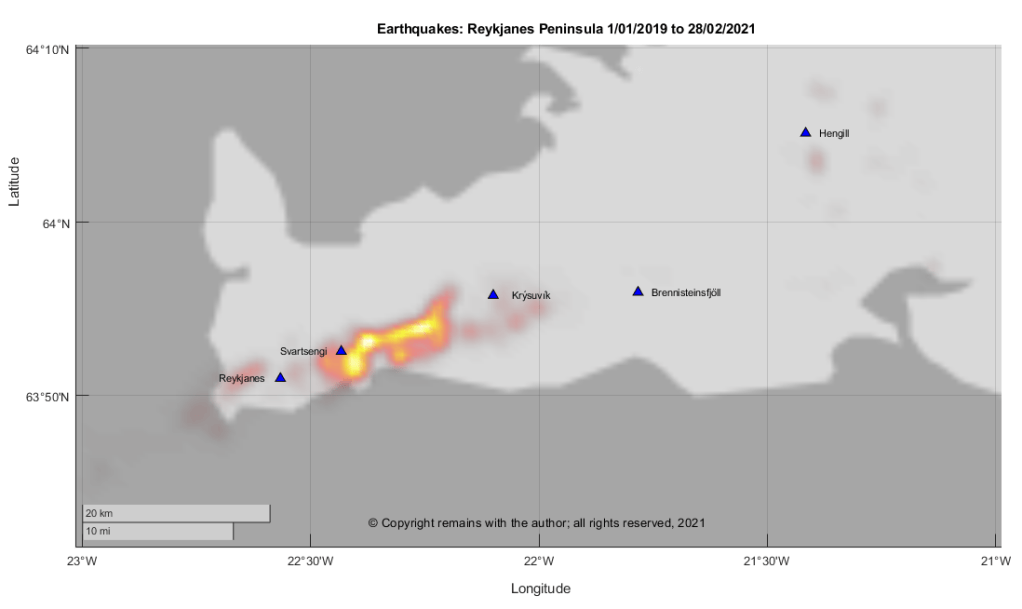
A geodensity plot of the same data set shows that activity is focussed on Eldey out on the Reykjanes Ridge, an area to the west of Hveragerdi near Raufarhólshellir, Krýsuvík and, harder to see, Svartsengi and an area to the west of Grindavík. We had to change the background to improve visibility.
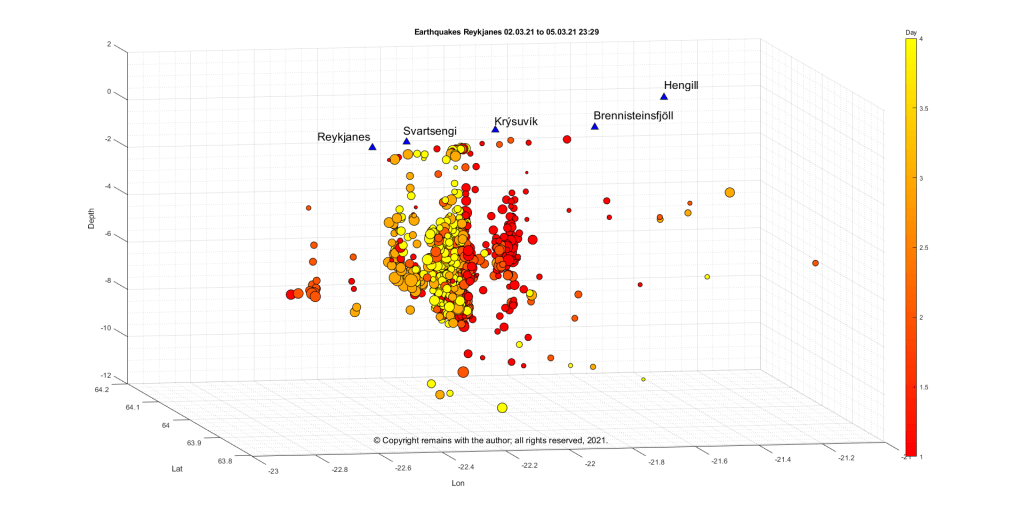
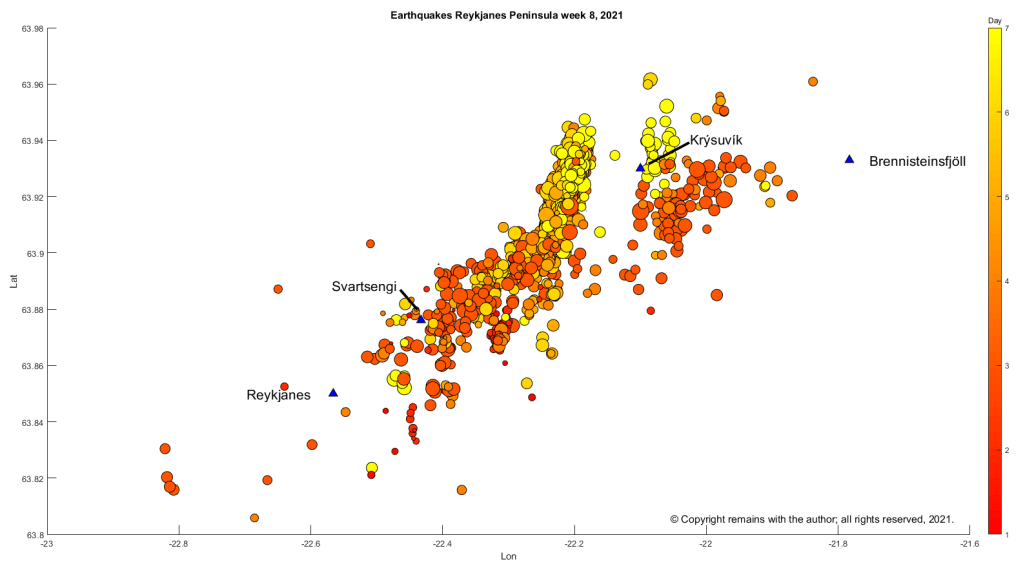
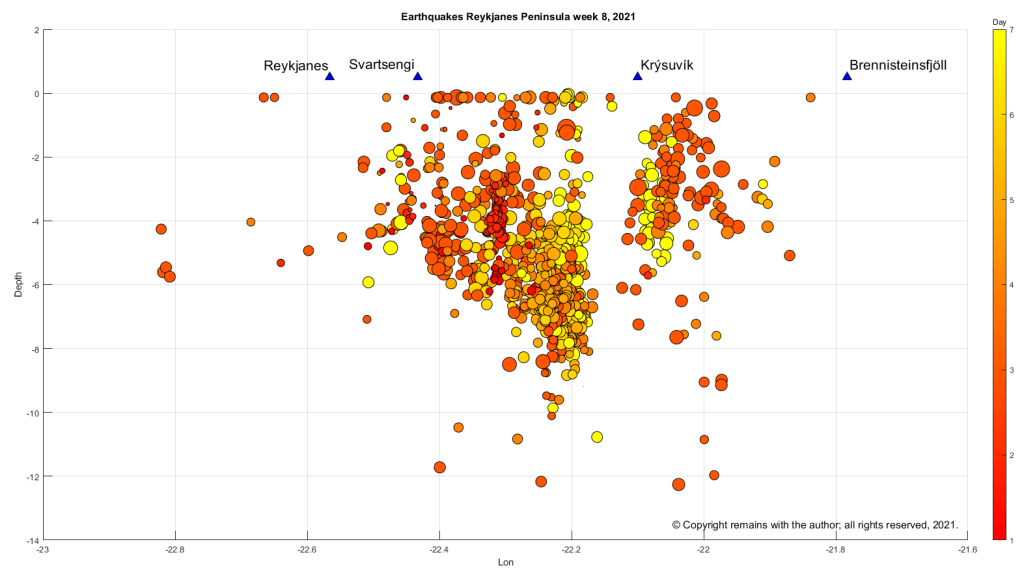
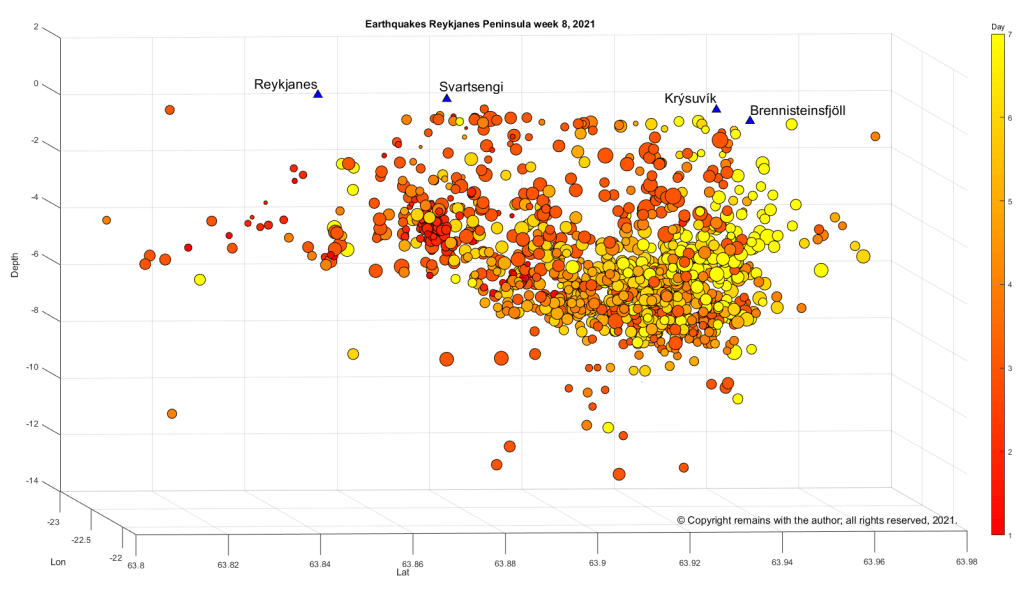
To see what is going on below the surface, we plotted the earthquakes latitude v depth, count per day and depth v longitude; the geoscatter plot is shown for reference.
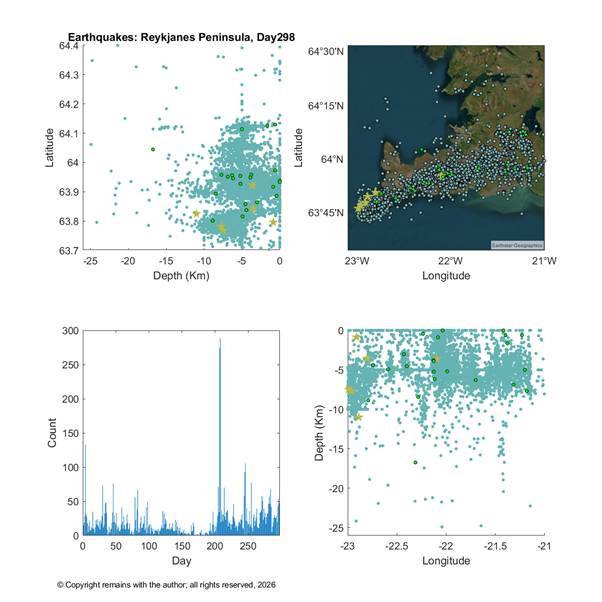
We have created a video of above plots covering the whole 298 day period by day.
Most earthquake activity is occurring in the crust. There would appear to magma doming under the western end of the Reykjanes Peninsula. It is less clear what is going on to the east of this and also further west, but, as most activity is in the crust, we feel that this most likely faults moving to accommodate the uplift under Svartsengi. Whether the activity at Krýsuvík or Eldey is enough to permit magma ascent in the future remains to be seen, but, at the time of writing, they are showing little ground deformation.
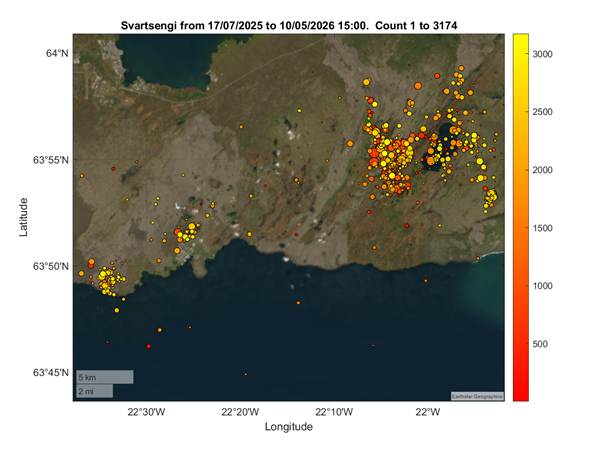
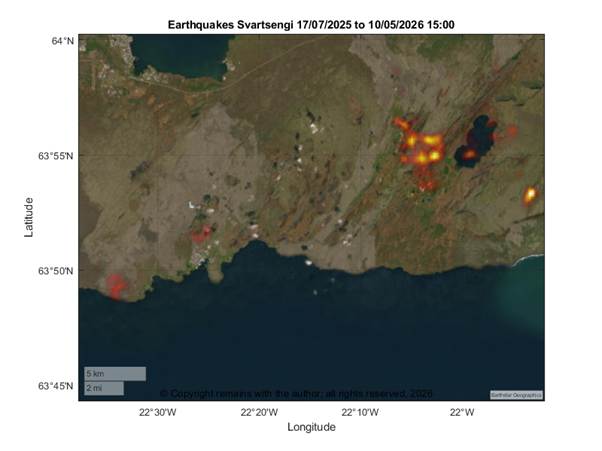
Svartsengi, 17th July 2025 to 10th May 2026
We plotted the area 63.746°N, 22.631°W to 63.996°N, 21.864°W; this covers both the Svartsengi and Krýsuvík regions from the above data set; a total of 3,174 earthquakes.
We have created a video of the sequence. Frames are captured in steps of 100 earthquakes.
A geodensity plot of the same data set shows that activity is focussed on Krýsuvík, Svartsengi and an area to the west of Grindavík.
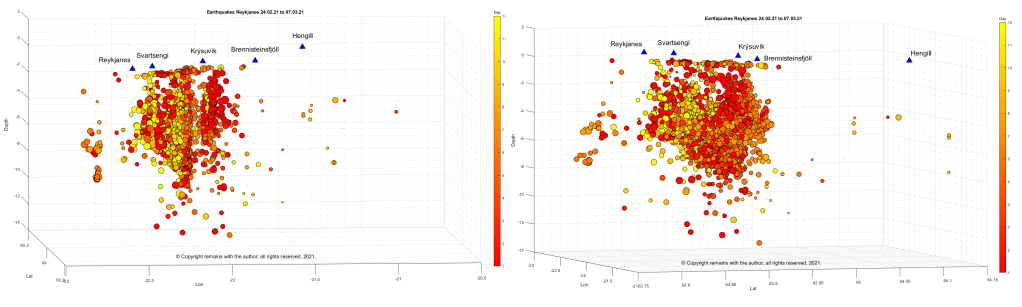
To see what is going on below the surface again, we plotted the earthquakes latitude v depth, count per day and depth v longitude; the geoscatter plot is shown for reference.
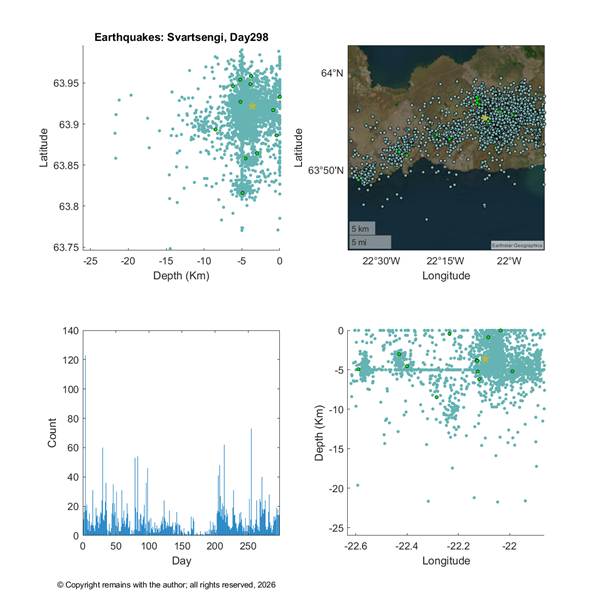
We have created a video of above plots covering the whole 298 day period by day.
Due to the low level of seismic activity in the Svartsengi area, our plots do not add much more than the plots of the Reykjanes Peninsula at the moment in terms of predicting what will happen next. Time will tell when and where the next eruption occurs.
We hope you find the plots useful.
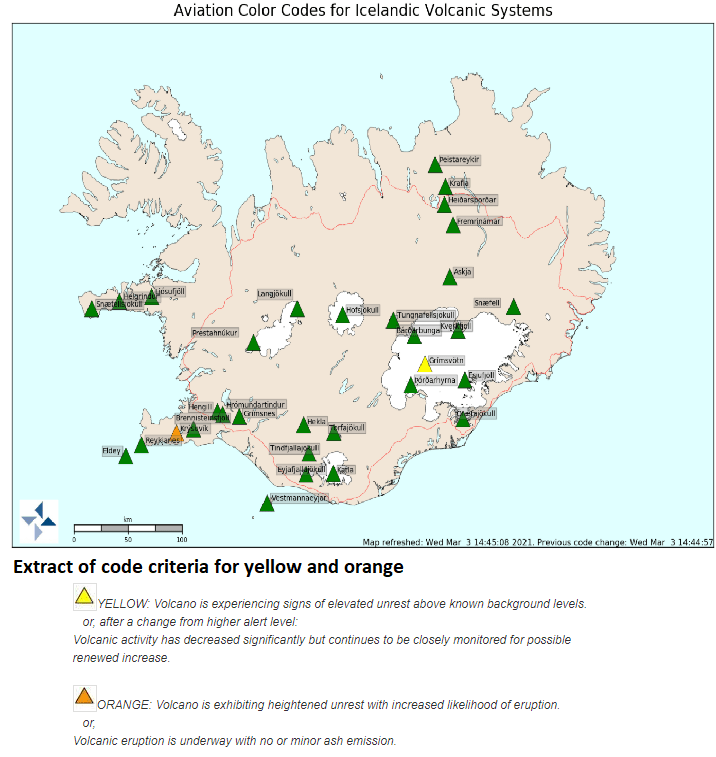
For up to date information and advice, please visit the Icelandic Met Office site: https://en.vedur.is/
An Armchair Volcanologist
© Copyright remains with the author; all rights reserved, 2026.
Sources are credited in the text.


#/media/File:Blue_Lagoon_(6818651629).jpg)