This was going to be a post with an update on the earthquake swarm on the Reykjanes Peninsula, but the magma beat me to it! IMO has just confirmed that a volcanic eruption is underway near Fagradalsfjall at Geldingadalur. The eruption started at 20:45 19.03.2021. It has been named as Geldingadalsgos, after the valley. At the time of writing, the eruption is a small fissure eruption; the fissure is c. 0.5km long.
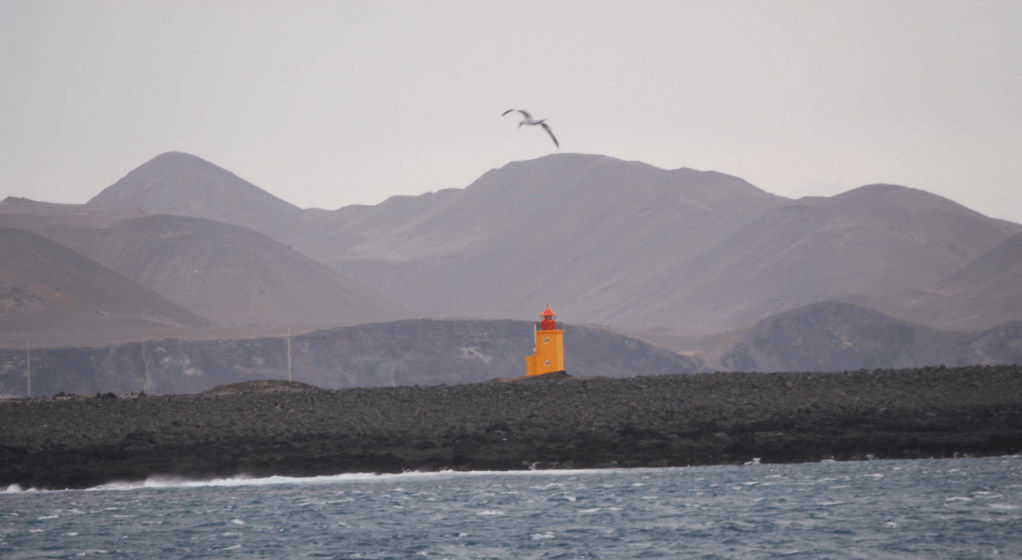
Fig 2: Hópsnes Lighthouse, Grindavik looking towards the Fagradalsfjall system. Image cropped from one by Martin Morris, published under CC-BY-SA 2.0
The public have been advised not under any circumstances go close to the eruption site or on Reykjanesbraut. First responders need to be able to drive freely to assess the situation. Scientists are working on assessing the eruption, the site and possibilities.
People living nearby in Þorlákshöfn have been instructed to stay indoors, close windows and turn up their heating to avoid exposure to any volcanic gases. The Reykjanesbraut has been closed – the main road from the capital region to Reykjanesbær and the international airport at Keflavík.
Fig 3: Aviation code red; source IMO.
Fig 4: IMO’s confirmation of the eruption (third warning down). This is an extract from a screenshot of the page.
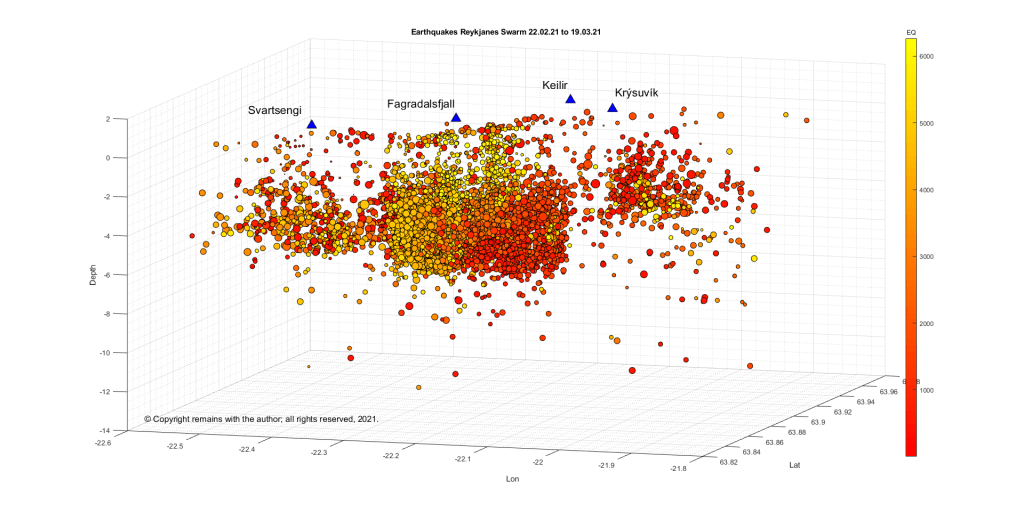
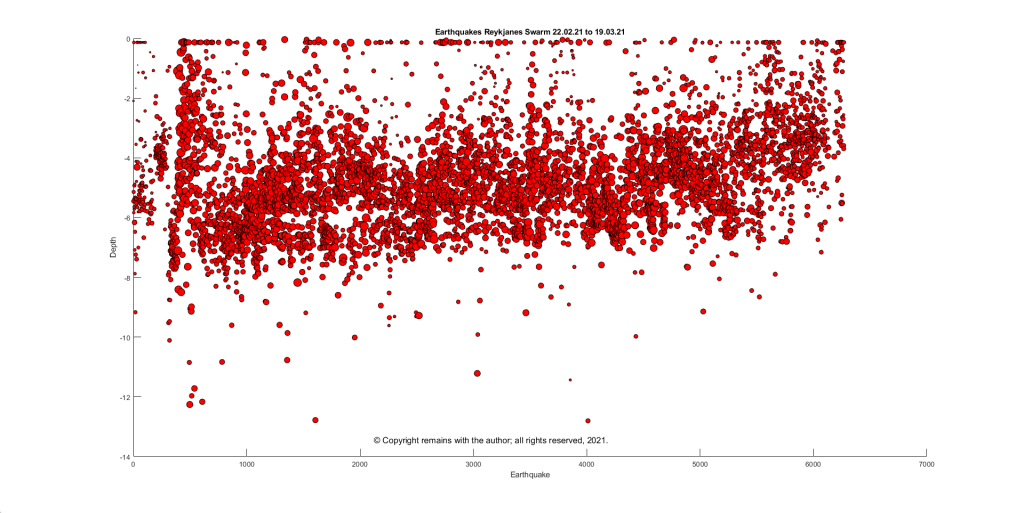
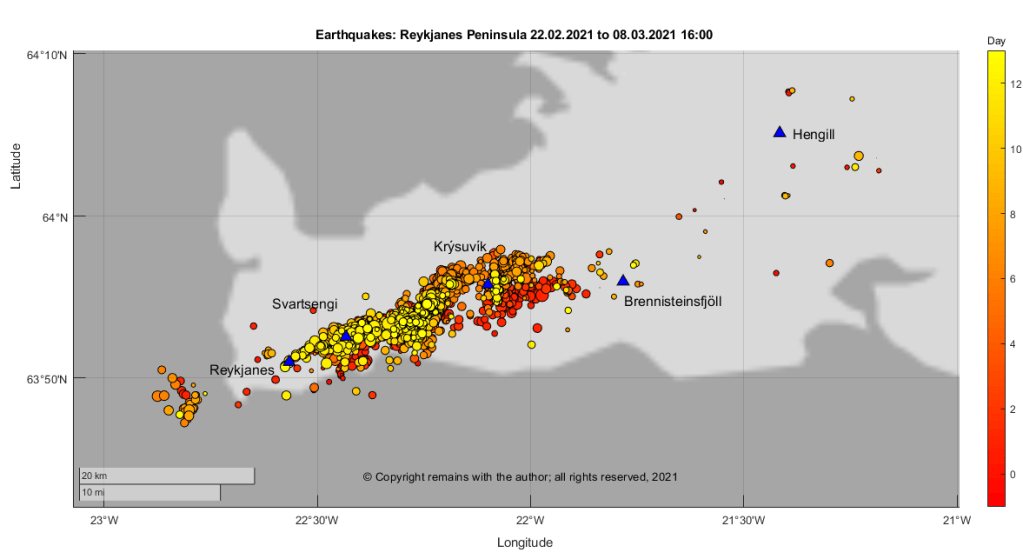
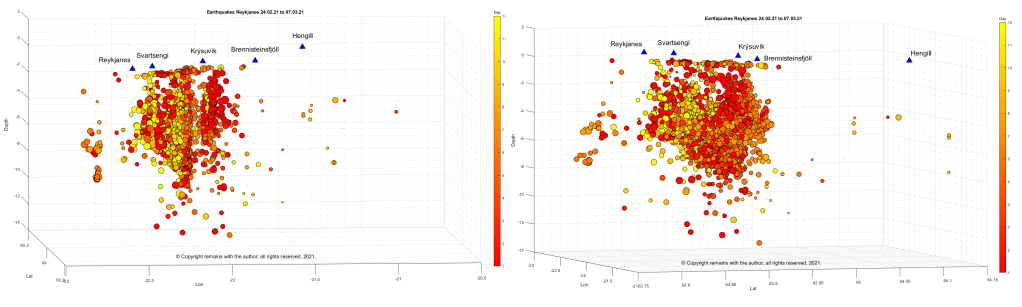
Here are the updated earthquake plots by the author, anyway. The raw earthquake data has been obtained from IMO; this is confirmed earthquakes to date (19.03.2021 15:00). IMO’s page above gives the more recent earthquakes.
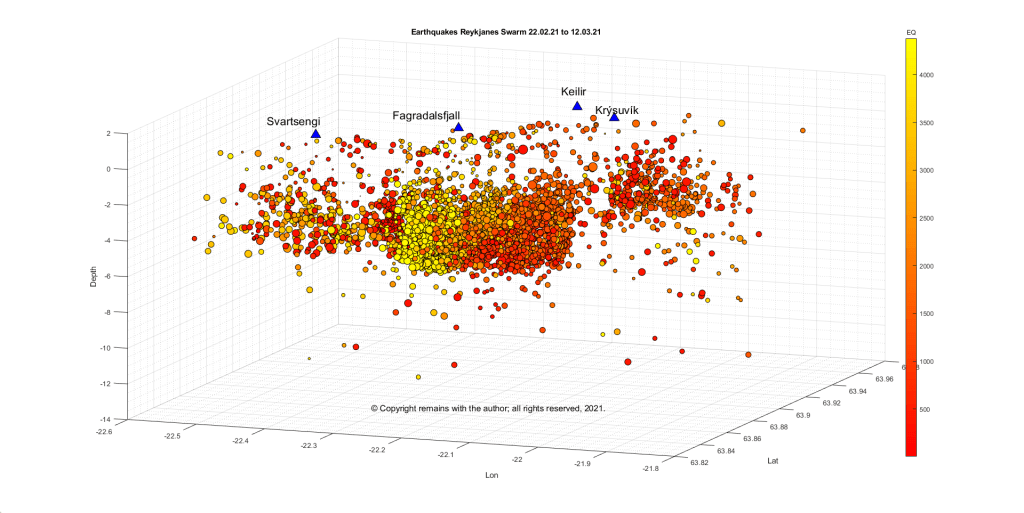
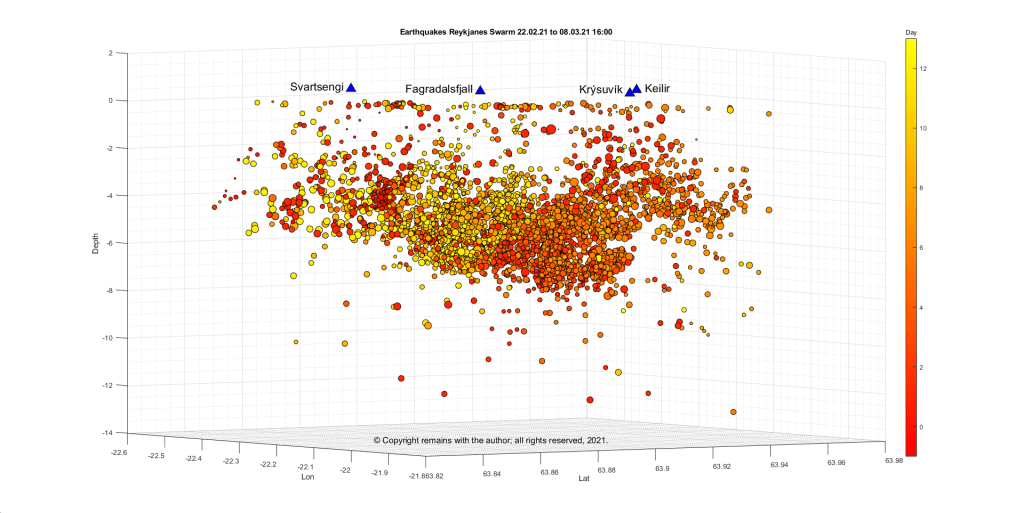
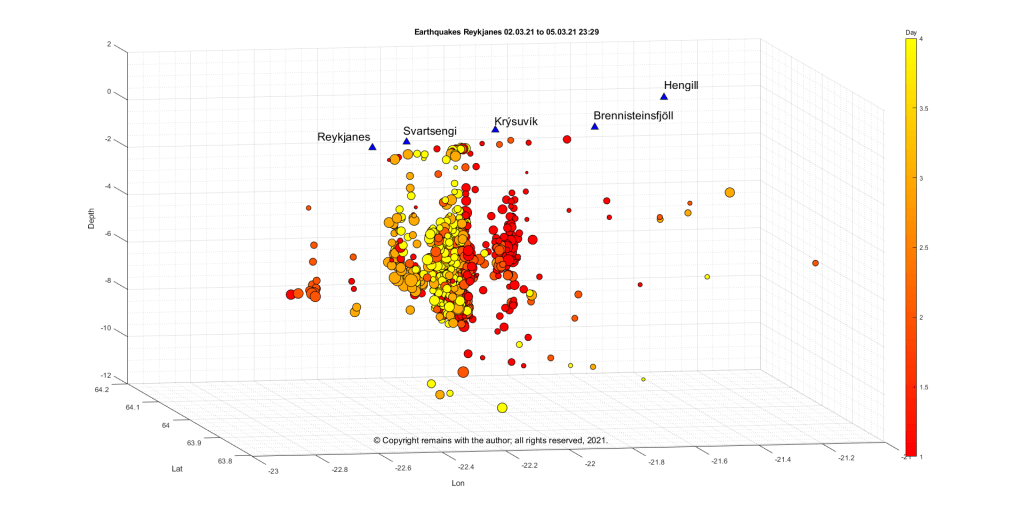
What we see from the plots is that seismic activity has now extended beyond Reykjanes to the west and the swarm is still active. Activity in the swarm is densest to the NE and SW of Fagradalsfjall. The depth plot shows that earthquakes in the swarm are tending to be smaller and shallower.
Extension of the swarm to the west is in keeping with the swarms which have occurred since December 2019.
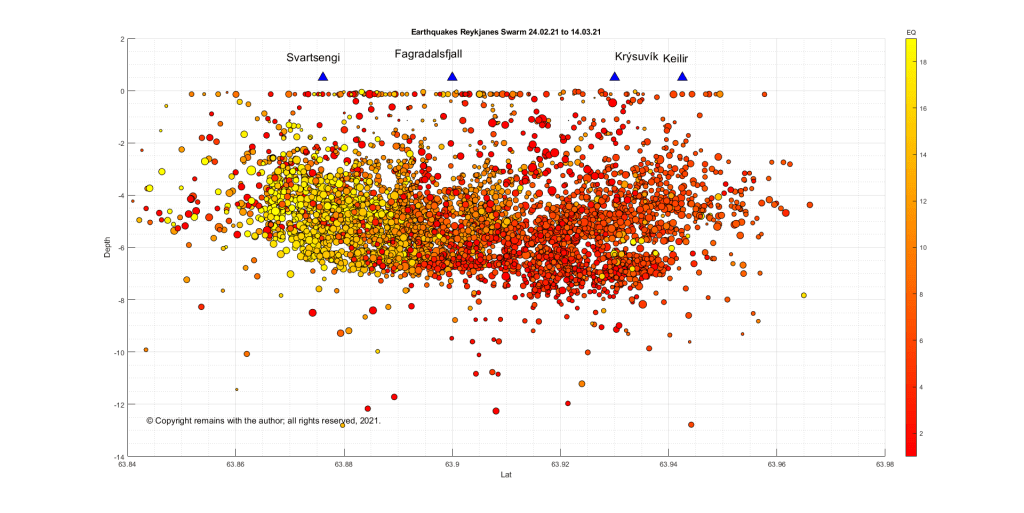
14.03.2021: The magma intrusion on the Reykjanes Peninsula appears to be edging further southward. The longer this continues, the more likely an eruption. New plots added (Figs 13 – 15).
Update 14.03.2021
We have moved updates to the beginning of this post. The original post from 9 March 2021 and the earlier update are below.
We have updated our plots to 14.03.2021 17:46 for the area between 63.83314°N, 22.55148°W to 63.96605°N, 21.8566°W . Here are the results; the magma intrusion appears to be edging slowly further southwards, if we use the Department of Civil Protection’s line that the earthquake locations are the best indicator at the moment of where the magma is.
For the current status and advice, please consult IMO.
The Armchair Volcanologist
Update 12.03.2021
Since we wrote [our original post], the earthquake swarm continues unabated with several thousand more earthquakes and some more tremor pulses.
The Department of Civil Protection report today includes the following:
“Earthquake activity now reaches up to the Nátthagi valley south of Fagradalsfjall, which suggests that the southernmost end of the magma path lies there.
The magma path continues to expand although there is some uncertainty regarding the pace of the magma flow. Data has indicated that the magma path has been moving towards the south coast in the last few days, but latest surveys do not indicate that the path has moved notably in the last 24 hours.
With view of the eruption history and geological research, a volcanic fissure opening south of Fagradalsfjall and reaching the ocean is unlikely. Given the current circumstances, an undersea eruption with associated ash eruption is therefore unlikely.
As has been stated earlier in the Science Board’s notifications, while the magma path continues to expand it must be assumed that an eruption may occur in the area. The longer the current situation lasts, the more likely an eruption becomes. “
They also note that gas measurements are being taken in the area.
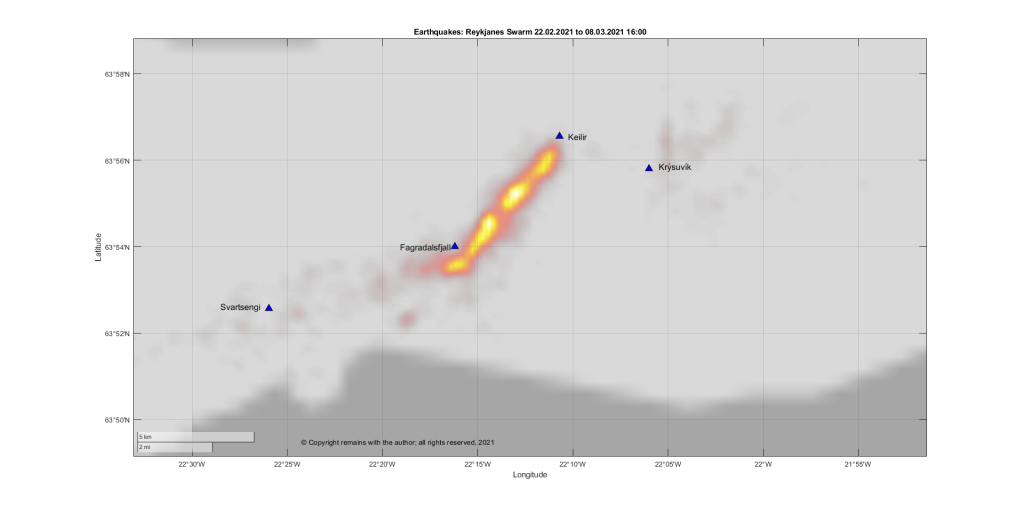
Our updated plots show the seismic activity moving further southward, notably the geodensity plot in Fig 12. There is also some parallel activity further west on a much smaller scale.
For the current status and advice, please consult IMO.
The Armchair Volcanologist
09.03.2021
An eruption considered likely; magma c. 1km below the surface.
Good Afternoon!
Despite the earlier tremor pulses, the Krýsuvík Volcanic System has not yet erupted. However, as seismicity continues to be intense, with well over 34,000 earthquakes recorded by Iceland’s SIL system now since 24 February 2021, it is thought that an eruption is likely.
The latest report from Iceland’s Civil Protection Service Council on March 8, 2021, states that if an eruption occurs, the most likely scenario is still a fissure eruption between Fagradalsfjall and Keilir. A magma intrusion (they use the term tunnel) is forming in the region, with most recent activity at its southern end. Magma has now reached an upper depth of c. 1 km. GPS and satellite readings indicate that the magma flow has decreased in the past week. If the intrusion continues to grow, further surges in seismic activity can be expected.
The earthquakes trending westward from the vicinity of the magma intrusion are thought to be the result of the crust accommodating the intrusion. No other magma movement has been detected during this swarm.
So where are Fagradalsfjall and Keilir? Here is a map (with directions on how to drive from one to the other, not that we would recommend that at the moment).
Fig 1: Extract from Google Maps showing the location of Fagradalsfjall and Keilir.
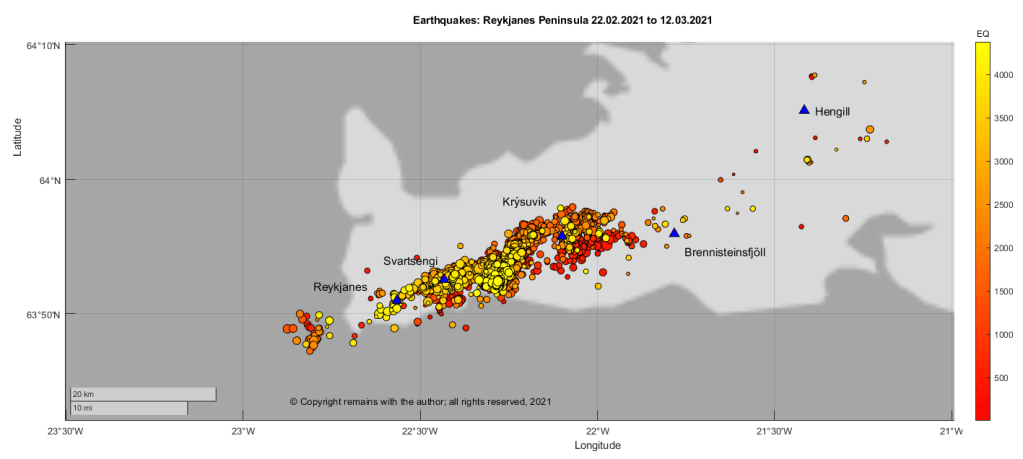
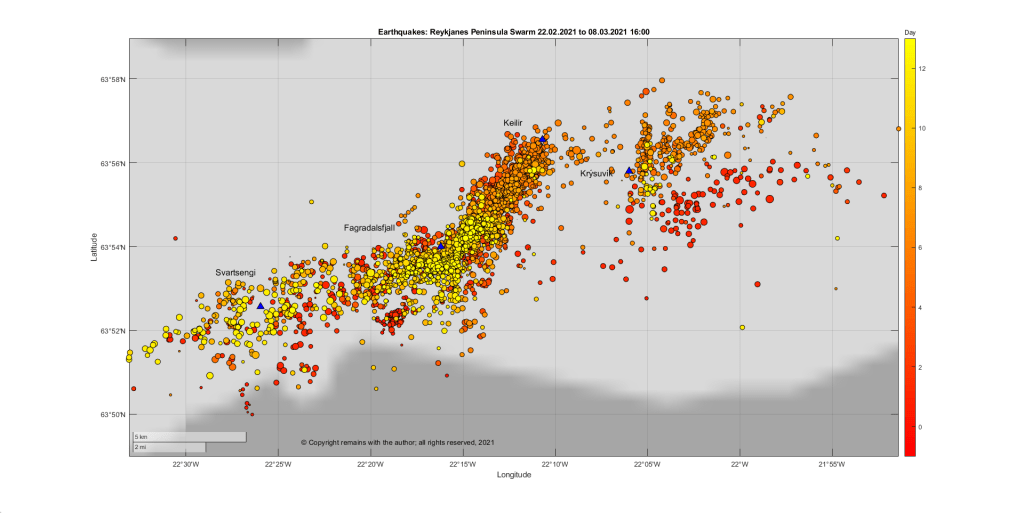
We have plotted the confirmed earthquakes for week 8 and week 9 2021, plus a few hours of yesterday, between 63.7°N, 21.0°W to 64.4°N, 23.0°W download from IMO’s site. Here are the latest plots for the Reykjanes Peninsula, 63.7°N, 21.0°W to 64.4°N, 23.0°W:
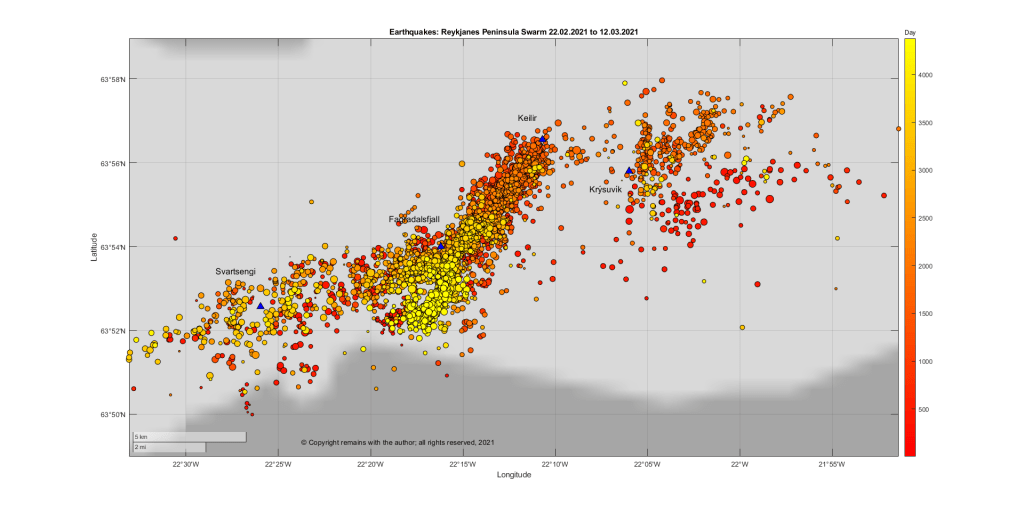
If we zoom in on the area between 63.83314°N, 22.55148°W to 63.96605°N, 21.8566°W we can take a closer look at the intrusion, itself, (or the earthquakes magma movement is causing). The area was selected to take in Svartsengi, Fagradalsfjall, Keilir and Krýsuvík.
Since we downloaded the data for the above plots, IMO have reported another short-lived burst in seismic activity at 05:20 this morning with a seismic tremor Mt. Fagradalsfjall, south of the intrusion.
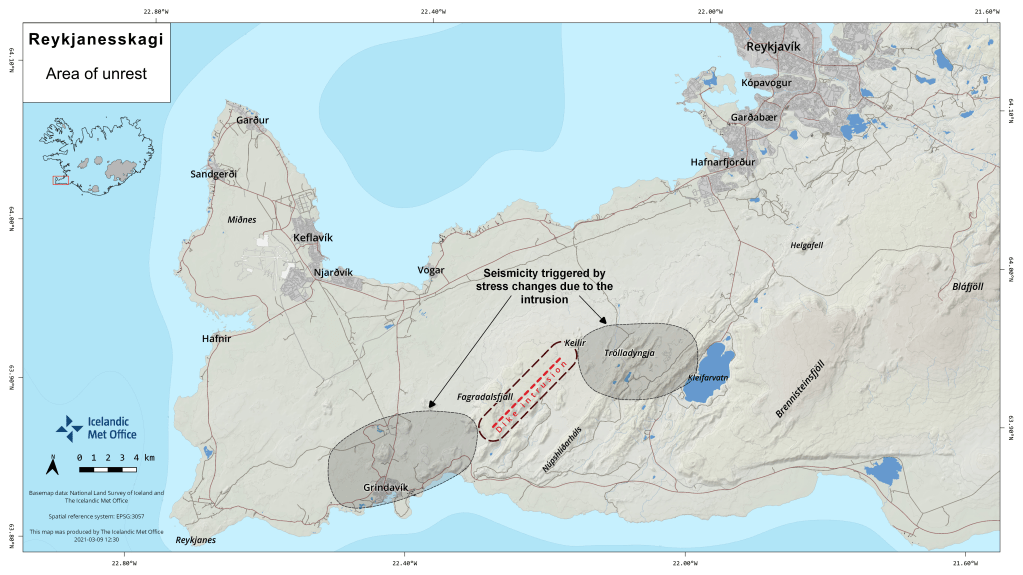
IMO have produced a map of the dike intrusion and the areas of seismic activity that are arising due to the increased tension in the crust caused by the intrusion.
Fig 8: Map by the Icelandic Met Office showing the dike intrusion and the areas of stress.
For the current status and advice, please consult IMO.
3 March 2021 (Updated 07.03.2021 – new plots added).
The earthquake swarm which started on 24 February 2021 between Kleifarvatn and Svartsengi on the Reykjanes Peninsula is continuing.
Fig 1: Keilir. Image cropped from one taken by Michal Klajban, published under CC BY-SA 4.0. Keilir is the dark cone in the background; Spákonuvatn lake is in the foreground.
IMO have raised the aviation code for Krýsuvík to Orange and report a tremor pulse south of Keilir. At the time of writing, no eruption has been confirmed; however, visibility of the area is hampered by weather.
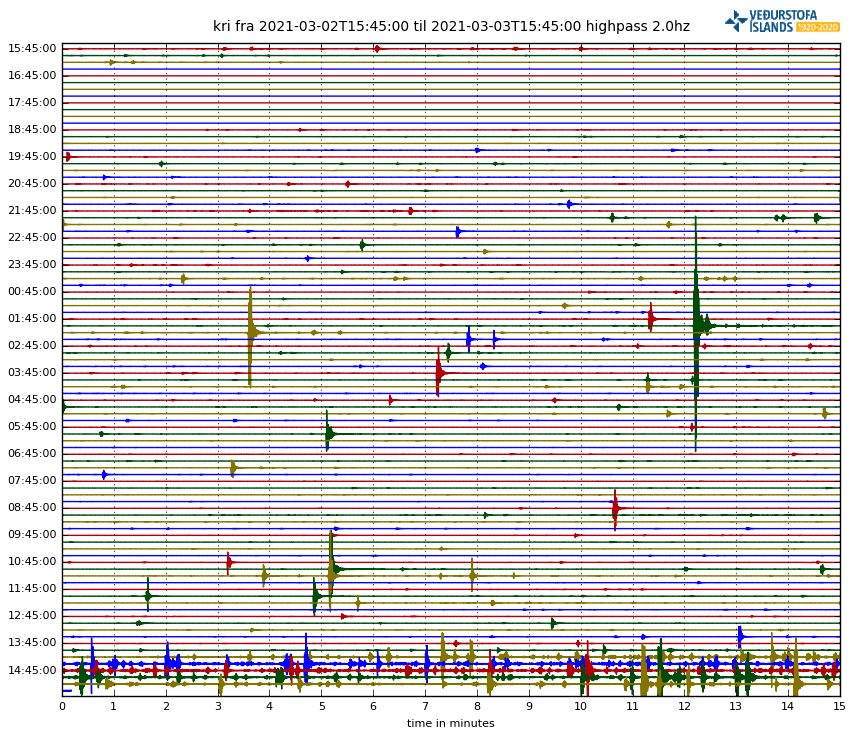
Fig 2: Drumplot showing the onset of the tremor pulse. Source: IMO.
If magma does reach the surface, the most likely scenario is a fissure eruption, which would produce effusive basaltic lava flows and toxic gases, rather than an explosive ashy eruption. If lava meets a significant amount of water, some tephra may be produced.
The likely impact from any eruption is expected to be disruption of air traffic and also road traffic access to and from Keflavík International Airport, if lava flows cross the access road.
Keilir, itself, is a subglacial mound near Krýsuvík formed during the Pleistocene during a fissure eruption. The mound is built of tephra formed when melting ice met magma, topped by lava. Fagradalsfjall, another location associated with the earthquake swarm, is a Pleistocene table-mountain. As lava prefers to take the easy route out, it is unlikely to emerge via these two volcanoes whose lavas would be fairly solid – hence the expectation of a new fissure swarm.
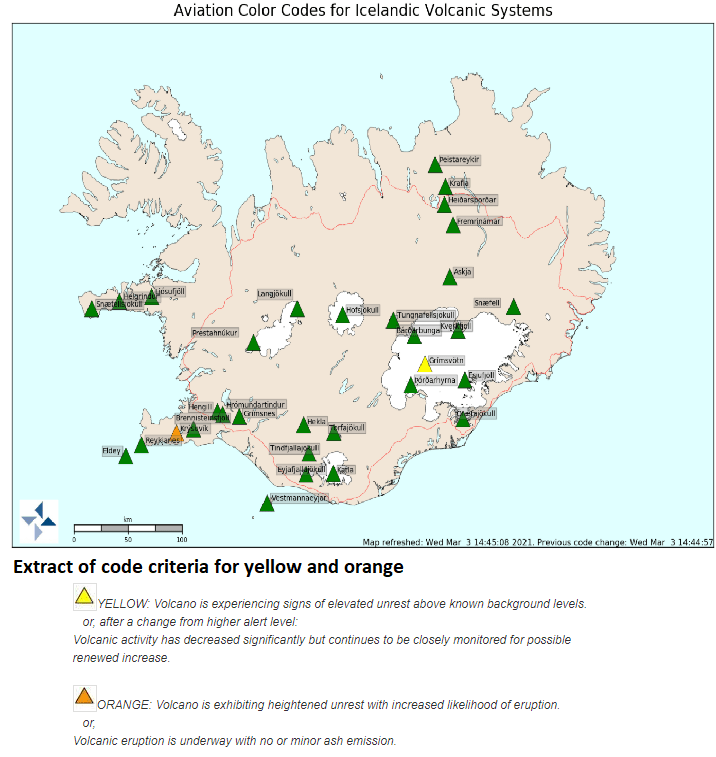
Fig 3: Current aviation codes for Iceland. Source: IMO.
For status updates, please consult IMO.
A local news service that is also providing updates in English is the Reykjavik Grapevine.
Life is not easy for the research scientists monitoring events. Two had to be rescued after having been separated from the main party while studying gas emissions. Spare a thought for the risks they take.
The public have been advised to stay clear of the area at least until it is known where and how lava emerges and where it would be safe to observe the eruption.
In our excitement at the thought of a possible eruption we overlooked the very real risk of larger earthquakes, if the intensity of the swarm continues: up to 6.0 M near Fagradalsfjall and up to 6.5 M in the Brennisteinfjöll range. Be careful if you are in the area.
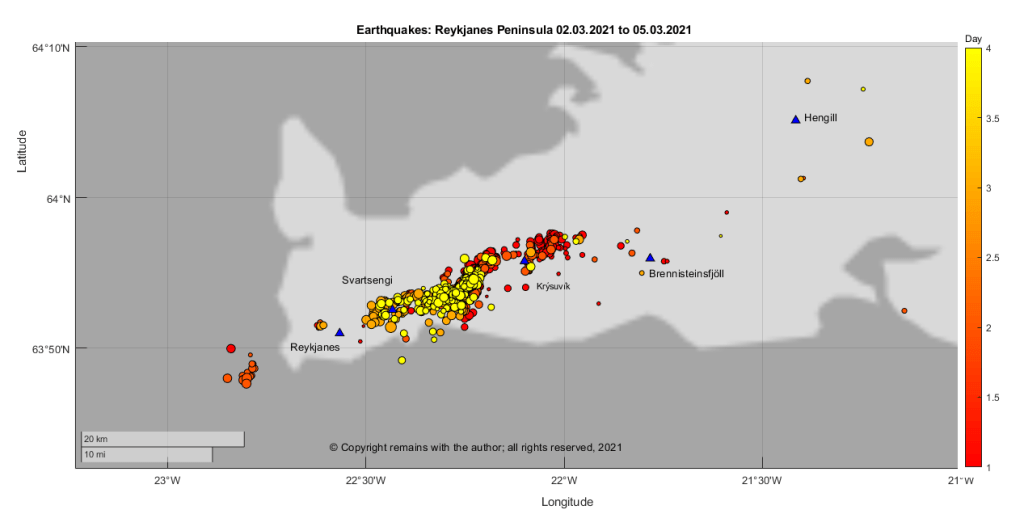
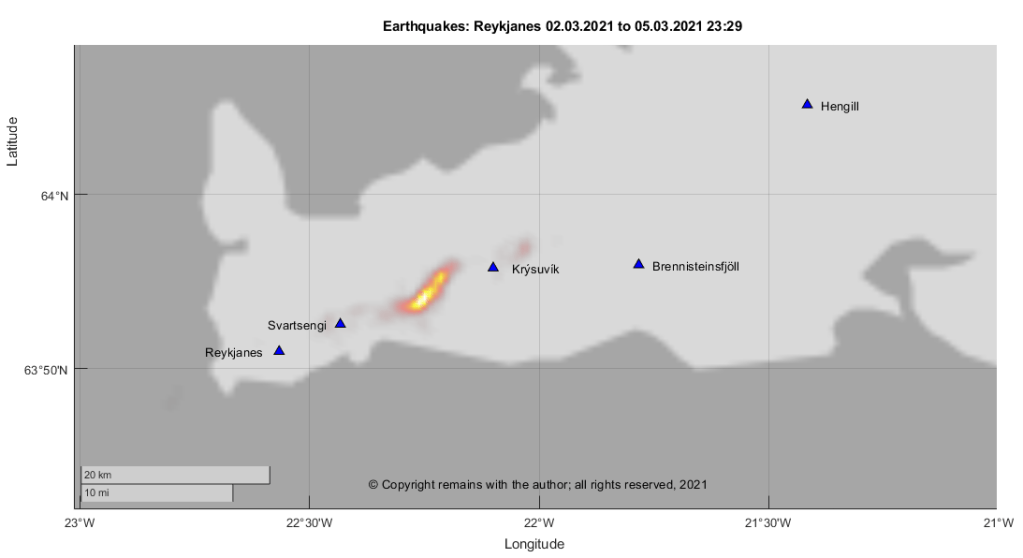
Update 05.03.2021 23:29
We have plotted the earthquakes with a quality of 99.0 from IMO’s page showing the earthquakes for the last 48 hours for the Reykjanes Peninsula for the period 2 March 2021 to 5 March 2021 (23:29) (we were too slow to capture 1 March 2021). Here are the results. Colour coding in the scatter plots is by day and size reflects magnitude. The geodensity plot is weighted by magnitude.
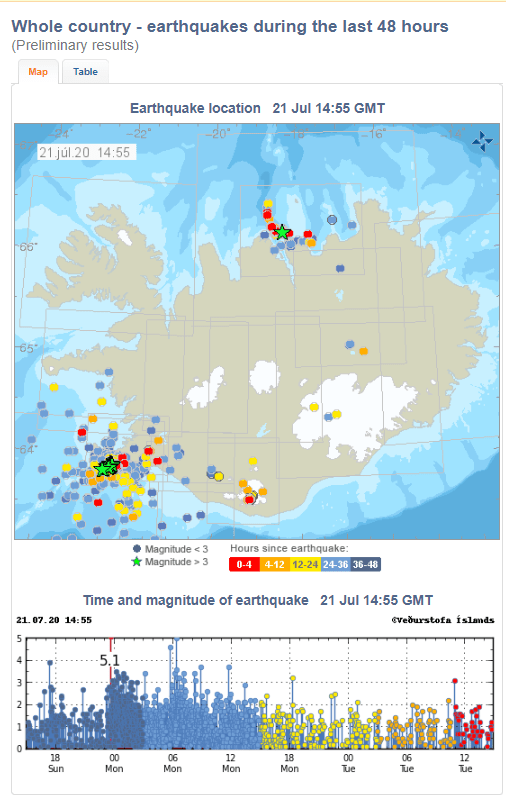
A large earthquake swarm started on the morning of 19 July at around 1:30 am at Fagradalsfjall on the Reykjanes Peninsula. The largest earthquake had a magnitude of 5.1M. At the time of writing, there had been 1,635 earthquakes in the last 48 hours recorded on IMO’s website (note that not all of these have been confirmed). IMO’s map and breakdown of the swarm are shown below:
Fig 1: Map of earthquakes in Iceland over the past 48 hours. Source: IMO
Close up of the Reykjanes Peninsula:
Fig 2: Map of earthquakes in the Reykjanes Peninsula over the past 48 hours. Source: IMO
Magnitude
Number
< 1.0
720
1.0-2.0
723
2.0 -3.0
162
>3.0
30
Fig 3: Breakdown of earthquakes by magnitude
This swarm is occurring on the east side of the swarms on the Reykjanes Peninsula which started late last year. IMO have reported that these swarms (still ongoing) are associated with multiple magma intrusions. The aviation code for the area is still green (IMO). IMO are in the process of evaluating the Fagradalsfjall swarm.
The swarm at the Tjörnes Fracture Zone is still ongoing.
The eagle-eyed amongst you will note that there is some seismic activity at Katla. Whether this will result in anything is anyone’s guess at the moment.
We have not yet updated our earthquake data-set for the current swarm. We will wait until IMO has had a chance to confirm more earthquakes
Update 24 July 2020
The swarm at Reykjanes is now less intense. In the meantime, Katla produced a shallow 3.0 M. IMO have remarked that earthquakes in the summer at Katla are not uncommon.
From memory, Katla was seismically active before the intense swarms started in August 2014 at Barðarbunga in the run up to the eruption at Holuhraun. This may have been a coincidence.
Fig 4: Map of earthquakes in Iceland over the past 48 hours. Source: IMO