Updated earthquake density video added (uses satellite image as background). 12.04.2021
Good Morning!
Geldingadalur – Where Are We at Now?
Since we last wrote, the new volcano at Geldingadalur has continued to erupt with a lava output rate between 5 m3 per second and 10 m3 per second, filling the Geldingadalur valley with more lava. The University of Iceland has confirmed that the early lava erupted has a magnesium content of 8.5%, a low titanium dioxide content and is more depleted in rare earth elements (low HREE to LREE ratio) than earlier historic lavas, indicating that it is a more primitive lava sourced from the lithospheric mantle at a depth of between 17 km and 20 km.
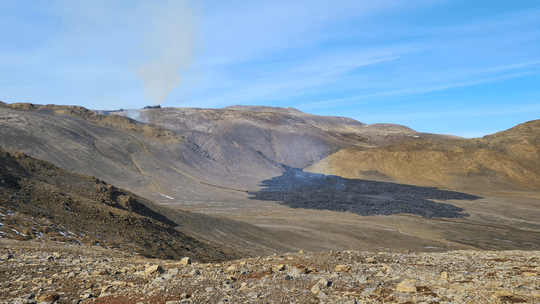
On 5 April 2021 at around midday, a new fissure opened up about 700 m north east of the original eruption site. The fissure, spotted by a sightseeing helicopter, was quickly confirmed by the RUV.is webcam monitoring Geldingadalur. Fortunately, no-one was in the vicinity at the time due to bad weather and sheer good luck; the site had been open to visitors at the time. The fissure is around 200 m long. Lava from the fissure is flowing into the Meradalir valley.
Fig 1: New fissure on 05.04.2021 in the foreground with lava flowing to Meradalir on the left of the image. The original Geldingadalur eruption is on the right of the image. Photo IMO.
Fig 2: Lava from the first new fissure entering Meradalir at 15:00 06.04.2021. The fissure itself is on the ridge in the background (Photograph: Public Protection/Björn Oddsson).
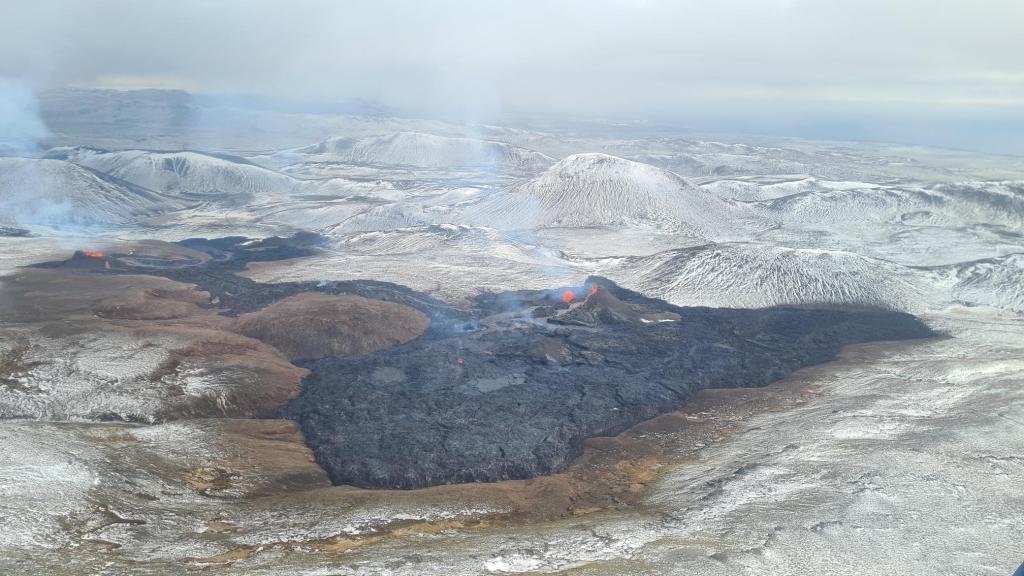
At around midnight on 6 April 2021, a second fissure opened up between the earlier fissure and the original eruption site. This had been preceded by a landslip earlier in the day. Lava from this fissure is now flowing into both the Geldingadalur and Meradalir valleys, linking the eruption sites. It is believed that the three eruption sites belong to the same fissure.
Fig 3: Photograph from Public Protection/Björn Oddsson showing the three eruption sites and lava flows.
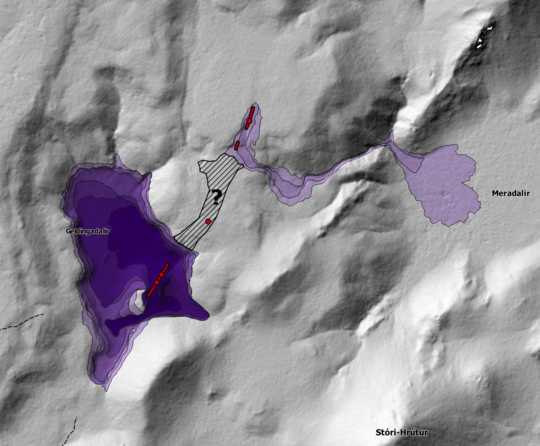
Fig 4: Map showing the location of the three eruption sites from IMO. The fissures are shown as red lines and dots; and, lava flows are based on photography.
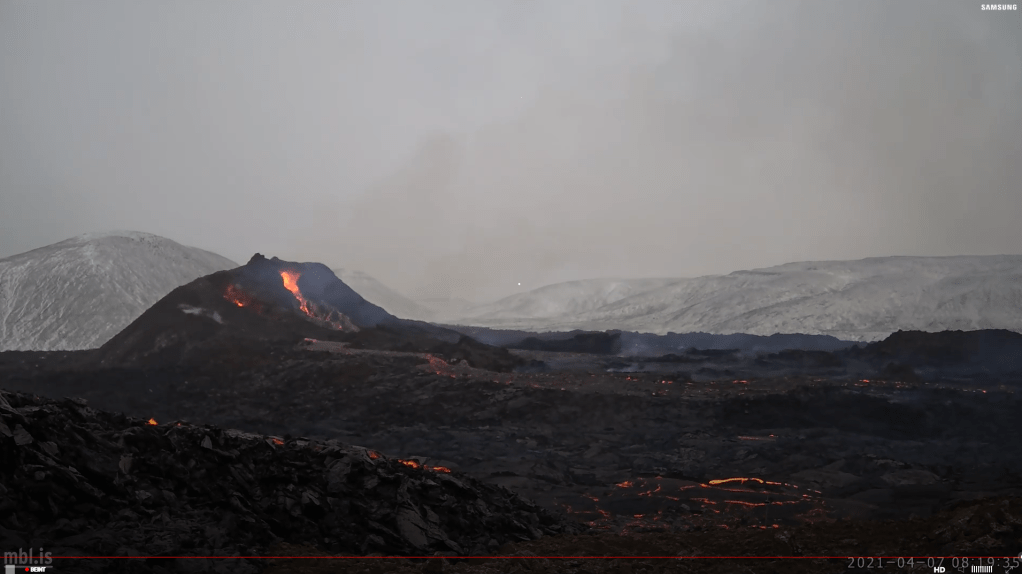
Unfortunately, one of the webcams set up by mbl.is to monitor the Geldingadalur cones was lost; its last image is shown below. We thank mbl.is for providing the webcam; we viewed its images with a lot of interest.
Fig 5: Screenshot from the mbl.is webcam.is set up to monitor the cones at Geldingadalur. This may be this webcam’s last image. The lava flow to the lower left of the image is from the newest fissure.
Like the original eruption site, neither fissure opening was heralded by an increase in seismicity in the immediate vicinity.
Seismicity Post the Initial Eruption
We have updated our earthquake plots for the period 19.03.2021 to 06.04.2021. We can confirm that there is very little earthquake activity in the vicinity of Geldingadalur. The fissures are not giving any seismic warning; seismic activity near Keilir dominates. It is perhaps surprising that magma has not made its way to the surface north east of Fagradalsfjall; does magma finds it easier to make its way through older fault-ridden Pleistocene rock that has not been covered in tougher historic lavas?
We have also tried our hand at making a video of the earthquake density plots by month from 2008 to 6 April 2021. Months are numbered from January 2008 (Month 1) to April 2021 (Month 160, which only has 6 days). If you make it all the way through, you will see that Fagradalsfjall has had several swarms, albeit much smaller than the current one. Enjoy!
The eruption at Geldingalur, Reykjanes, Iceland, which started on 19.03.2021 at 20:25, is continuing unabated as I write. The volcano is happily bubbling away building somewhat unstable but impressive looking cones and covering the Geldingadalur valley floor with lava.
Fig 1: Cones of Geldingadalur, cropped from an image by Berserkur, published under CC BY-SA 4.0
The eruption is steadily increasing at the time of writing; it has a lava output of 5 -7m3 per second. IMO have estimated that the valley would fill enough for lava to overflow into the neighbouring valley, Meradalir, in a matter of days at the current eruption rates.
Fig 2: Image by IMO. Expected path of the lava over the next few days at the current eruption rate.
Scientists at the University of Iceland are analysing the lava. To date, they have reported that the lava is a primitive one (i.e. little magma evolution in the crust), indicative of a mantle source at a depth of 17 km to 20 km.
Geological Setting
The Reykjanes Peninsula lies on oceanic crust created by the Mid Atlantic Ridge. The Peninsula, itself, straddles the Ridge. The crust here is 15 km thick, which is unusual so close to a spreading ridge. However, Iceland is a basaltic plateau overriding a mantle plume. Both the mantle plume and the Mid Atlantic Ridge influence formation of the crust. There are no magma chambers / reservoirs in the crust on the Peninsula; magma tends to ascend directly from the mantle.
The Peninsula is made up of lava shields, móberg hills, table mountains and fissure-fed lava flows and crater rows. The shield volcanoes on the Peninsula formed at the beginning of the Holocene between 10,000 and 7,000 years ago. Shield volcanoes form from hot picrite or olivine tholeiitic basaltic lava flows with rates of c . 5m3 per second. The móberg hills formed from submarine fissure eruptions and consist of pillow lavas, breccias and tuffs. The table mountains were formed from subglacial activity, which had the activity not been constrained by the ice cap, would have resulted in shields. Later Holocene activity has comprised effusive tholeiitic fissure eruptions which formed crater rows and produced large lava flows that now cover some of the earlier formations. Historic activity has been between 940 AD and 1340 AD, including the Reykjanes Fires of 1210 AD to 1240 AD; and, the Krýsuvík Fires of 1151 AD to 1188 AD.
Geldingadalur, itself, is a small valley to the south east of the summit of Fagradalsfjall, a 385m high hyaloclastite subglacial Pleistocene table mountain formed during the Weichselian glacial period, with a subaerial lava cap on its northwest part. It is currently classified as part of the Krýsuvík Volcanic System.
The Fagradalsfjall area is seismically very active, with large earthquake swarms, notably in 1998, 2000, and 2004, and again now as part of the new volcano-tectonic episode on the Reykjanes Peninsula that started in December 2019. Various studies from previous seismic activity have noted extensive faulting under the south west part of Fagradalsfjall; these faults strike N-S and NE -SW. In addition, there are two clusters of faults under the eastern part.
Earlier swarms in the current volcano-tectonic episode have resulted in magma intrusions, such as the one at Mt Þorbjörn which we discussed last year, but no eruption. The latest earthquake swarm which started on 22 February 2021 is the only one to result in an eruption at the time of writing.
Seismicity in the Current Swarm
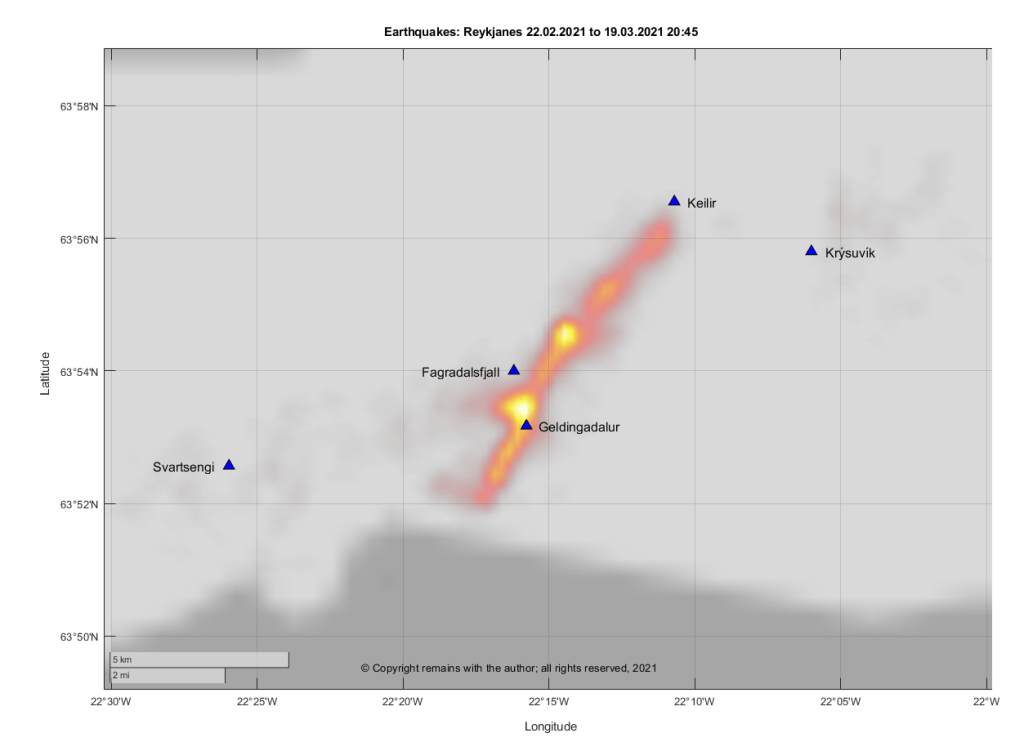
We have updated our plots for the Reykjanes Peninsula and dividing them between the run up to the eruption on 19 March 2021 at 20:45 and after the eruption to 26 March 2021 15:55.
The plots preceding the eruption repeat the ones shown earlier so we are just showing the geodensity plot for comparison. You will note that the earthquakes do not reach down to 15 km in the current swarm to date. However, there were one or two deeper earthquake in some of the earlier episodes.
The plots for the period after the onset of the eruption (19.03.2021 20:45 to 26.03.2021 15.55) show that activity is concentrated on Geldingadalur and two spots north east of Fagradalsjall. Seismic activity has also extended further south.
3 March 2021 (Updated 07.03.2021 – new plots added).
The earthquake swarm which started on 24 February 2021 between Kleifarvatn and Svartsengi on the Reykjanes Peninsula is continuing.
Fig 1: Keilir. Image cropped from one taken by Michal Klajban, published under CC BY-SA 4.0. Keilir is the dark cone in the background; Spákonuvatn lake is in the foreground.
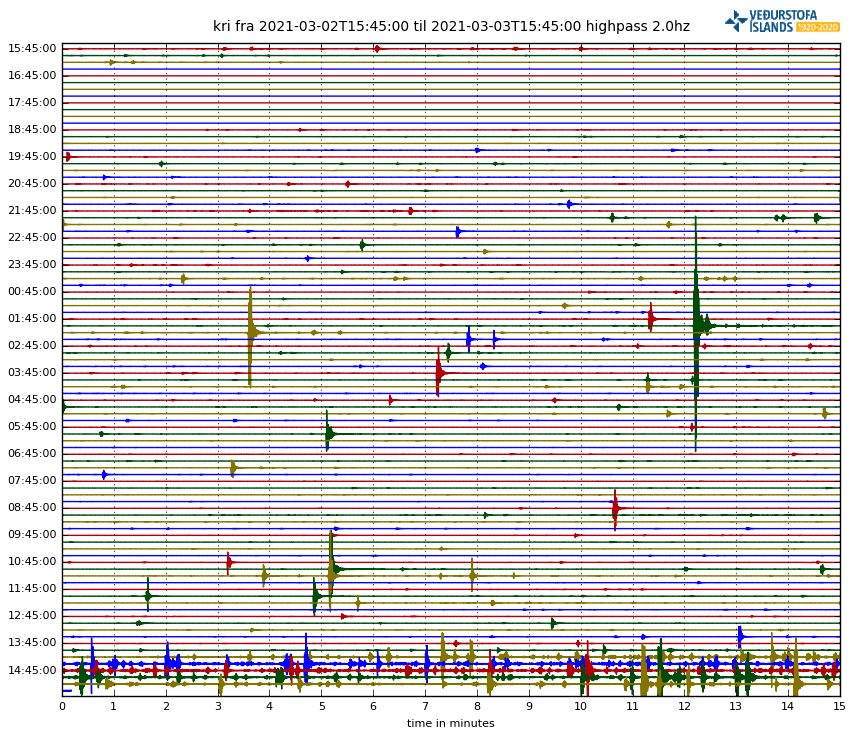
IMO have raised the aviation code for Krýsuvík to Orange and report a tremor pulse south of Keilir. At the time of writing, no eruption has been confirmed; however, visibility of the area is hampered by weather.
Fig 2: Drumplot showing the onset of the tremor pulse. Source: IMO.
If magma does reach the surface, the most likely scenario is a fissure eruption, which would produce effusive basaltic lava flows and toxic gases, rather than an explosive ashy eruption. If lava meets a significant amount of water, some tephra may be produced.
The likely impact from any eruption is expected to be disruption of air traffic and also road traffic access to and from Keflavík International Airport, if lava flows cross the access road.
Keilir, itself, is a subglacial mound near Krýsuvík formed during the Pleistocene during a fissure eruption. The mound is built of tephra formed when melting ice met magma, topped by lava. Fagradalsfjall, another location associated with the earthquake swarm, is a Pleistocene table-mountain. As lava prefers to take the easy route out, it is unlikely to emerge via these two volcanoes whose lavas would be fairly solid – hence the expectation of a new fissure swarm.
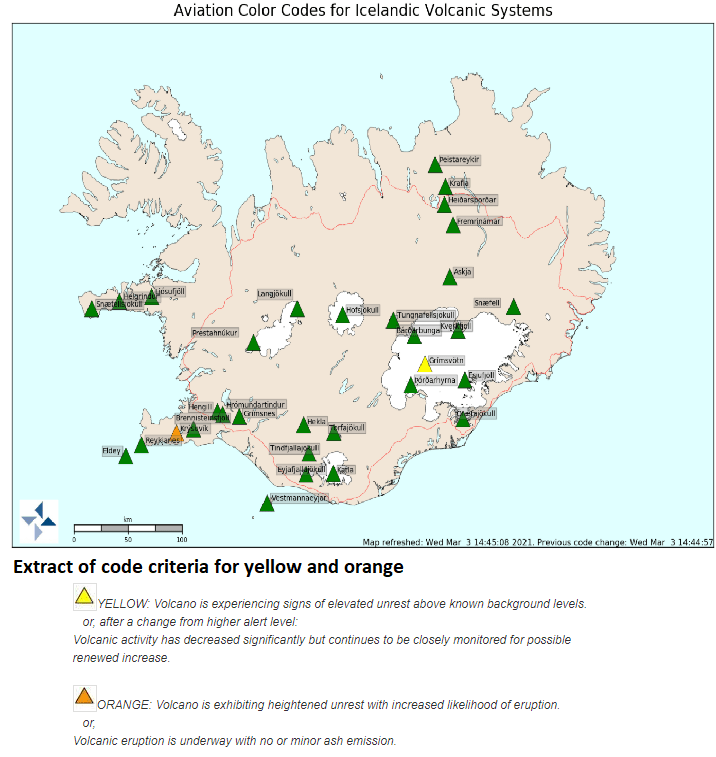
Fig 3: Current aviation codes for Iceland. Source: IMO.
For status updates, please consult IMO.
A local news service that is also providing updates in English is the Reykjavik Grapevine.
Life is not easy for the research scientists monitoring events. Two had to be rescued after having been separated from the main party while studying gas emissions. Spare a thought for the risks they take.
The public have been advised to stay clear of the area at least until it is known where and how lava emerges and where it would be safe to observe the eruption.
In our excitement at the thought of a possible eruption we overlooked the very real risk of larger earthquakes, if the intensity of the swarm continues: up to 6.0 M near Fagradalsfjall and up to 6.5 M in the Brennisteinfjöll range. Be careful if you are in the area.
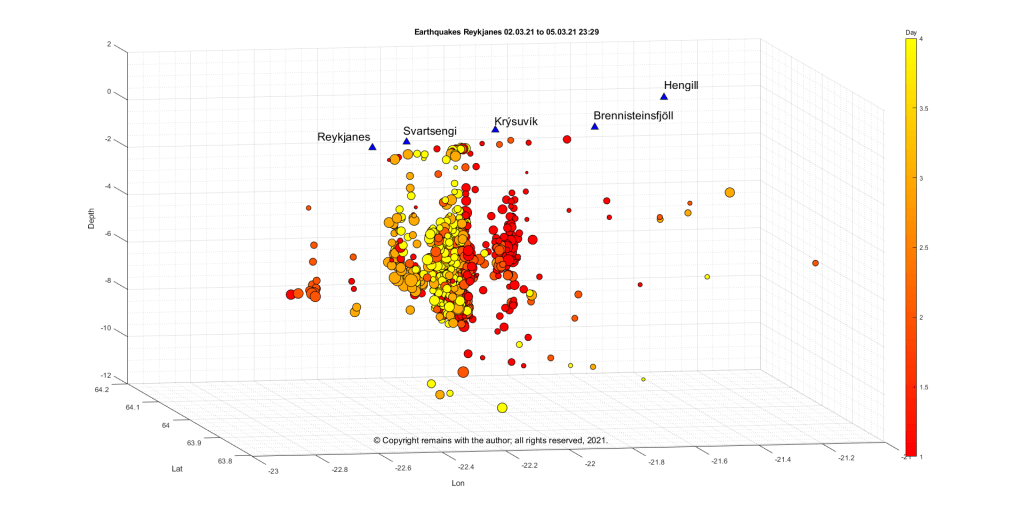
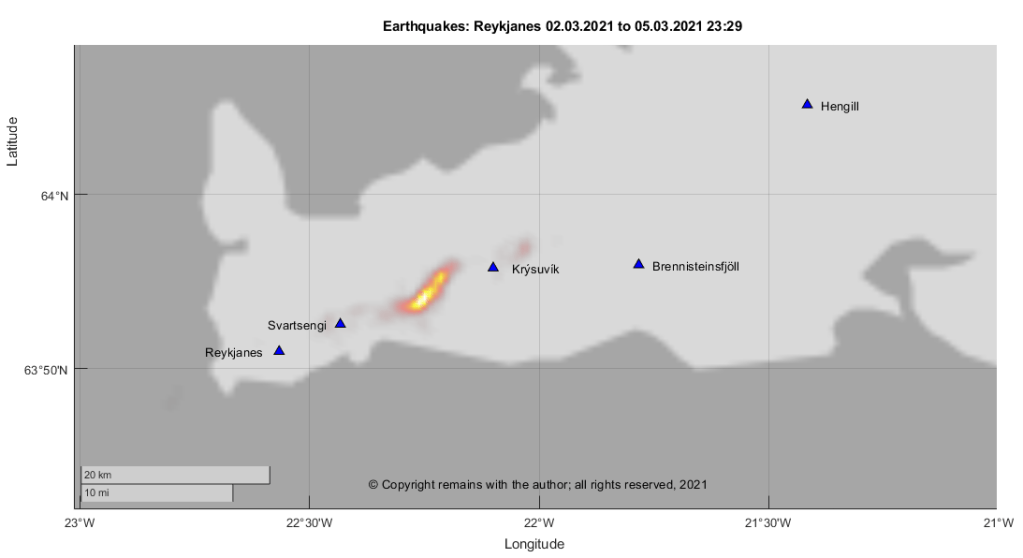
Update 05.03.2021 23:29
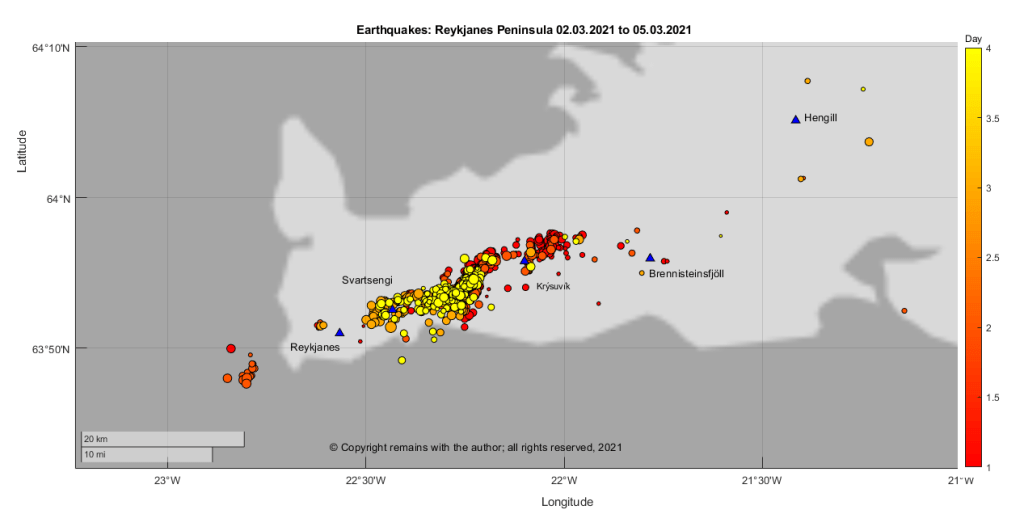
We have plotted the earthquakes with a quality of 99.0 from IMO’s page showing the earthquakes for the last 48 hours for the Reykjanes Peninsula for the period 2 March 2021 to 5 March 2021 (23:29) (we were too slow to capture 1 March 2021). Here are the results. Colour coding in the scatter plots is by day and size reflects magnitude. The geodensity plot is weighted by magnitude.
While browsing IMO’s website a few days ago, I saw that signs have been detected that Grímsvötn is getting ready for another eruption, IMO ; a team of scientists noted large sulphur dioxide emissions near the south west caldera rim, indicating that magma is close to the surface. At the time of writing, the alert level for Grímsvötn remains at green.
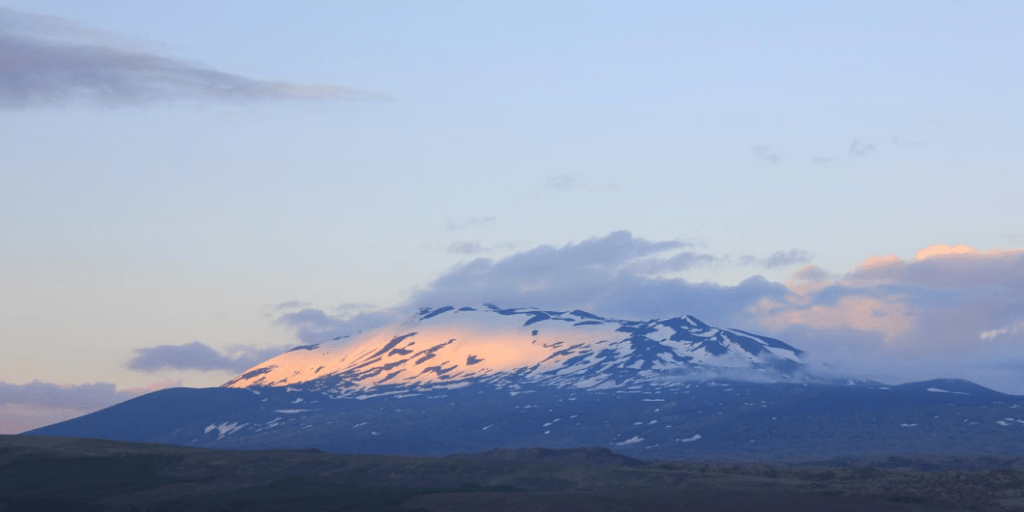
Grímsvötn is Iceland’s most active volcano, erupting every 10 years and last erupting in 2011 with a VEI 4.
Fig 1 Grimsvotn 2011 eruption. Photographer: Sigurjónsson,O. Grímsvötn (GRV): photo 2 of 14. Retrieved from Icelandic Volcanoes: http://icelandicvolcanos.is/?volcano=GRV
Geological Setting
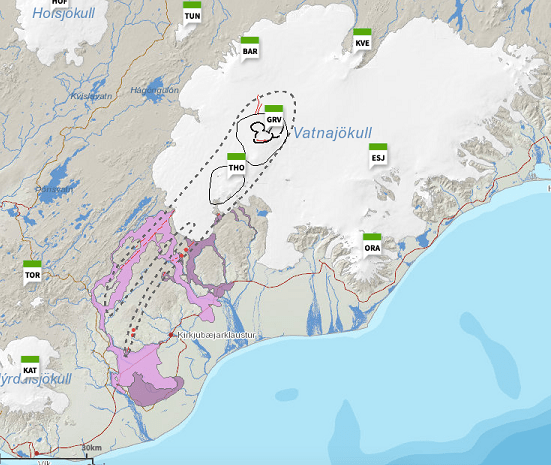
Grímsvötn is one of six active volcanoes under the Vatnajökull ice cap: Bárðarbunga, Kverkfjöll, Grímsvötn, Esufjöll, Þórðarhyrna, Öræfajökull. Apart from Þórðarhyrna (THO in the map below), the other volcanoes are different volcanic systems.
The Vatnajökull volcanoes are part of the Eastern Volcanic Zone in Iceland. Volcanism here is caused by rifting and extension from the separation of the North American and Eurasian Plates. As noted in an earlier post, the Eastern Volcanic Zone accommodates 40 to 100% of the separation.
Our description of the Grímsvötn volcanic system is largely based on Magnús T. Guðmundsson and Guðrún Larsen’s description in Icelandic Volcanoes (ref. Sources below for the full accreditation).
The Grímsvötn volcanic system
The Grímsvötn volcanic system, itself, is made up of two central volcanos and fissure swarms. It is partly covered by ice.
Fig 2 The Grímsvötn volcanic system showing craters, central volcanoes and fissure swarms. Retrieved from Icelandic Volcanoes (see Sources below for full accreditation).
The Central Volcanoes
The Grímsvötn central volcano is a 1722m high, 15-16km diameter caldera complex covered by the Vatnajökull ice-cap, with ice depths of 100m to 700m; she has an 8km by 10km ice-filled caldera. Grímsfall (GFUM) is the highest point on the caldera rim. There is a subglacial lake in the caldera under a 200 – 300m ice shelf with an associated geothermal area. The lake has been the source of many jökulhlaups.
The Þórðarhyrna central volcano, also subglacial, is a 1650 high with a 15 km diameter, connected to Grímsvötn by a subglacial ridge. The volcano, itself, has a small intrusive complex but does not appear to have a large magma reservoir. There is a geothermal area near Pálsfjall.
Ice cover has restricted study of the volcanoes. However, Grímsvötn has been around for long enough to develop a caldera – possibly more than 100,000 years.
Grímsvötn’s lava types are tholeiitic basalt with basaltic andesite and dacite / rhyolitic outcrops in the Þórðarhyrna central volcano. The presence of a shallow magma reservoir is inferred from the geothermal field in the caldera. The 2011 eruption of Grímsvötn produced 0.8km3 basaltic tephra.
Þórðarhyrna is less active than her neighbour; the last eruption occurred in 1903 with a VEI 4. It is possible that she had a second eruption in 1753, resulting in jökulhlaups. Again, ice cover has limited geological study. There is little seismic activity near Þórðarhyrna.
The Fissure Swarms
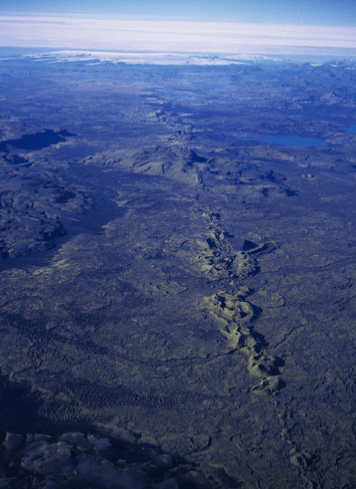
The fissure swarm is about 100 km long and 18 km wide. Rifting is believed to occur along the entire swarm. The northern end of the fissure swarm is covered by the Vatnajökull ice-cap; the southern 80km is ice-free. Subglacial ridges characterise the northern end of the fissure, but not the ice-free southern end where crater rows delineate the fissure, including the Laki.
Three known subglacial eruptions have occurred since 1867 at Gjálp 10km to 15km north of Grímsvötn, itself. The eruptive products include subglacial ridges and some airborne tephra. The 1996 eruption produced basaltic andesite.
Four effusive eruptions have been identified in the ice-free section of the fissure swarm southwest of Grímsvötn in the last 8,000 years; lava volumes have been between 1 km3 to 14 km3 with up to 0.7km3 of tephra. The largest fissure eruption was the Laki eruption in 1783 to 1784. No eruptions have been identified for the ice-covered section of the fissure swarm.
The Laki Fissure Eruption 1783 -1784
This eruption was well documented at the time; the Reverend Jón Steingrímsson’s 1788 account in “A complete description of the Síða Fires” gives a detailed eye-witness account.
The 1783 eruption occurred on 27km long fissure and lasted from 8 June 1783 to 7 February 1784. The early phase consisted of a series of ten or more explosive tephra events, each followed by effusive lava flows. Grímsvötn, itself, erupted in July 1783 to May 1785 causing ash fall and jökulhlaups.
The Laki eruption was pre-empted by earthquakes of increasing intensity from mid-May to 8 June 1783 when a large ash cloud and ash fall appeared, followed by lava columns over 1km high from new fissure to the north. Volcanic gases filtered out sunlight, making the Sun appear red. Accompanying rainfall was acidic, irritating people’s eyes and skin. Lava flows filled river gorges, overflowing to cover surrounding farmland. During the eruption, Mount Laki was destroyed; I am not sure how big she was and how much her destruction contributed to the vast tephra output.
The eruption is rated a VEI4, having produced 0.7km3 of tephra which covered more than 8,000 km2, and 14 km3 of lava. Volcanic gases, including fluorine, killed more than half of the livestock and the “Haze Famine” killed 20% of the Icelandic population. Further afield, 100 million tonnes of sulphur dioxide, having reached the jet stream, spread acidic sulphate aerosols round the Northern Hemisphere, damaged vegetation and crops in Europe and Alaska, caused severe winters and annual cooling of around 1.3°C that lasted for two to three years.
Fig 3: Laki Crater Row: Photographer: Sigurðsson, O. Grímsvötn (GRV): photo 1 of 14. Retrieved from Retrieved from Icelandic Volcanoes: http://icelandicvolcanos.is/?volcano=GRV
According to GVP, the Grímsvötn volcanic system has had 86 Holocene eruptions ranging from VEI 0 to VEI 6. The VEI 6 occurred around 10200 BP and is the thought to be the source of the Saksunarvatn Tephra, a basaltic tephra which covered an area of 2 million km2 around the North Atlantic. The Saksunarvatn Tephra, like the Vedde Ash from Hekla, is a geological time marker, although radiocarbon dating of the Saksunarvatn Tephra shows that it may have come from seven eruptive events over a 500 year period from 10400 BP to 9900 BP
Grímsvötn’s most recent eruptions from 1996 to 2011 range from VEI 3 to VEI 4. They were preceded by a small increase in seismicity and small earthquake swarms, except for the 1996 Gjálp eruption. The 1996 eruption was preceded by a 5.4 earthquake on Barðabunga’s northern caldera rim, swarms over a two day period at Barðarbunga’s north and northwest caldera rims and at Grimsvotn’s southern caldera rim, followed by a swarm from the north Bardarbunga caldera rim that migrated to Gjálp.
Recent Seismicity
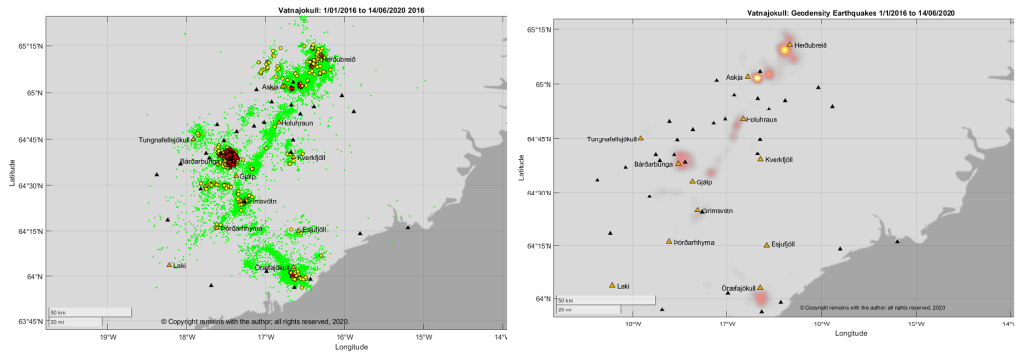
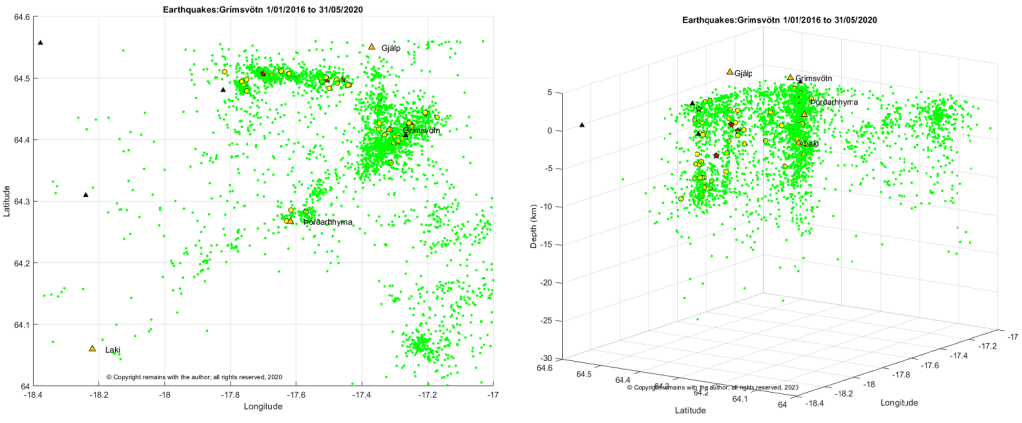
So, what does our earthquake data set tell us about the likelihood of an eruption at Grímsvötn? The answer is a disappointing “not a lot”. We can see that Grímsvötn has a fairly steady stream of earthquakes but no obvious swarms. However, given the proximity of Grímsvötn to other volcanoes, we may have attributed some of Grímsvötn’s activity to another volcano in error. Plots are shown below, including one for Vatnajökull which shows the problem.
The earthquake plots of the Vatnajökull region show the SW-NE trending fissure swarms and also a SE-NW trending line of earthquakes. The head of the mantle plume is considered to be under the Vatnajökull ice-cap; perhaps we are seeing its influence on the plate junction? We can also see the proximity of Grímsvötn to Bárðarbunga.
The Grímsvötn system, with 3,326 earthquakes, is not the most seismically active volcano; activity is overshadowed by seismic activity at Bárðarbunga (5,464 earthquakes), Askja and Herðubreið (a combined 15,645 earthquakes) and Öræfajökull (4,770 earthquakes). The 2014 eruption of Holuhraun was both preceded and accompanied by intense seismic activity at Bárðarbunga, notably near the edges of the caldera, and deflation at Bárðarbunga. Since the eruption, Bárðarbunga has started to re-inflate. Our data set starts a year or more after the end of that eruption.
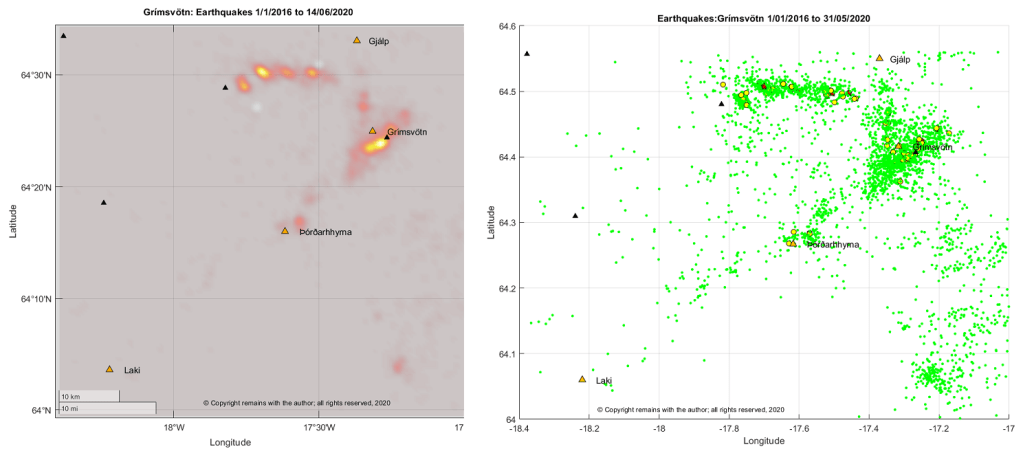
Looking more closely at Grímsvötn we see that earthquake activity is focused on the south east of the caldera and at an E-W trending fissure to the north east of the volcano. The E-W fissure is parallel to similar lines of activity further north at Bárðarbunga’s caldera. We also picked up some activity at Þórðarhyrna.
The earthquakes are telling only part of the story. Grímsvötn has had a steady stream of earthquake activity during the period, but without the SO2 measurements from scientists, we would not be certain that magma, itself, was near the surface.
For updates on Grímsvötn, please visit IMO’s website (details below).
The Armchair Volcanologist
22 June 2020
Sources and Further Reading
“Grímsvötn”, Magnús T. Guðmundsson and Guðrún Larsen (Institute of Earth Sciences – Nordvulk, University of Iceland) In: Oladottir, B., Larsen, G. & Guðmundsson, M.T., Catalogue of Icelandic Volcanoes. IMO, UI and CPD-NCIP. Retrieved from Icelandic Volcanoes: http://icelandicvolcanos.is/?volcano=GRV
“Þórðarhyrna”, Magnús T. Guðmundsson and Guðrún Larsen (Institute of Earth Sciences – Nordvulk, University of Iceland) In: Oladottir, B., Larsen, G. & Guðmundsson, M.T., Catalogue of Icelandic Volcanoes. IMO, UI and CPD-NCIP. Retrieved from Icelandic Volcanoes: http://icelandicvolcanos.is/?volcano=THO
Fig 2: Map: After Guðmundsson and Miller (1997), Guðmundsson et al (2013a), Jóhannesson and Sæmundsson (1998a), Jóhannesson et al (1990). Base data, Iceland Geo Survey, IMO, NLSI | Base map: IMO. In: Oladottir, B., Larsen, G. & Guðmundsson, M.T., Catalogue of Icelandic Volcanoes. IMO, UI and CPD-NCIP. Retrieved from Icelandic Volcanoes: http://icelandicvolcanos.is/?volcano=GRV
Smithsonian Institution Natural History Museum Global Volcanism Program (GVP): https://volcano.si.edu
Having visited Katla, let’s go further north to the Eastern Volcanic Zone and take a look at Hekla.
Hekla is an active snow-covered elongated stratovolcano, lying at the southern end of the Eastern Volcanic Zone in Iceland in a rift transform junction. Following the 1104 AD eruption, Hekla was called “The Gateway to Hell” – a name that stuck until the 19th century.
Fig 1: Hekla 22 June 2014; photo by Evgenia Ilynskya (see below for source).
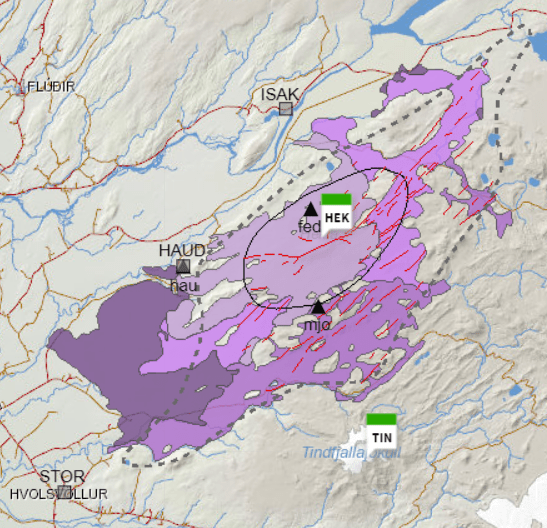
The Hekla volcanic system comprises a 1490m high central volcano and a 60 km fissure swarm. The Heklugjá fissure, 5.5 km long cutting across the central volcano, is the site of many eruptions and gives Hekla its elongated shape. The Vatnafjöll fissure system, 40 km long and 9 km wide is considered part of the Hekla volcanic system. Hekla may have a small magma reservoir 4 km below the surface. She has permanent snow cover but no large glacier.
Fig 2: Hekla’s central volcano, fissure system and some lava flows. Retrieved from Icelandic Volcanoes (see Sources below). GPS and seismic stations are included so we can identify earthquake locations in later plots.
Hekla’s lavas differ from the rift zone volcanoes; her lavas are andesite, basaltic andesite, basalt / picro basalt, rhyolite and dacite. She erupts tephra and silicic to intermediate lavas from the central volcano. Eruptions tend to be a short plinian / subplinian phase followed by lava flows. Larger explosive silicic eruptions have produced enough tephra for the deposits to act as time markers in dating other eruptive activity in Iceland. She is a large fluorine producer which is hazardous to livestock. The hazards listed are tephra fallout, fluorine gas, pyroclastic flows and lava flows; the absence of a large glacier means that jökulhlaups are not a major hazard for Hekla.
The fissure system produces basaltic lavas and a small amount of tephra; its hazards are listed as lava flows and volcanic gas pollution.
Eruptive History
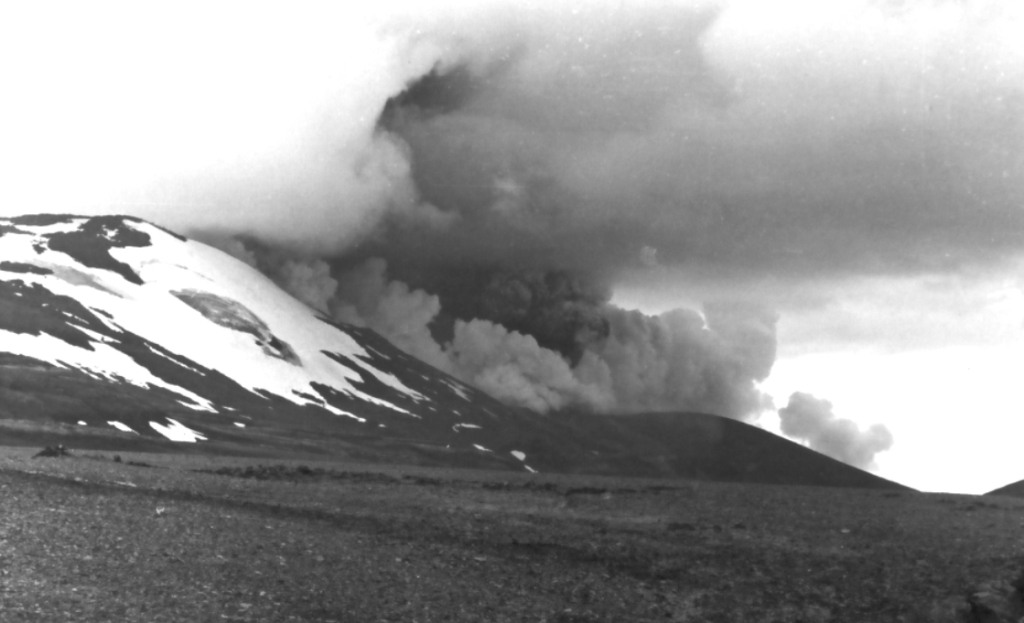
Fig 3: 1980 Eruption of Hekla by oxonhutch at English Wikipedia: Hekla,shared under CC-BY-2.5
According to GVP, Hekla has had 65 Holocene eruptions ranging from VEI 1 to 5. Larsen and Thordarson state that there have been 100 eruptions in the past 9000 years, 23 of which occurred in the last millennium with VEIs ranging from 0 to 5. The central volcano produces eruptions of VEI 2 to 6, VEI 3 to 4 being the most frequent; the longer the repose time between eruptions, the larger the ensuing eruption. The fissure system produces less explosive eruptions (VEI 1 to 2). Hekla’s largest known eruption, a VEI 6, occurred between 3000 to 4300 years ago. Traces of ash from Hekla have been found in Scandinavia, Germany, Ireland and the UK.
Hekla’s eruptive style has changed over time: from effusive basalt 9000 to 7000 years ago; to large explosive silicic eruptions between 7000 to 3000 years ago; and, then smaller more frequent mixed silicic and basaltic eruptions from 3000 years ago to the present day.
The most recent eruption was in 2000, with a VEI 2 to 3, 0.01km3 of airborne tephra 0.01km3 and 0.12km3 of lava; it thought that magma rose through a conduit from a depth of more than 10km to 1km below before heading towards a fissure on the Hekla ridge.
Hekla has an unusually low level of seismic activity. Her largest earthquakes are in the order of 2M when dormant and 3M during an eruption. She does not give much warning of an eruption: known precursors are earthquakes 25 to 90 minutes beforehand. Monitoring has increased since the last eruption so there should be more information about any precursors to future eruptions.
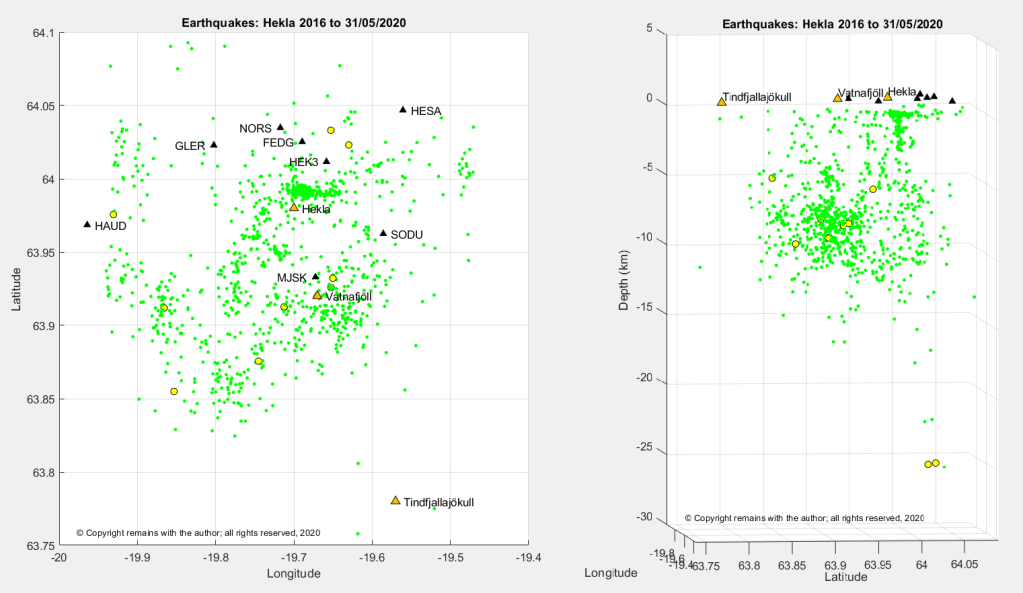
Recent Seismic Activity
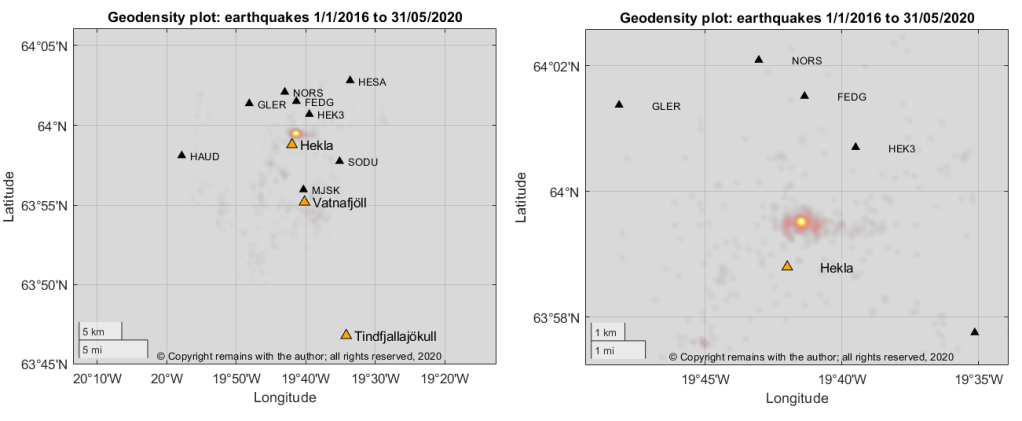
From the data set of earthquakes downloaded from IMO’s site for period 1 January 2016 to 31 May 2020, we extracted those for the Hekla – Vatnafjöll area: 63.7578°N, 19.4687°W to 64.0952°N, 19.9399°W. We found 1,018 earthquakes, compared to Katla’s 6,505 for the same period. The largest quake was 2.62 and the deepest 25.11km.
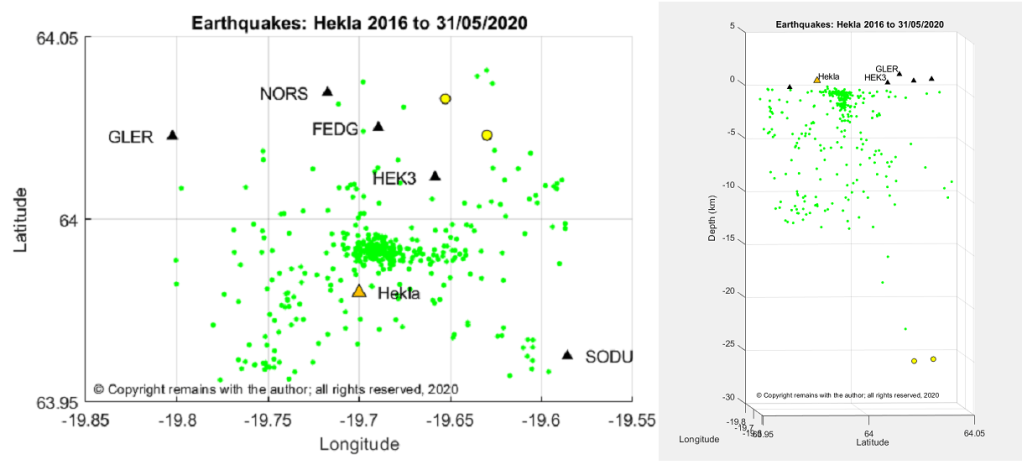
In our latitude v longitude scatter plot we can see that most earthquake activity is scattered along the fissure systems, with an E-W “cluster” to the south of GPS station HEK3, north of Hekla. The latitude v depth plot shows the activity near Vatnafjöll is occurring in the lithosphere, whereas there appears to be a conduit under Hekla. A close up of the cluster confirms this impression.
We looked for swarms in the data set to see if these account for the hot spot but did not find any large ones; the hot spot appears to be an accumulation of activity over the period. Hekla seems to have a slow magma feed.
“Hekla”, Guðrún Larsen (Institute of Earth Sciences – Nordvulk, University of Iceland) and Thor Thordarson (Faculty of Earth Sciences, University of Iceland). In: Oladottir, B., Larsen, G. & Guðmundsson, M.T., Catalogue of Icelandic Volcanoes. IMO, UI and CPD-NCIP. Retrieved from Icelandic Volcanoes: http://icelandicvolcanos.is/?volcano=HEK
Fig 2: Map: After Jóhannesson and Einarsson (1992), Jóhannesson and Saemundsson (1998a), Larsen et al (2013a), Base data, Iceland Geo Survey, IMO, NLSI | Base map: IMO. In: Oladottir, B., Larsen, G. & Guðmundsson, M.T., Catalogue of Icelandic Volcanoes. IMO, UI and CPD-NCIP. Retrieved from Icelandic Volcanoes: http://icelandicvolcanos.is/?volcano=HEK
Smithsonian Institution Natural History Museum Global Volcanism Program (GVP): https://volcano.si.edu
There has been a large earthquake swarm on the Reykjanes Peninsula over recent months, still ongoing at the time of writing, albeit with reduced intensity.
The Reykjanes Peninsula lies at the south west tip of Iceland on the Mid Atlantic Ridge, the boundary between the North American and Eurasian Plates. The North American Plate is moving westwards in relation to the Eurasian Plate; transform and extension faulting accommodate the relative Plate motions. The Reykjanes Volcanic Belt lies on the Reykjanes Peninsula, comprising five north east trending volcanic systems: Reykjanes, Svartsengi, Krýsuvík, Brennisteinsfjöll and Hengill. The volcanic systems are fissure swarms.
Earthquakes
The line of earthquake epicentres in Fig 1 shows the path of the Mid Atlantic Ridge. These earthquakes were extracted from the data set used to generate the plots in the earlier post introducing Iceland. The raw earthquake data is publicly available data downloaded from the Icelandic Meteorological Office for the period January 2016 to 12 April 2020. The plot above is still data-heavy (too much data to see what is happening) so I have extracted the earthquakes by month to see where and when most activity occurred.
In the plots there is an impression of seismic activity trending along the Peninsula from the east to the west. This impression is born out most strongly in the activity from month 48 onwards. Although it should be noted that the level of activity for these months is unusually high.
There are several possible reasons for the east to west trending of the earthquake swarms:
the plates do not move smoothly past each other, so friction generates faults and earthquakes;
rifting is occurring to accommodate the upward motion of land further to the east, generated by the mantle plume in the vicinity of Vatnajökull; and /or,
magma intrusion in local volcanoes.
Let’s take a look at depth plots of earthquakes under the Reykjanes / Svartsengi area. This shows that the earthquakes over 3 M are largely in the lithosphere.
Plotting depth against longitude, effectively looking northwards through the swarms, also shows that most larger quakes are in the lithosphere but some over 2 M track towards the surface. On its own, this is not enough to draw any conclusions over the likelihood of an eruption; field observations, including gas emissions and ground deformation are required to determine how close to the surface magma may be.
These swarms were accompanied by local uplift, as shown by local GPS stations.
Fig 9: Uplift in the vicinity of Mt Thorbjörn as shown in recent GPS plots published by IMO: https://en.vedur.is/. THOB moved south eastwards and ELDC moved westward; both showed uplift.
IMO(3) has reported that the most likely explanation for the recent swarms and uplift is a magma intrusion near Mt Thorbjörn at depth; Mt Thorbjorn is located near the Blue Lagoon, Svartsengi. As to whether or not magma will reach the surface for an eruption and where it emerges, we will have to wait and see. In the meantime, let’s look at the recent activity in historical times.
Historic Volcanic Activity
As noted earlier, the volcanic systems are fissure swarms. Activity is driven by rifting which enables magma to reach the surface. The most recent onshore volcanic activity took place between 940 AD and 1340 AD; later activity has been offshore. Onshore lavas from these eruptions tend to be tholeiitic basalts (1). The systems are still active as demonstrated by current geothermal activity.
Hengill
Fig 10: Image cropped from one by Hansueli Krapf, published under cc licence: CC BY-SA 3.0
The Hengill volcanic system is a series of fissure vents, crater rows and small shield volcanoes, with a highest point of 803m. It lies at the triple junction of the Reykjanes Peninsula volcanic zone, the Western volcanic zone and the South Iceland seismic zone. The lava types are basalt / picro-basalt, andesite / basaltic andesite and rhyolite. Hengill’s lavas are more complex that those to the west, reflecting its position at the triple junction. GVP(2) lists 13 Holocene eruptions ranging between VEI 0 and VEI 2; the last known eruption was a VEI 2 in 150 AD.
Brennisteinsfjöll
The Brennisteinsfjöll volcanic system is a series of crater rows and small shield volcanoes, with a highest point of 610m. Its lava types are basalt / picro-basalt. GVP(2) lists 9 Holocene eruptions ranging between VEI 0 and VEI 2. One eruption, previously attributed to Hengill, occurred during a meeting of the Icelandic parliament at Thingvellier in 1000 AD. The most recent eruption was a VEI 2 in 1341.
Krýsuvík
Fig 11: Image cropped from one by Reykholt, published under creative commons licence: CC BY-SA 3.0
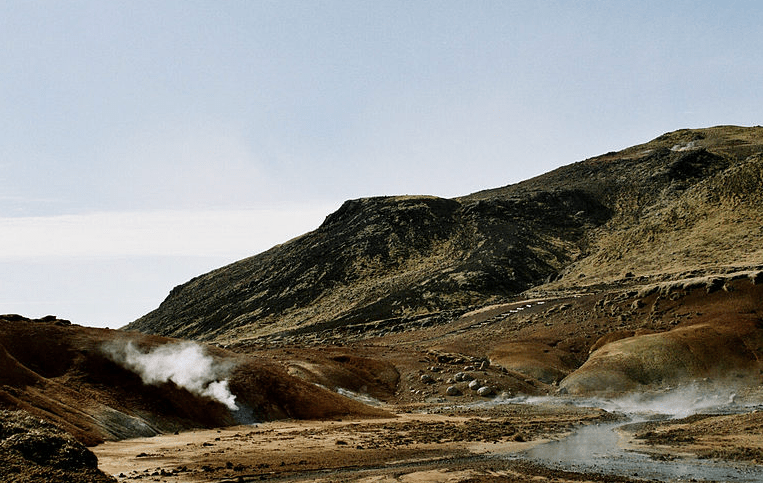
The Krýsuvík volcanic system is a series of crater rows and small shield volcanoes, with a highest point of 360m. Like Brennisteinsfjöll, its lava types are basalt / picro-basalt. GVP(2) lists 11 Holocene eruptions ranging from VEI 0 to VEI 2; the most recent of which was in 1340. The Krýsuvík Fires spanned a period between 1151 and 1188, producing 36 km2 of lava.
Reykjanes & Svartsengi
Fig 12: Image of Svartsengi Power Station from one by Jóhann Heiðar Árnason, published under creative commons licence: CC BY-SA 3.0
The Reykjanes volcanic system is a series of crater rows and small shield volcanoes, which extends offshore and includes several small islands. Reykjanes highest point is 140m. The Reykjaneshryggur volcanic system is a submarine system which is considered part of Reykjanes. GVP includes Svartsengi as a crater row of Reykjanes. Reykjanes lava types are basalt / picro-basalt. GVP(2) lists 22 Holocene eruptions ranging between VEI 0 and VEI 4, of which the most recent was a VEI 0 in 1970; the VEI 4 was in 1226. The 1226 eruption was part of the Reykjanes Fires which started in 1210 and lasted until 1240.
The area is one that has had a period of intense volcanic activity, so the recent earthquake swarms have generated a lot of interest.
Regular updates on seismic and volcanic activity in Iceland are published by the Icelandic Meteorological Office(3).
The Armchair Volcanologist
14 May 2020
References & Further Reading:
David W Peate, Joel A. Baker, Sveinn P. Jakobsson, Tod E. Waight, Adam J. R. Kent, Nathalie V. Grassineau, Anna Cecile Skovgaard , 2009. “Historic Magmatism on the Reykjanes Peninsula”, Contrib Mineral Petrol (2009) 157:359-382
Smithsonian Institution Natural History Museum Global Volcanism Program (GVP): https://volcano.si.edu


