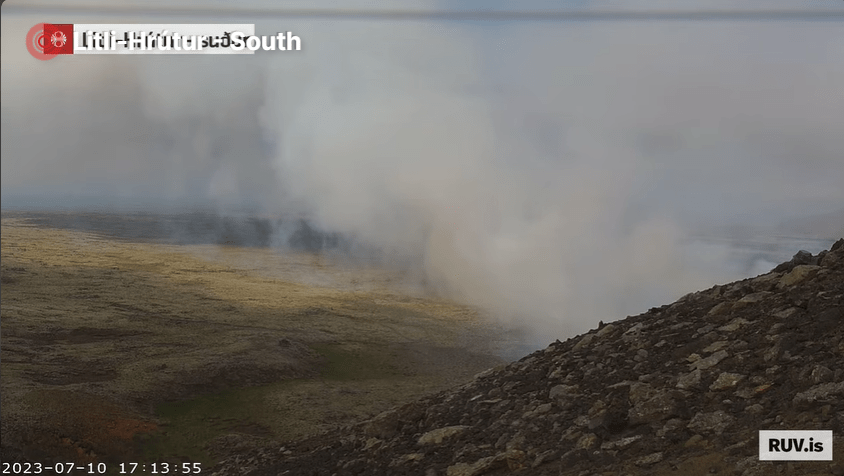
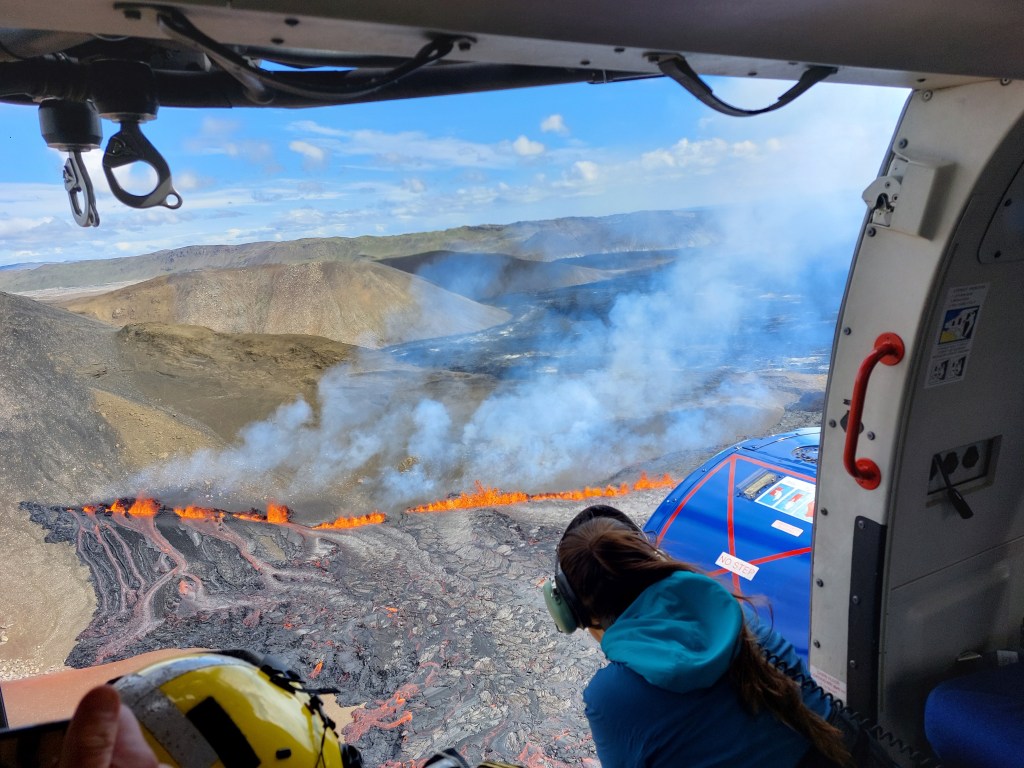
The eruption site is closed to the public right now due to the danger from volcanic gasses and smoke from moss fires; some visitors have been affected. Also, some visitors have been taking insane risks (e.g., attempting to climb the crater wall). High winds yesterday also caused issues.
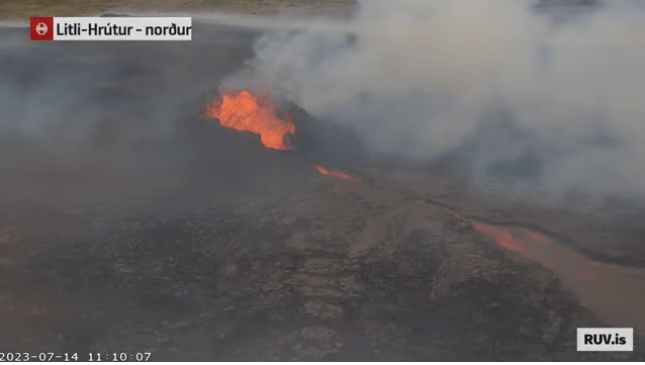
As we know the eruption started on 10th July 2023 at 16:40 with the opening of four fissures with a combined length of c.800m in a north easterly direction from Litli Hrútur towards Keilir. The eruption peaked at c.21:00, diminishing to form a single crater c. 400m northeast of Litli Hrútur.
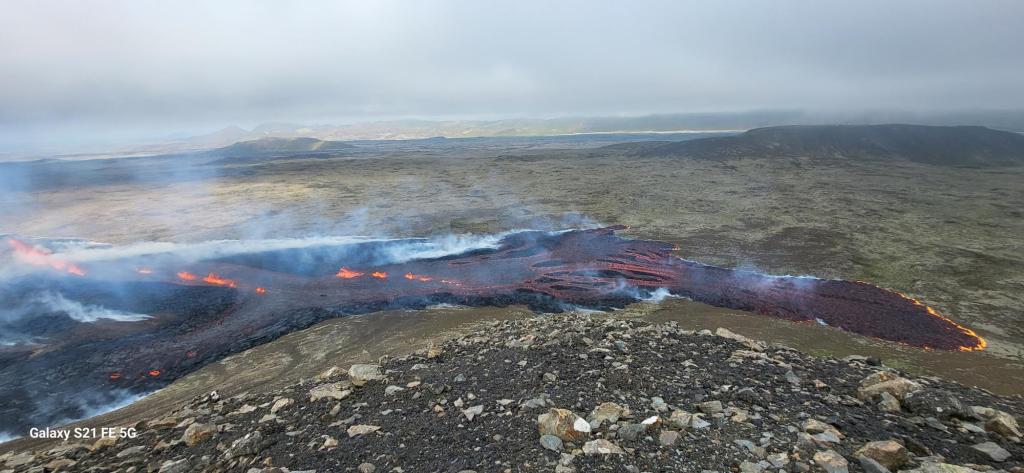
Lava is flowing south with an average flow rate of 13m3/s (similar to the 2021 eruption) for the period 11 July to 13 July. As of 13 July 13:38, the lava volume is c. 3.4 million cubic metres covering an area of 0.4km2. Calculations were performed by NLSI from Pleiades satellite images.
The lava composed of vesicular glass, microphenocrysts and microlites of plagioclase, olivine, clinopyroxene and spinel, similar to the 2022 lava. Lava is estimated to have a temperature of c.1190°C. The chemical composition is similar to that of the 2021 and 2022 eruptions: MgO wt.% = 8.5, and, K2O/Ti2O = 0.26.
The gas composition is similar to that of the 2022 eruption, with a high concentration of CO2. The CO2 may have accumulated prior to the eruption. SO2 gas emissions range from 5.4-11.5 ktonnes / day and CO2 is 7.1 – 15 5 ktonnes / day.
If lava continues to flow southwards, it may reach the 2022 lavas in Meradalir.
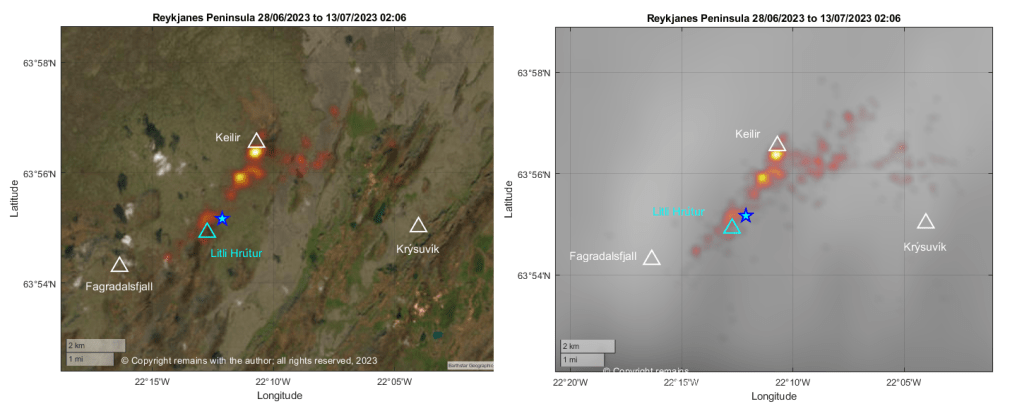
We have updated our earthquake plots to 13th July 2023 02:06, focussing more on the area between Fagradalsfjall, Keilir and Krýsuvík.
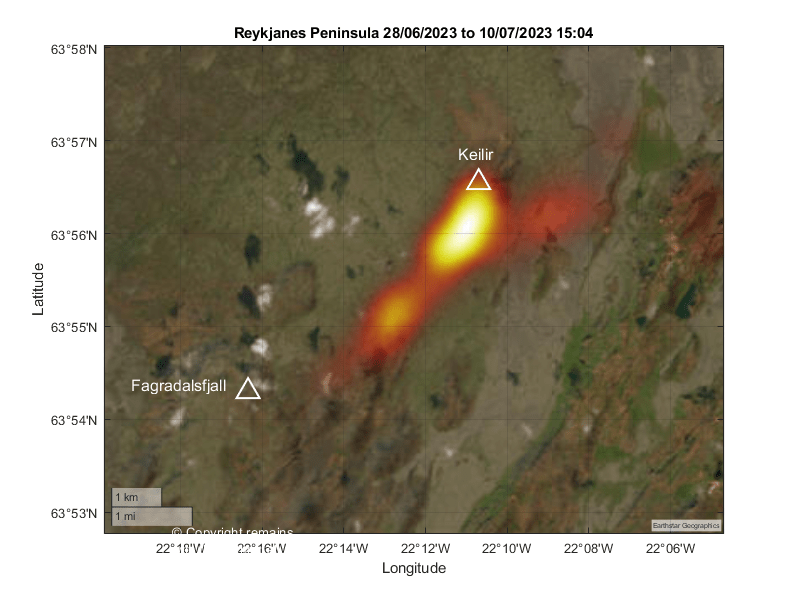
The earthquake density plot is still showing most activity southwest of Keilir and close to the eruption site, which we determined from eyeballing the location of the crater. The area southeast of Keilir is also showing more activity. Whether the activity close to Keilir is triggered quakes, the result of faults moving to accommodate the magma intrusion, or magma-related (or, indeed, both) remains to be seen.
The Icelandic Met Office has confirmed the onset of an eruption on the eastern and northeastern flanks of Litli Hrútur, Iceland. The eruption started around 16:40 today with the opening of three small fissures on a 200m fault. Lava is collecting in a depression then flowing southwards, with gas and steam emissions going northwestwards.
IMO reported noticing a disturbance on the earthquake station at Fagradaslfjall last night and again at 14:00 today similar to those preceding the 2021 and 2022 eruptions.
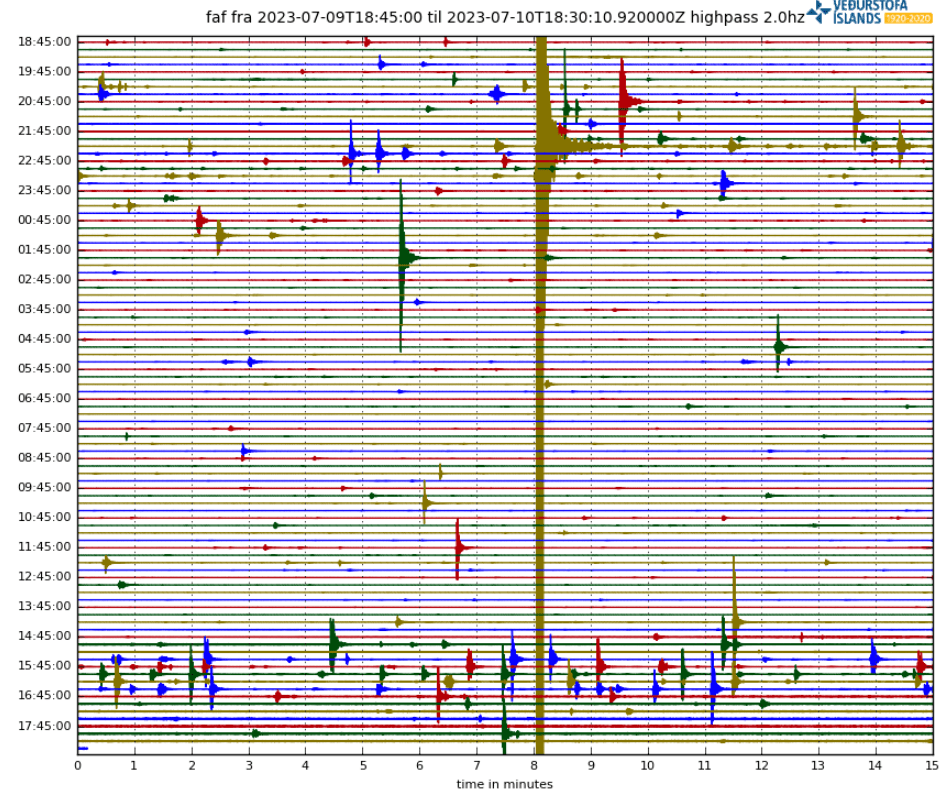
Fig 3: Helicorder plot for Fagradalsfjall today. Source: IMO
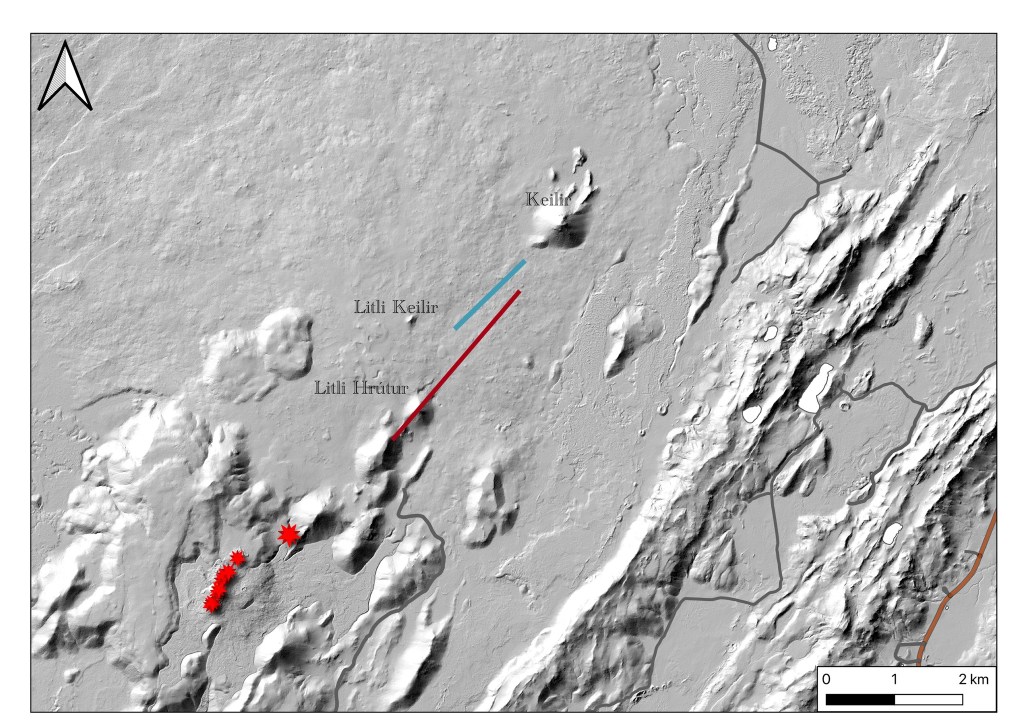
The eruption site appears to be a little east of the southern end of the calculated position of the dyke intrusion.
Fig 4: Calculated position of the dyke instrusion (red line) from IMO. Red stars show the position of earlier eruptions (2021 and 2022). The blue line is the location of surface deformation from ICEYE wave interference images taken 7-8 July. Location of surface fracture and insert model determined by Michelle M. Parks and Vincent Droin, Icelandic Meteorological Office. Photo: Ásta Rut Hjartardóttir, University of Iceland
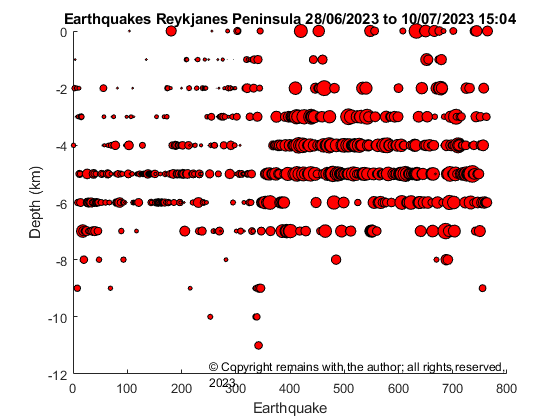
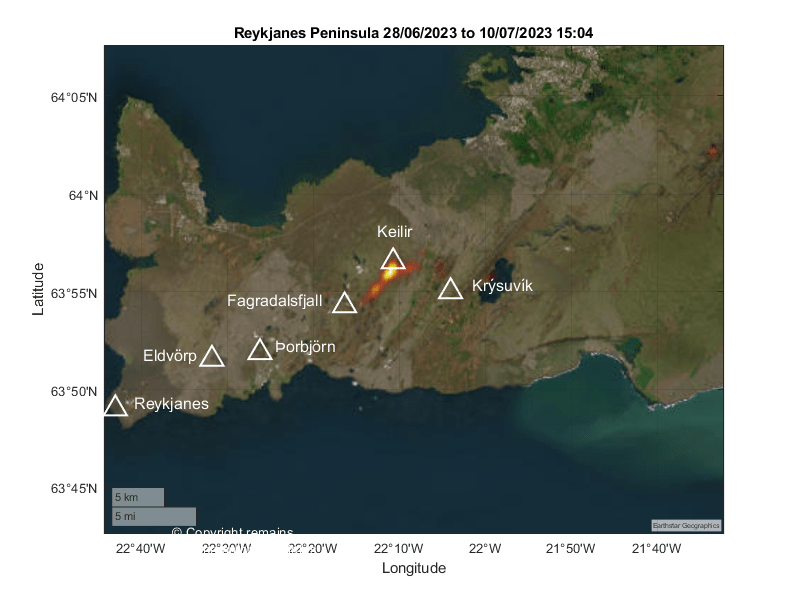
We have updated our earthquake plots from 28th June 2023 to 10th July 2023 15:04 for the Reykjanes Peninsula. We used the 764 confirmed earthquakes published by IMO on https://skjalftalisa.vedur.is/#/page/map. The total number of earthquakes in the swarm was c.12,000 as of 9th July 2023.
The earthquake swarm which started on 4th July 2023 is continuing vigorously as we write, with 7,000 earthquakes detected. InSAR has confirmed that there is a dike intrusion between Fagradalsfjall and Kelir. IMO have said that magma is likely to have reached a depth of around 1 km by 6th July, causing a fracture of a 2.8 km length between Fagradalsfjall and Keilir, centred a little north of Litli-Hrútur. The expectation is that, if an eruption occurs, it will be in hours or days. The eruption may be short but bigger in its initial stages than the 2021 and 2022 eruptions. The alert level remains at orange.
A smaller swarm is also ongoing southwest of the peninsula on the Reykjanes ridge, near the island of Eldey. This may be due to crustal accommodation of the magma intrusion between Fagradalsfjall and Kelir and/or it may be independent activity. The alert level has been raised to yellow. We will look at this in later posts.
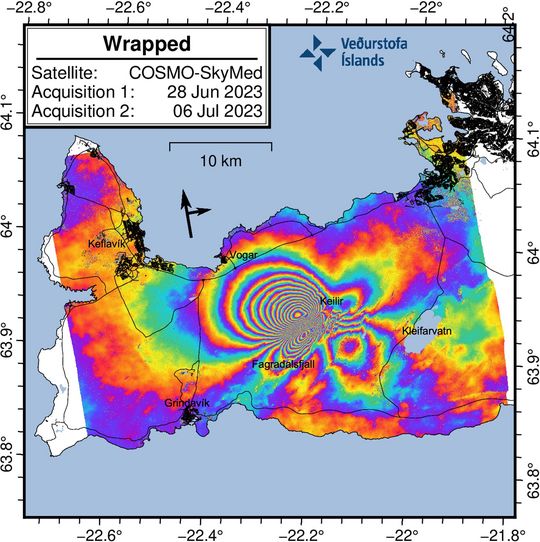
The wrapped image (Fig 2) clearly shows a series of multicolored fringes centered bewtween Fagradalsfjall and Keilir. These fringes show ground deformation caused by the new dike intrusion which commenced on 4 July 2023. The maximum observed deformation related to the dike intrusion is up to 18 cm in the satellite‘s line-of-sight (los) in the NW direction.
Although the deformation signal extends over a large area of the western Reykjanes Peninsula, this does not mean there is magma beneath this entire region. The magma intrusion is situated bewteen Fagradalsfjall and Keilir. There is no indication of additional magma movements outside this area.
Several small lineaments are also visible in the interferogram which cut across the fringes. These represent fault movements/earthquakes that were triggered during the dike propagation.”
We have updated our earthquake plots to this morning, 7th July 2023 09:37 using the published earthquakes from https://skjalftalisa.vedur.is .
Local volcanologist have said that the likelihood of an eruption in a matter of hours or days has increased. The aviation alert level has been increased to orange.
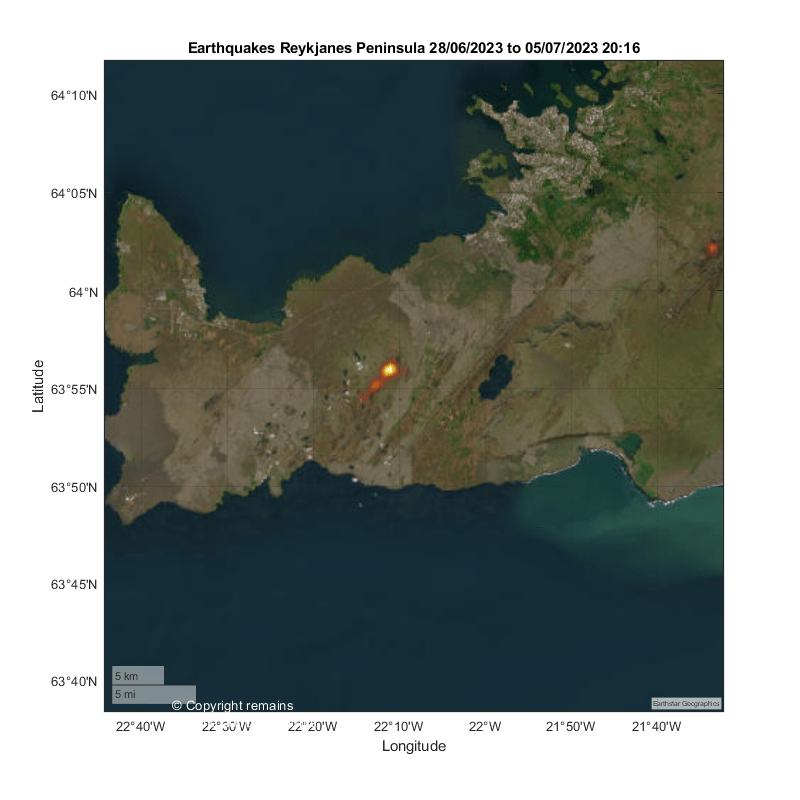
So we have plotted the published earthquakes from https://skjalftalisa.vedur.is from 28th June 2023 to 5th July 2023 20:16 to see what is going on.
It certainly looks like a magma intrusion close to the sites of the recent Fagradalsfjall eruptions. Time will tell whether or not and where lava emerges with the current swarm.
Our thanks go again to the Icelandic Met Office, IMO, https://www.vedur.is/, for the raw earthquake data. For updates, please visit IMO.
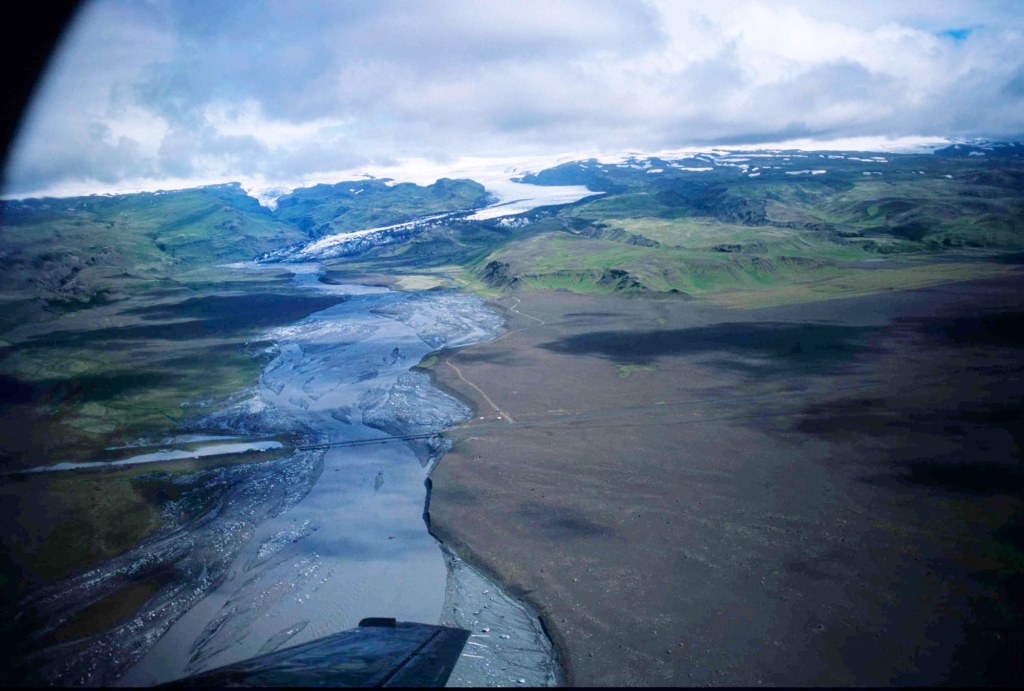
Fig 1: Katla: photo 3 of 6. Retrieved from http://icelandicvolcanoes.is/?volcano=KAT. Jökulhlaup from underneath Mýrdalsjökull glacier in 1999. It remains controversial whether it was caused by a subglacial eruption. Photographer: Oddur Sigurðsson. Date: 18 July 1999
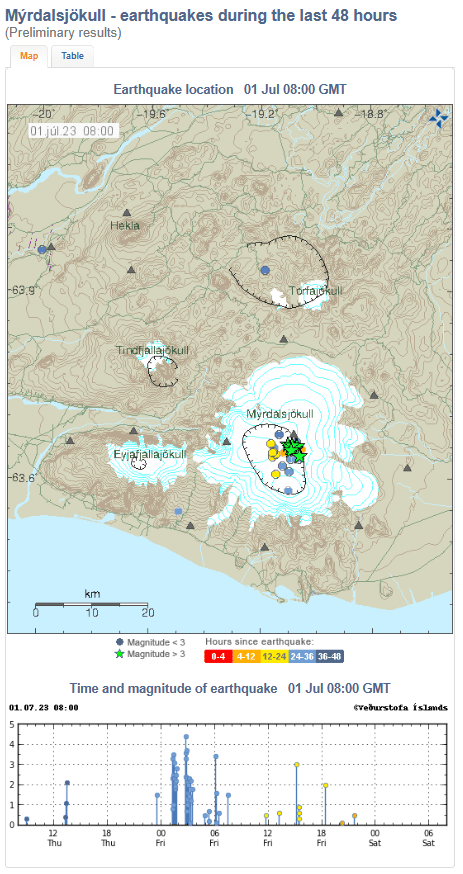
In recent weeks Katla has been showing a heightened level of unrest. Just last month there was an earthquake swarm which led to the temporary raising of the aviation alert level to yellow. Yesterday, the Iceland Met Office reported a risk of ongoing earthquakes at Mýrdalsjökull, gas pollution near Kötlujökull and higher than usual water levels at Múlakvisl; this may be indicative of geothermal activity or magma movement. The alert level is green at the time of writing.
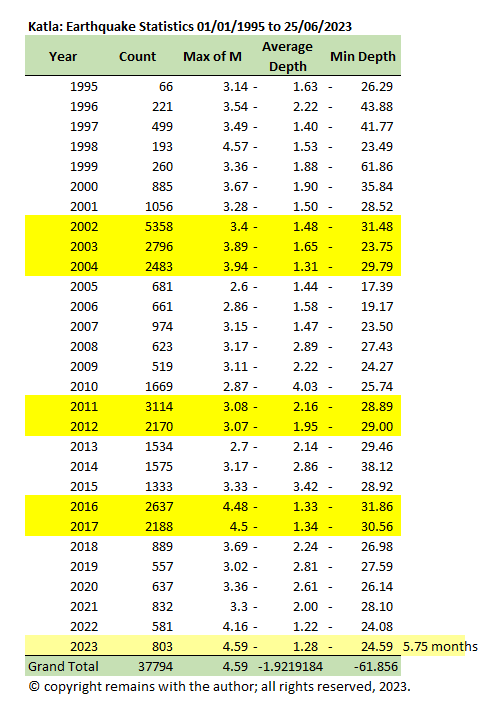
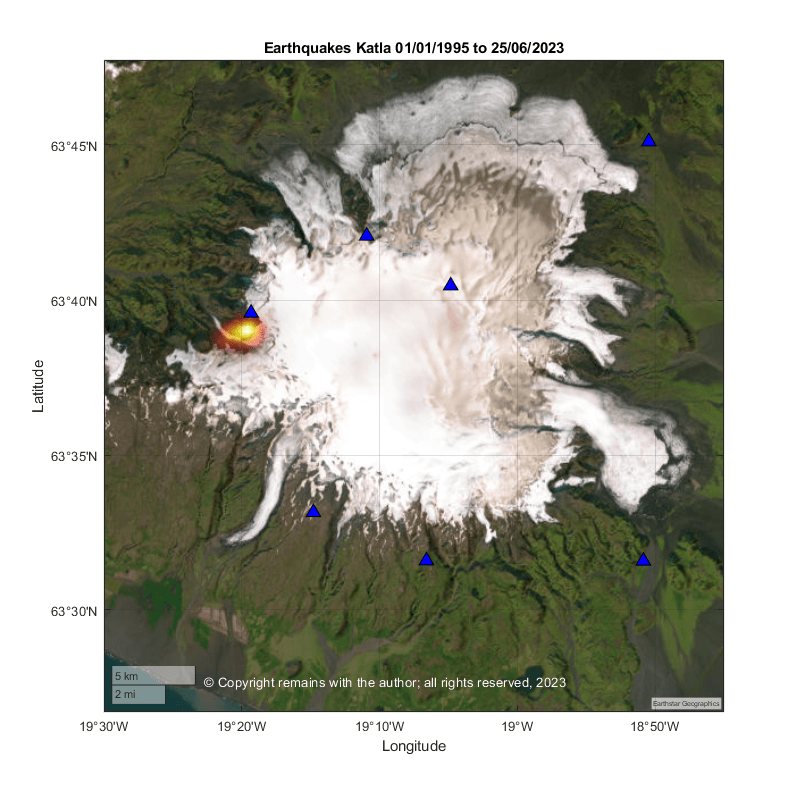
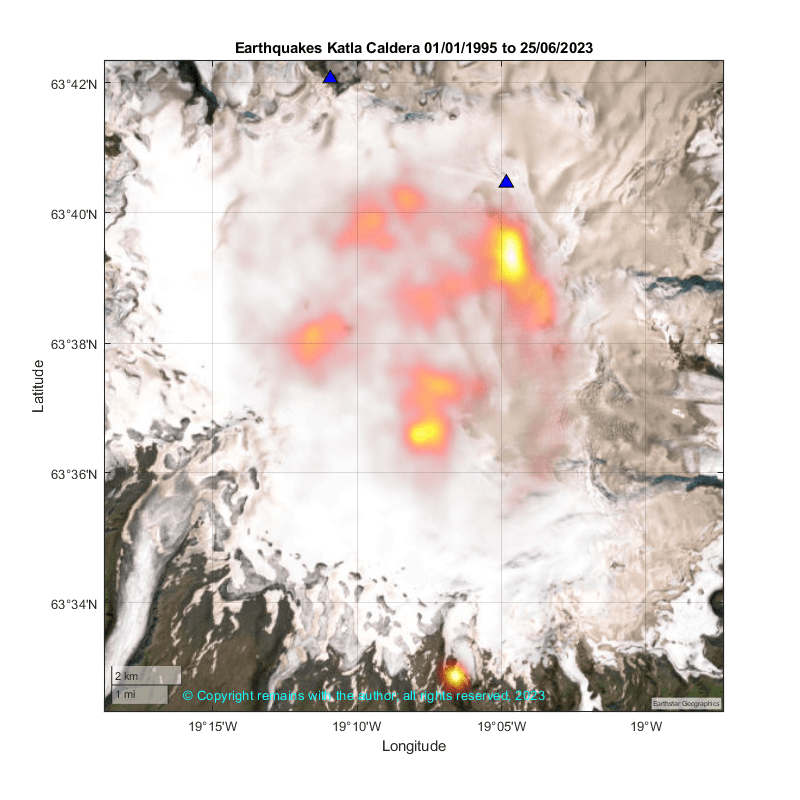
So we took a moment to update our Iceland earthquake database to 25th June 2023 (the earthquake list for week ending 2nd July 2023 is not yet available, although they can be viewed on Skjálfta-Lísa (vedur.is)) and plot the earthquakes at Myrdalsjökull, 63.1°N,18.5°W to 64.2°N,20.00°W, and then the caldera area, 63.45°N,18.98°W to 63.72°N, 19.24°W from 1st January 1995 to 25th June 2023.
This plot shows most seismic activity in the NE of the caldera, near the site of the source of the 1955 jökulhlaup, some in the S of the caldera near the source of the 1918 eruption and 2011 jökulhlaup and another swarm on the volcano’s flank, south of the caldera. The swarm to the south of the caldera occurred in 2011 at the Gvendarfell Ridge. Later study of the Gvendarfell Ridge found sources of recent flank eruptions, including rhyolitic domes and Surtseyan craters.
We have also plotted monthly geoscatter plots for Myrdalsjökull from January 1995 to June 2023 (25 June 2023) and created a 3D rotating scatter plot for the same time period and area.
Giulisa Sgattoni, Federico Lucchi, Páll Einarsson, Ólafur Gudmundsson, Gianfilippo De Astis, and Claudio Antonio Tranne, “The 2011 unrest at Katla volcano: seismicity and geological context”, JÖKULL. No 69, 2019. https://jokull.jorfi.is/wp-content/uploads/2021/12/J69-53-70
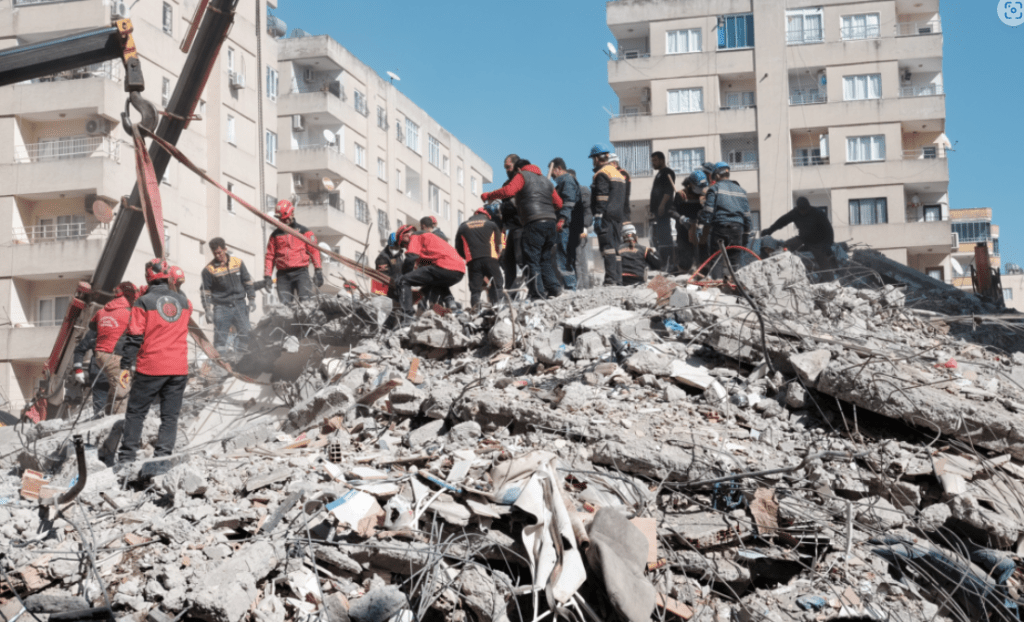
Fig 1: Rescue workers in in Osmaniye, Turkey. Cropped from image by Onur Erdoğan, Public Domain, Wiki Commons
It’s approximately one month on from 6th February 2023 when a 7.8 magnitude earthquake struck on the south western end of the East Anatolian Fault Zone at 01:18 UTC (04:18 local time) 32.4km west northwest of the town of Gaziantep. This, followed by large aftershocks, including a very shallow 7.5 magnitude earthquake to the north of the first quake, caused catastrophic damage in central and southern Turkey, and northern and western Syria. The 7.5 earthquake signalled the rupturing of a second fault zone, the Sürgü-Misis Fault. The final fatality number is not yet available but, at the time of writing, fatalities exceeded 50,000, with hundreds of thousands injured and millions displaced. Our thoughts are with the victims, including those facing a long road to recovery.
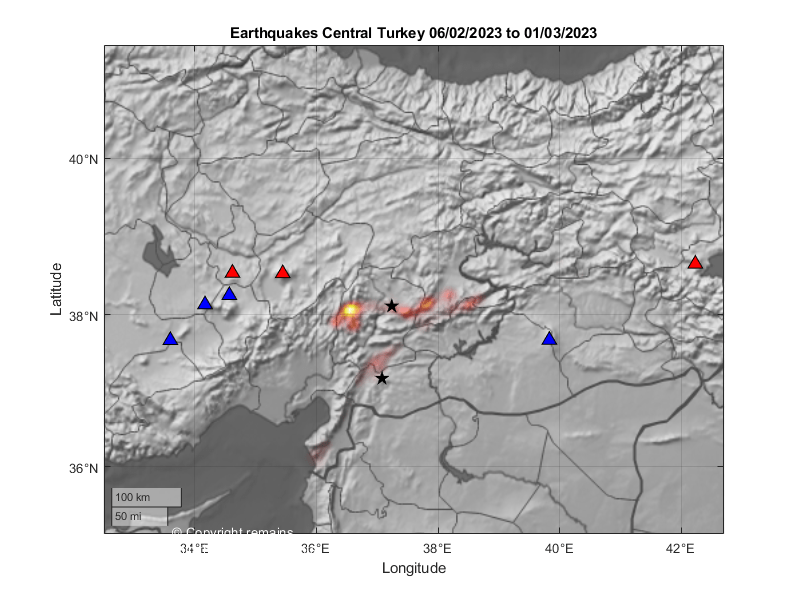
We have taken a look at the earthquakes surrounding the Anatolian Plate from the start of January 2023 to 1st March 2023.
Tectonic Settings
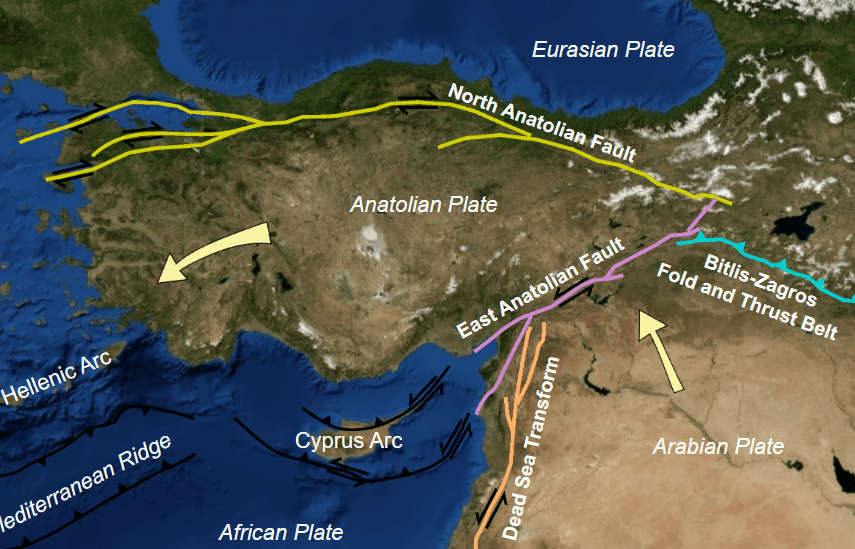
The Anatolian Plate lies between the Eurasian Plate, Arabian Plate and African Plate. The African Plate is moving at a rate of 2.15cm per year in a north easterly direction, the Eurasian Plate is moving south, relative to the African Plate, at a rate of 7-14mm per year, the Arabian Plate is moving northward at a rate of 15-20mm per year and the Anatolian Plate is moving south west at the rate of 21mm per year. The relative motions are accommodated by the North Anatolian Fault, East Anatolian Fault, Bitlis – Zagros Fold and Thrust Belt and Dead Sea Transform Fault System.
Fig 2: Image by Roxy – Own work, CC BY-SA 3.0, Wiki Commons
The East Anatolian Fault is a 500km long fault zone which marks the plate boundary between the Anatolian and Arabian Plates; the boundary is a transform one with left lateral strike slip seismic activity and a slip rate of 10mm per year. The Anatolian Plate is pushed westward by the Arabian Plate moving northwards towards the Eurasian Plate.
The East Anatolian Fault is a single fault between Karliova and Çelikhan. After Çelikhan the fault zone splits into north and south strand, both of which include multiple faults. The Sürgü-Misis Fault makes up the northern strand; it is a 380km long stretching between Çelikhan and Karataş; the eastern parts of the east-west section are made up of the Çardak and Sürgü faults; the sytem changes direction at the Göksun bend dividing into seven north east trending fault systems – the Karataş, Yumurtalık, Toprakkale, Savrun, Misis, Çokak and Düziçi-İskenderun faults. The Sürgü-Misis Fault system connects to the Cyprus Arc via the Misis-Kyrenia fault system. The southern strand of the East Anatolian Fault is less certain; the East Anatolian Fault may extend to the north of Cyprus; and, the NNE trending Türkoğlu-Amik section (the Karasu Fault Zone) may be a separate fault, linking the Dead Sea Transform to the East Anatolian Fault. The Karasu Rift has had Quaternary volcanic activity on northern part and sides of the rift between Kirikhan, Reyhanli and Fevzipaşa in an area 94km long and 12-25km wide.
The North Anatolian Fault, another strike slip fault, accommodates the relative motion between the Anatolian Plate and the Eurasian Plate. The North Anatolian Fault and the East Anatolian Fault meet the Bitlis – Zagros Fold and Thrust Belt, where the Arabian Plate subducts under the Eurasian Plate, at the Karliova Triple Junction.
Not very far to the west, the African Plate is subducting under the Anatolian Plate at the Cyrpus Arc. The Dead Sea Transform Fault System to the south marks the transform boundary between the Arabian and African Plates. The East Anatolian Fault meets the Dead Sea Transform Fault System at the Maras Triple Junction.
Earthquake Plots
We initially plotted the earthquakes from 1 January 2023 to 25 February 2023 for the area 34.47361°N, 25.22222°E to 42.25833°N, 44.45056°E. We then looked at 35.3122°N, 32.50944°E to 41.21667°N, 42.70056°E, focussing on the East Anatolian Fault. The results are shown in the following videos and earthquake density plot.
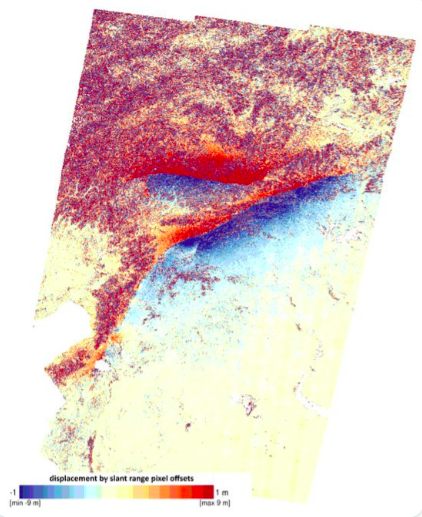
Fig 7: Surface rupture from the two earthquakes as shown by analysing before and after satellite images. The first rupture on the East Anatolian Fault was 190km long and the second on the Sürgü-Misis Fault was 38km long (Image credit: Copernicus/NERC/COMET)
Most of the faults within the East Anatolian Fault Zone seem to have moved in the period we looked at. However, the scale of our plots may be misleading. Our plots do show a tenuous link between the East Anatolian Fault and the Cyprus Arc. There was some activity on the Arc preceding the 7.8 earthquake. After shocks have migrated through the fault system towards the Arc. There is no obvious link with the Dead Sea Transform Fault in the time period selected but geologically-speaking that is a very short period.
“Paleoseismology of the western Sürgü–Misis fault system: East Anatolian Fault, Turkey”, Tamer Y. Duman, Hasan Elmacı, Selim Özalp, Akın Kürçer, Meryem Kara, Ersin Özdemir, Ayhan Yavuzoğlu & Çağıl Uygun Güldoğan, Mediterranean Geoscience Reviews volume 2, pages411–437 (2020) https://link.springer.com/article/10.1007/s42990-020-00041-6
Apologies for not posting for a while now. Illness in the family has made more demands on our time than anticipated.
We have missed the eruptions of Mauna Loa and Kilauea, to name but two, and two catastrophic earthquakes: one in West Java in Indonesia and the other in Khost, Afghanistan.
Even when we are not posting, our thoughts remain with all those impacted by volcanic and seismic hazards.
Eruptive activity at the new fissure in Meradalir stalled on 21st August 2022 at around 6:00 am. The seismic tremor ceased following the emission of a blue grey plume. Lava was seen on webcams to be still flowing from the crater just before then. We await to see whether or not this is the end of this eruptive episode.
To quote IMO, “A new chapter is about to begin in the Fagradalsfjall fires, but whether the seismic activity will recur and it will erupt again in the near future or not, time will tell.”
What do we know of the eruption so far? The eruption started on 3rd August 2022. The initial discharge rate was c. 32 cubic metres per second, dwindling to 2 cubic metres per second by 16th August 2022. The total volume of lava emitted by 16th August 2022 was 12 million cubic metres, c. 8% of that emitted by the Geldingadalir eruption last year. At the crater the lava is 20 to 30 metres deep and 40 metres deep by the crater rims, themselves. Over the rest of the lava field the lava is between 5 and 15 metres deep. The new lava has displaced cooling older lava causing it to rise by 3 to 5 metres in places.
The lava composition is similar to the basalt emitted by Geldingadalir in September 2021. The K2O / TiO2 ratio ranges from 9.3 to 9.4 and the MgO is around 8.4 wt(%).
So, it was hours, not days! The eruption started near Fagradalsfjall / Meradalir yesterday at around 13:18 about 1.5 km north of Stóra-Hrut on a north-easterly southwest fissure. The onset was detected by a local webcam and later confirmed by scientists. The alert level is currently orange (Volcanic eruption is underway with no or minor ash emission.)
Like the previous eruption, lava is contained by the local geography so no infrastructure is currently threatened. Gas emissions are, however, a hazard. The lava flow is estimated to be 5 – 10 times that of Geldingadalir at 32 cubic meters per second in the first 24 hours; gas emissions may well be similarly larger.
Visitors are advised not to approach the site at the moment. When the site is open, bear in mind that it is not an easy walk, so for the fit only, and visitors should be properly prepared, including having gas masks and metres.
At the time of updating, we did not have confirmation of the coordinates of the eruption site, so we have guessed based on maps of the fissure. The plots will be updated when more up to date information becomes available.
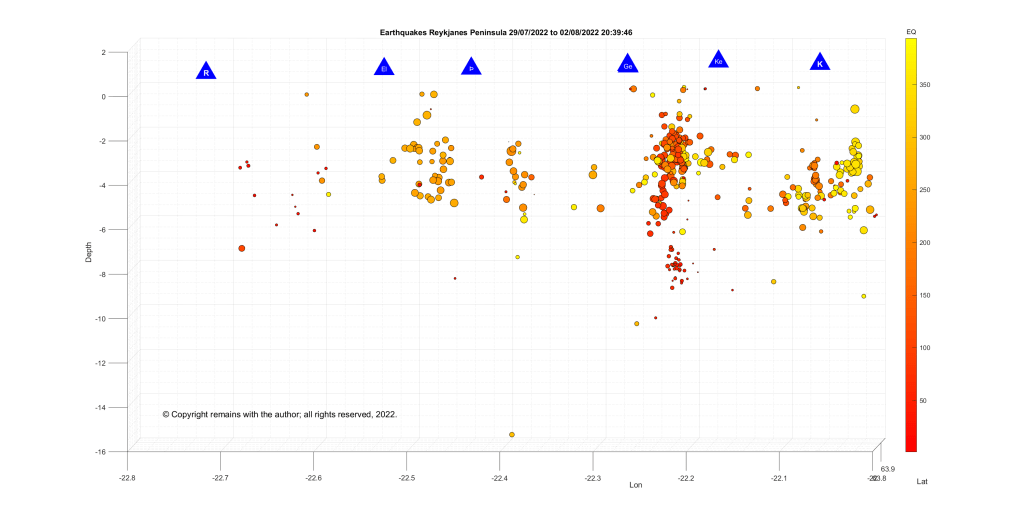
Update 02/08/2022, 20:39:46, Fagradalsfjall and Grímsvötn
The earthquake swarm near Fagradalsfjall continues unabated. The aviation code for Grímsvötn has been raised to yellow following increased seismic activity there.
Fagradalsfjall
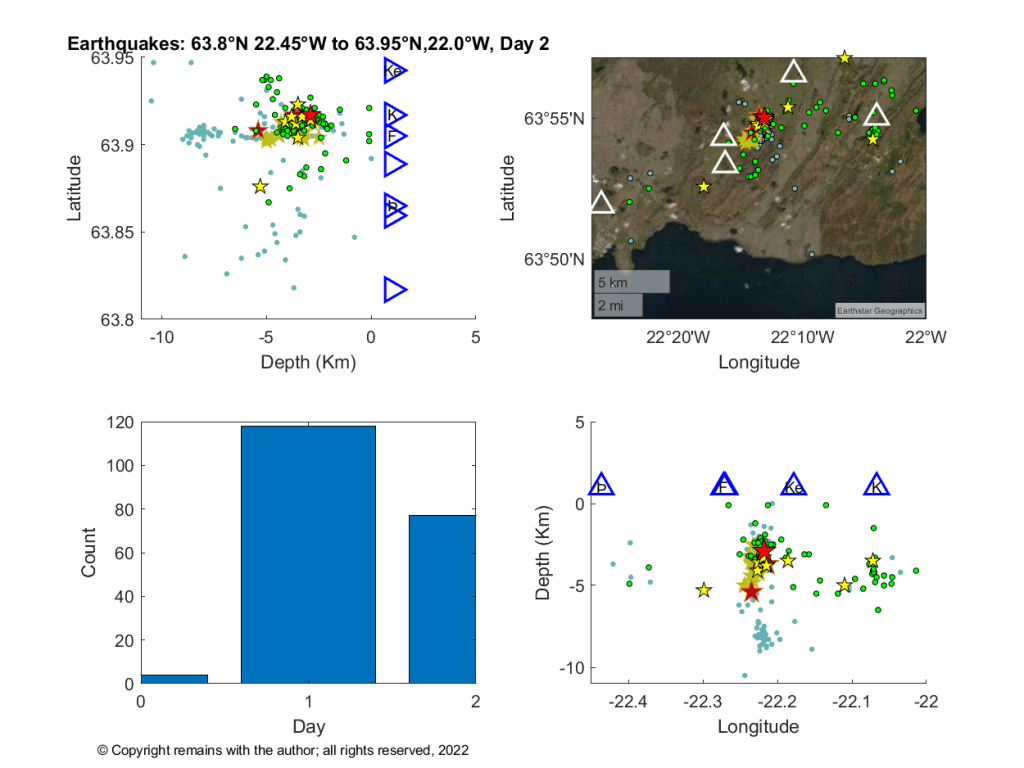
At the time of writing IMO were reporting 3,000 earthquakes in the last 48 hours detected by the SIL Seismic Network.
Rising magma has caused some large triggered earthquakes where existing faults slip to accommodate the strain, the largest so far being 5.47 on day 2 of the swarm.
The Icelandic media are reporting that new satellite images taken on 1 August 2022 show magma movements located between Fagradalsfjall and Keilir. The magma intrusion is shallow at c. 1 km below the surface. The magma influx is close to double the rate of the previous eruption. The chances of an eruption near Fagradalsfjall in the coming days or weeks have therefore increased and are considered to be significant.
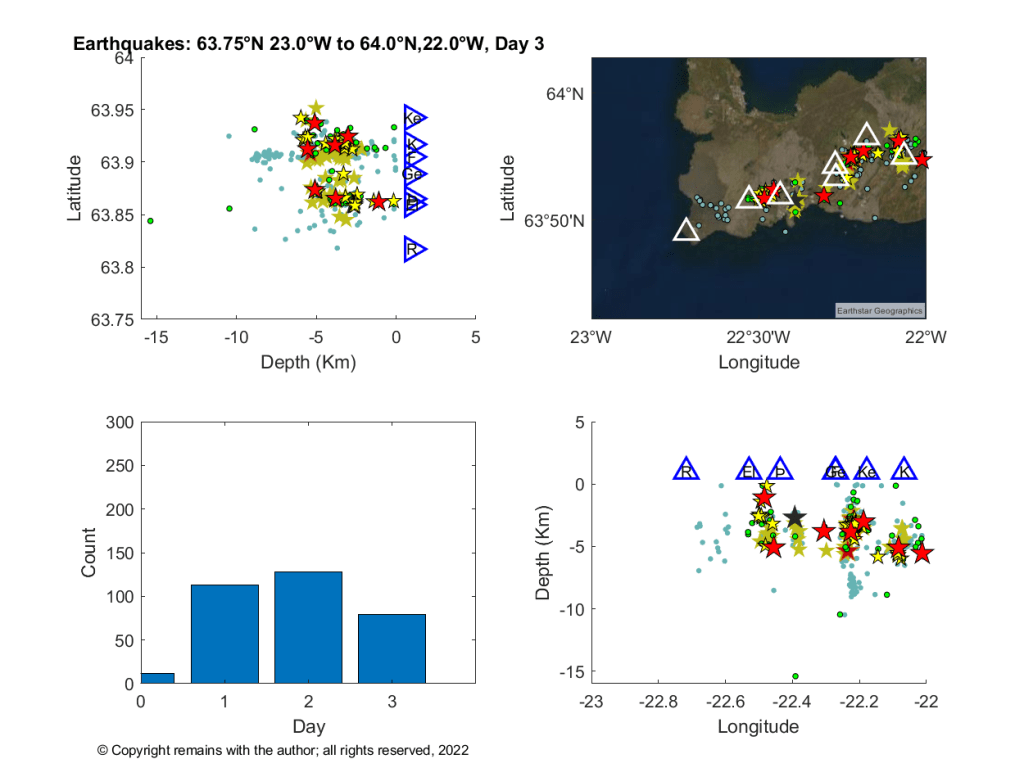
We have updated our earthquake plots using confirmed earthquake data from IMO’s Skjálfta-Lísa for the area 63.75°N, 23.0°W to 64.0°N, 22°W (the western Reykjanes Peninsula). The geodensity plot shows that most of the action is centred north east of Fagradalsfjall.
The image from IMO below shows the earthquake activity at Grímsvötn.
Fig 7: Screenshot of seismic activity at Grímsvötn today. Source: Vatnajökull (vedur.is)
Hopefully, eruptions are not like buses – wait for ages, then several show up together. On a more serious note, if Grímsvötn does erupt, ash may be problematic for Europe depending on the size of the eruption and the prevailing wind direction. A jökulhlaup caused by melting of the ice-cap is another hazard. An eruption near Fagradalsfjall is less likely to produce a lot of ash unless magma encounters an aquifer or other body of water; lava and any gas emissions depending on volume and location are likely hazards. Seismic activity remains a hazard for both; the public are advised of the risk of rockfall and landslip.
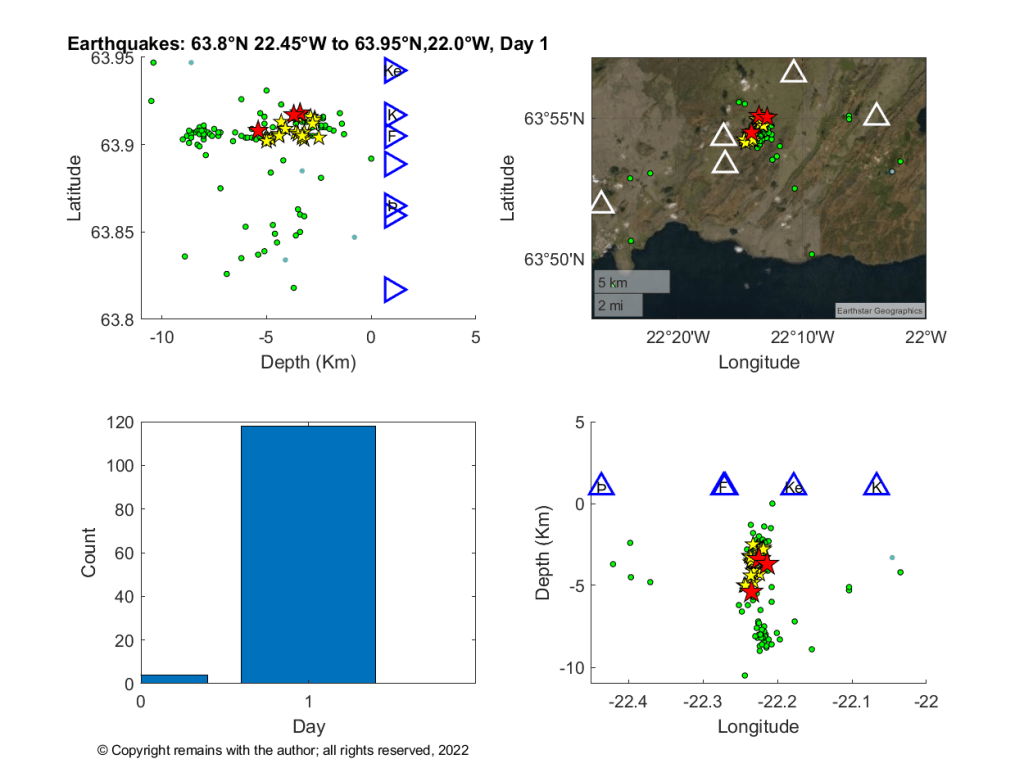
A large earthquake swarm started yesterday (30/07/2022) lunchtime north east of Fagradalsfjall, Iceland. At the time of writing, IMO had reported 1,597 earthquakes in the last 48 hours for the Reykjanes Peninsula from the SIL seismic network. This network automatically detects and locates earthquakes in Iceland and the surrounding offshore region. 199 of these earthquakes had been confirmed.
At the moment the swarm is being likened to the swarm in December 2021, which did not result in an eruption. The local authorities are warning of the increased risk of rockfall as a result of increased seismic activity.


