Tag Archives: Krýsuvík

Updated Earthquake Plots for Svartsengi and Krýsuvík, 24th October 2023 to 9th March 2024

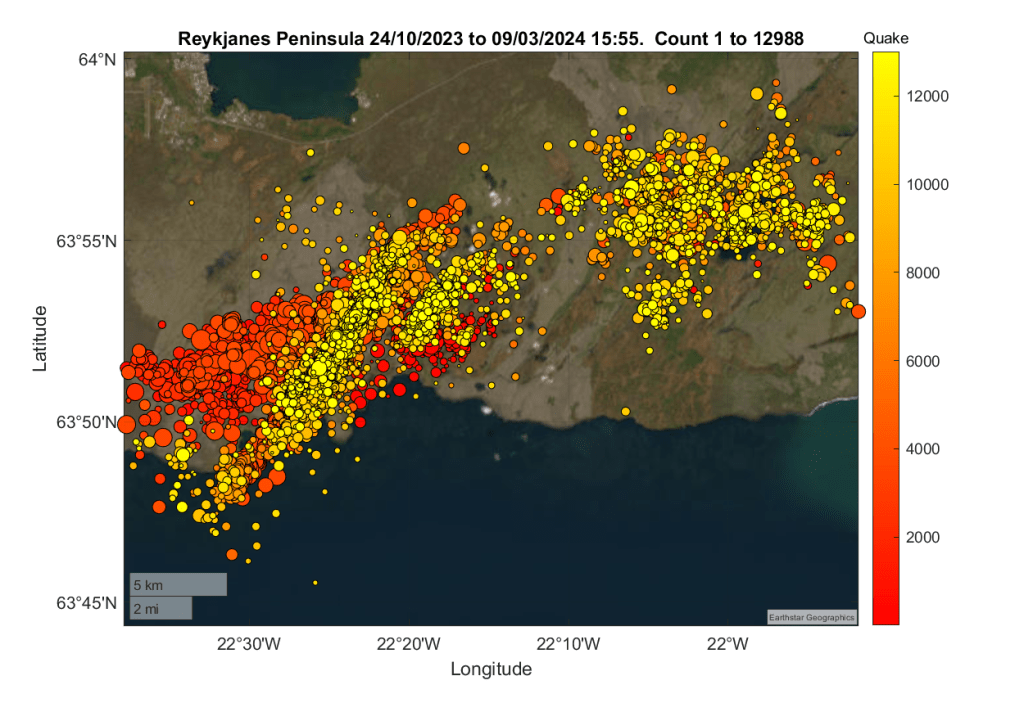
While waiting to see where and when the next eruption on the Reykjanes Peninsula occurs, we have updated our earthquake plots for the area between 63.746°N, 22.631°W and 63.996°N, 21.864°W from 24th October 2023 to 9th March 2024 – a total of 12,988 earthquakes.  We have extended the area plotted to include Krýsuvík.

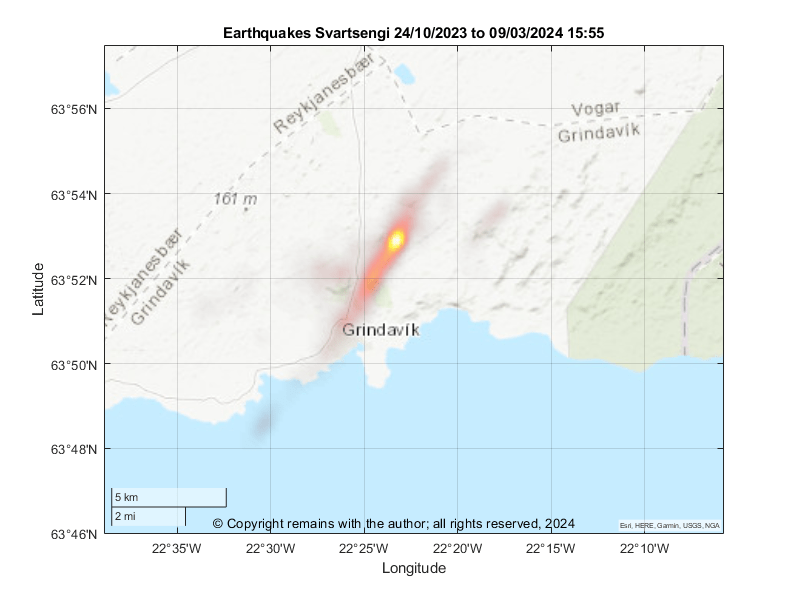
First, we start with the geodensity plot for the period 24th October 2023 to 9th March 2024.  Most activity is still occurring on the magma intrusion / graben between Hagafell and Stóra-Skógafell.  The earthquake density plots for the entire period also picks up some activity southwest of Grindavík, west of Fagradalsfjall and at Mount Þorbjörn.  This shows best on a topographic map with a lighter background.

Fig 1: Earthquake density plot by the author of earthquakes occurring between 63.746°N, 22.631°W and 63.996°N, 21.864°W from 24th October 2023 to 9th March 2024. © copyright remains with the author; all rights reserved, 2024.

Next, we look at the geoscatter plot for the same area and period.  This shows the activity along the magma intrusion / graben, that west of Fagradalsfjall, and, also, an upkick in activity in the Krýsuvík area.  The last may be local faults accommodating the uplift at Svartsengi.  Whether or not this lets magma ascend in the Krýsuvík volcanic system, itself, remains to be seen.  At the time of writing, the alert level for Krýsuvík is unchanged at green. 

Fig 2: Geoscatter plot by the author of earthquakes occurring between 63.746°N, 22.631°W and 63.996°N, 21.864°W from 24th October 2023 to 9th March 2024. © copyright remains with the author; all rights reserved, 2024

We have complied a video of the earthquake sequence in increments of 50 quakes.

Fig 3: Video of geoscatter plots by the author of earthquakes occurring between 63.746°N, 22.631°W and 63.996°N, 21.864°W from 24th October 2023 to 9th March 2024. © copyright remains with the author; all rights reserved, 2024.

We have also looked at the sequence by the various events (inflation, intrusion / graben formation and eruption).  The events are:

Fig 4: Table by the author of events in the earthquake sequence (inflation, intrusion / reactivation of the graben and eruption).  © copyright remains with the author; all rights reserved, 2024.

For each event we have done the geodensity and geoscatter plots.  These can be found in the video below.

Fig 5: Video of geodensity and geoscatter plots for events by the author of earthquakes occurring between 63.746°N, 22.631°W and 63.996°N, 21.864°W from 24th October 2023 to 9th March 2024. © copyright remains with the author; all rights reserved, 2024.

Other plots

Fig: 6 Combined geoscatter and scatter plots by the author of earthquakes occurring between 63.746°N, 22.631°W and 63.996°N, 21.864°W from 24th October 2023 to 9th March 2024. © copyright remains with the author; all rights reserved, 2024
Fig 7: Scatter plots by the author of earthquakes occurring between 63.746°N, 22.631°W and 63.996°N, 21.864°W from 24th October 2023 to 9th March 2024. © copyright remains with the author; all rights reserved, 2024.

We hope you find the above plots useful.

Armchair Volcanologist

© Copyright remains with the author; all rights reserved, 2024.

Source:

Our thanks go to IMO for the raw earthquake data.  IMO:  Icelandic Meteorological Office

Update on the Eruption at Litli Hrútur, 13th July 2023

Fig 1: Screenshot from Bein streymi frá eldgosinu við Litla-Hrút – RÚV.is (ruv.is)  Lava flowing south from the crater today.  Smoke from the moss fires is visible at the edge of the lava field.

The eruption site is closed to the public right now due to the danger from volcanic gasses and smoke from moss fires; some visitors have been affected.  Also, some visitors have been taking insane risks (e.g., attempting to climb the crater wall).  High winds yesterday also caused issues.

The Institute of Earth Sciences, Iceland, have provided an update on the eruption here: Volcanic eruption at Litli-Hrút, measurement results 13 July | Institute of Earth Sciences (hi.is) .  This is summarised below.

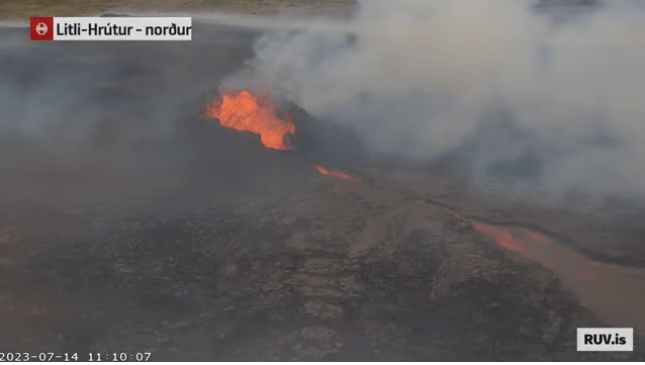
  • As we know the eruption started on 10th July 2023 at 16:40 with the opening of four fissures with a combined length of c.800m in a north easterly direction from Litli Hrútur towards Keilir.   The eruption peaked at c.21:00, diminishing to form a single crater c. 400m northeast of Litli Hrútur.
  • Lava is flowing south with an average flow rate of 13m3/s (similar to the 2021 eruption) for the period 11 July to 13 July.  As of 13 July 13:38, the lava volume is c. 3.4 million cubic metres covering an area of 0.4km2.  Calculations were performed by NLSI from Pleiades satellite images.
  • The lava composed of vesicular glass, microphenocrysts and microlites of plagioclase, olivine, clinopyroxene and spinel, similar to the 2022 lava.  Lava is estimated to have a temperature of c.1190°C.  The chemical composition is similar to that of the 2021 and 2022 eruptions: MgO wt.% = 8.5, and, K2O/Ti2O = 0.26.
  • The gas composition is similar to that of the 2022 eruption, with a high concentration of CO2.  The CO2 may have accumulated prior to the eruption.  SO2 gas emissions range from 5.4-11.5 ktonnes / day and CO2 is 7.1 – 15 5 ktonnes / day.

If lava continues to flow southwards, it may reach the 2022 lavas in Meradalir.

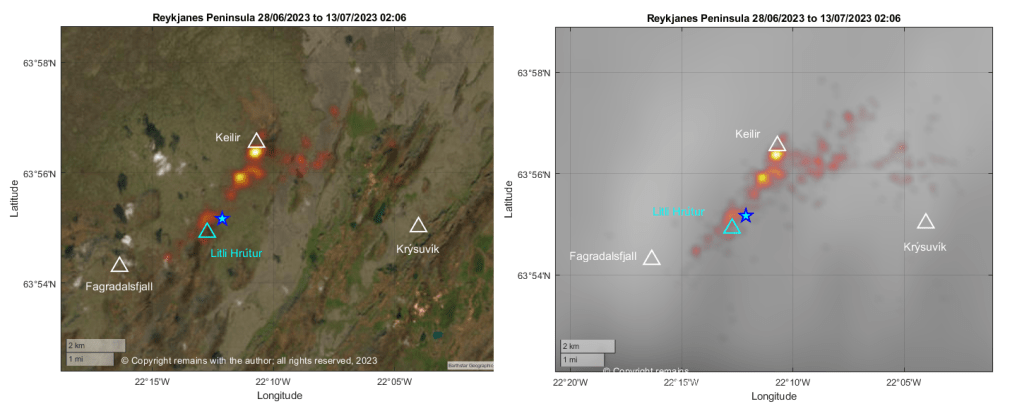
We have updated our earthquake plots to 13th July 2023 02:06, focussing more on the area between Fagradalsfjall, Keilir and Krýsuvík. 

The earthquake density plot is still showing most activity southwest of Keilir and close to the eruption site, which we determined from eyeballing the location of the crater. The area southeast of Keilir is also showing more activity.  Whether the activity close to Keilir is triggered quakes, the result of faults moving to accommodate the magma intrusion, or magma-related (or, indeed, both) remains to be seen.

Fig 2: Geodensity plots by the author.  The blue star shows the approximate location of the crater. In the image to the right, we have removed the satellite image background so that the earthquakes are more visible. © Copyright remains with the author; all rights reserved, 2023. 
Fig 3:  Geoscatter plots by the author.  The blue star shows the approximate location of the crater. © Copyright remains with the author; all rights reserved, 2023. 
Fig 4:  Scatter plots by the author.  The blue star shows the approximate location of the crater. © Copyright remains with the author; all rights reserved, 2023. 
Fig 5:  Combined geoscatter & scatter plots by the author.  © Copyright remains with the author; all rights reserved, 2023. 

Armchair Volcanologist

© Copyright remains with the author; all rights reserved, 2023

Sources

Raw earthquake data: Skjálfta-Lísa (vedur.is)

Other sources are included in the text.

Updates on Seismicity in the Mount Þorbjörn Area, 17th April 2022 to date

Good Evening!

Update 26th May 2022

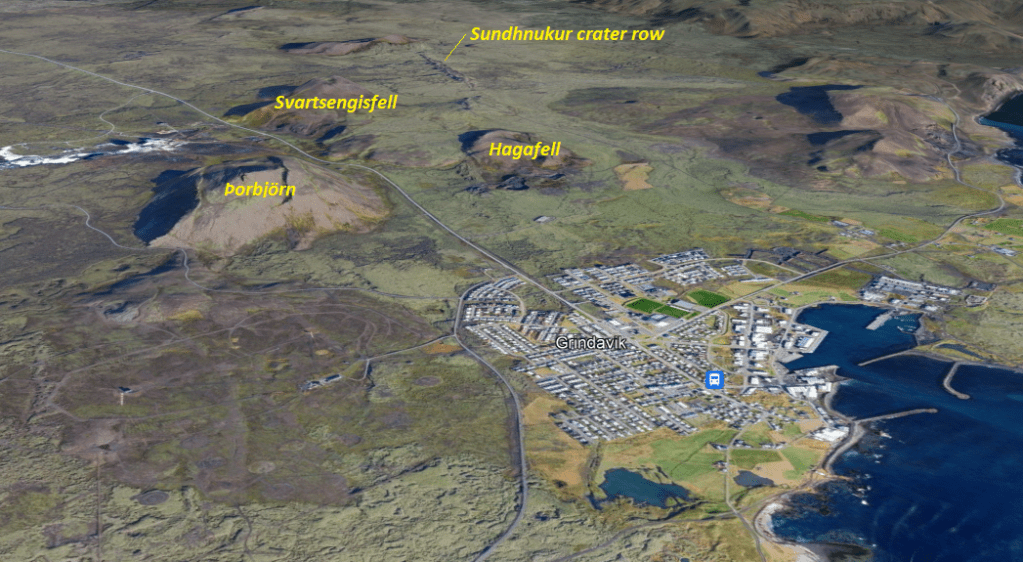
Seismic activity continues in the Svartsengi area, extending to the Sundhnúkur crater row.  The earthquakes in the vicinity of Mount Þorbjörn appear to be getting shallower today as at the time of writing. 

The Sundhnúkur crater row erupted c. 2,360 years ago. It is accredited with creating the Hópsnes/Þórkötlustaðanes land spit to the east of Grindavík.  

Fig 8: Bird’s eye view of the Svartsengi area and Gringavík.  Image from Google Earth; yellow text added by the author.

Here are our updated earthquake plots to 26th May 2022 15:06.

Fig 9: Summaries of Days 39 (25th May 2022) and 40 (26th May 2022) by the author. Grey & green circles denote earthquakes < 3M, yellow stars between 3M and 4M and red stars ≥4M. Blue triangles denote volcanoes: K is Krýsuvík, Ke is Keilir, F is Fagradalsfjall, Ge is Geldingadalir, Þ is Þorbjörn, El is Eldvörp and R is Reykjanes.  © Copyright remains with the author; all rights reserved, 2022.
Fig 10: Earthquake plots depth by day by the author for the area 63.81°N, 22.5°W to 63.90°N 22.35°W from 17th April 2022 (Day 1) to 26th May 2022 (Day 40).  Size denotes magnitude.  © Copyright remains with the author; all rights reserved, 2022.
Fig 11: Geodensity plot of earthquakes by the author for the area 63.81°N, 22.5°W to 63.90°N 22.35°W from 17th April 2022 (Day 1) to 26th May 2022 (Day 40).  © Copyright remains with the author; all rights reserved, 2022.
Fig 12: Latitude v Longitude scatter plot of the area 63.81°N, 22.5°W to 63.90°N 22.35°W from 17th April 2022 to 26th May 2022. Colour indicates age: red, oldest; and, yellow, youngest.  © Copyright remains with the author; all rights reserved, 2022.

The following video shows both the geoscatter plots by day from 17th April 2022 to 26th May 2022 in the swarm for the western Reykjanes Peninsula, and the scatter plots for the same period for the area around Mount Þorbjörn.

Fig 13: Video by the author of the geoscatter plots and scatter plots from which the above images have been extracted. Keys are in the video.  © Copyright remains with the author; all rights reserved, 2022.

While the earthquake plots are highly suggestive of more shallow magma ascent, we need to bear in mind that this area is on the plate boundary, the Mid Atlantic Ridge. Some of the seismic activity may be existing faults moving to accommodate the magma. Time will tell when and where magma emerges.

For the latest updates and alerts, please consult with IMO or the local authorities.

Armchair Volcanologist

Original Post 24th May 2022

The earthquake swarm that started on 17th April 2022 on the western Reykjanes Peninsula continues.  Today we are plotting activity at the Svartsengi area near Mount Þorbjörn, which lies to the north of Grindavík, Iceland. We have used Mount Þorbjörn as the marker for Svartsengi in our plots.

Fig 1: Image cropped from one by Arian Zwegers of the Blue Lagoon looking towards Mount Þorbjörn.  Published under CC-BY SA-2.0.  Source: Þorbjörn (mountain) – Wikipedia

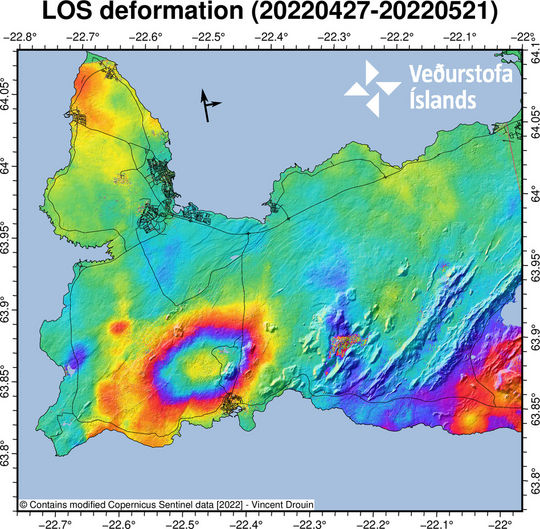
 IMO reports that there has been significant uplift of 40mm to 45mm during the swarm in the area north of Grindavík indicative of magmatic activity.

Fig 2: Ground deformation (Source: IMO, Talsverð skjálftavirkni á Reykjanesskaganum)
Fig 3: Stations in the area showing uplift.  Source for each station: Icelandic Meteorological Office

Let’s look at the earthquakes.

Western Reykjanes Peninsula

Initially, we updated our plots of the area between 63.75°N,23.0°W to 64.0°N, 22°W.  Here is a summary.

Fig 4: Plots by the author of earthquake activity from 17th April 2022 (Day 1) to 24th May 2022 (Day 38) between 63.75°N,23.0°W to 64.0°N, 22°W . Grey & green circles denote earthquakes < 3M, yellow stars between 3M and 4M and red stars ≥4M. Blue triangles denote volcanoes: K is Krýsuvík, Ke is Keilir, F is Fagradalsfjall, Ge is Geldingadalir, Þ is Þorbjörn, El is Eldvörp and R is Reykjanes. Day 38 shows the earthquakes to date in the swarm.  The video below shows the progression of the swarm by day.  © Copyright remains with the author; all rights reserved, 2022.

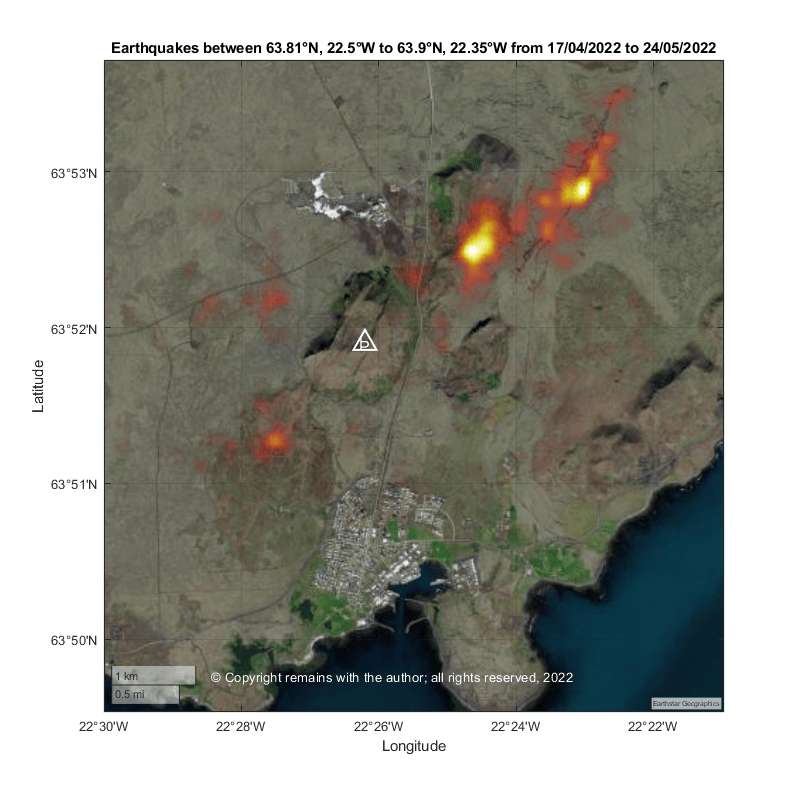
From a simpler scatter plot and a geodensity plot, we can see much of the activity has occurred near Mt Þorbjörn or Svartsengi in the area enclosed in the green box below.

Fig 5a: Latitude v. longitude scatter plot by the author of earthquakes between 63.75N,23W to 64.0N,22W from 17th April 2022 to 24th May 2022. Colour denotes age (red being the oldest and yellow the most recent).  Blue triangles denote volcanoes: K is Krýsuvík, Ke is Keilir, F is Fagradalsfjall, Ge is Geldingadalir, Þ is Þorbjörn, El is Eldvörp and R is Reykjanes. The green square is the area selected for further analysis today (63.81°N, 22.5°W to 63.90°N, 22.35°W). © Copyright remains with the author; all rights reserved, 2022.
 Fig 5b: Geodensity plot by the author of earthquakes between 63.75N,23W to 64.0N,22W from 17th April 2022 to 24th May 2022. © Copyright remains with the author; all rights reserved, 2022.

Let’s look more closely at the area around Mt Þorbjörn.

Svartsengi Area, 63.81°N, 22.5°W to 63.90°N, 22.35°W

Fig 6: Plots by the author of earthquake activity from 17th April 2022 (Day 1) to 24th May 2022 (Day 38). Grey & green circles denote earthquakes < 3M, yellow stars between 3M and 4M and red stars ≥4M. Blue triangle is Þ, Þorbjörn. © Copyright remains with the author; all rights reserved, 2022.
 Fig 7a: Latitude v. longitude scatter plot by the author of earthquakes between 63.81°N, 22.5°W to 63.90°N, 22.35°W from 17th April 2022 to 24th May 2022. Colour denotes age (red being the oldest and yellow the most recent).  Blue triangle is Þ,  Þorbjörn. © Copyright remains with the author; all rights reserved, 2022.
 Fig 7b: Geodensity plot by the author of earthquakes between 63.81°N, 22.5°W to 63.90°N, 22.35°W from 17th April 2022 to 24th May 2022. The Svartsengi geothermal plant and Blue Lagoon are to the north of Þorbjörn and Grindavík is to the south. © Copyright remains with the author; all rights reserved, 2022.

For more up to date information on the seismic activity and the latest alerts, please refer to the local authorities or the Icelandic Met Office, IMO.

Armchair Volcanologist

© Copyright remains with the author; all rights reserved, 2022.

Sources

Raw earthquake data: IMO

Aviation Alert Level for The Krýsuvík Volcanic System raised to Orange

3 March 2021 (Updated 07.03.2021 – new plots added).

The earthquake swarm which started on 24 February 2021 between Kleifarvatn and Svartsengi on the Reykjanes Peninsula is continuing.

This image has an empty alt attribute; its file name is capture-keilir.png
Fig 1: Keilir.  Image cropped from one taken by Michal Klajban, published under CC BY-SA 4.0.  Keilir is the dark cone in the background; Spákonuvatn lake is in the foreground.

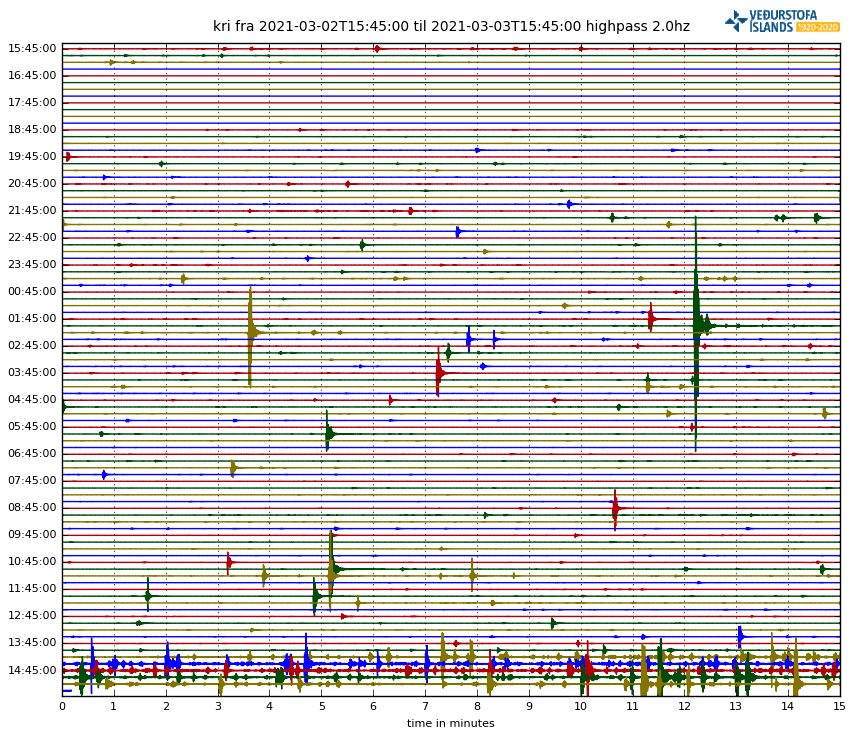
IMO have raised the aviation code for Krýsuvík to Orange and report a tremor pulse south of Keilir.  At the time of writing, no eruption has been confirmed; however, visibility of the area is hampered by weather.

Fig 2: Drumplot showing the onset of the tremor pulse.  Source: IMO.

If magma does reach the surface, the most likely scenario is a fissure eruption, which would produce effusive basaltic lava flows and toxic gases, rather than an explosive ashy eruption.  If lava meets a significant amount of water, some tephra may be produced.

The likely impact from any eruption is expected to be disruption of air traffic and also road traffic access to and from Keflavík International Airport, if lava flows cross the access road.

Keilir, itself, is a subglacial mound near Krýsuvík formed during the Pleistocene during a fissure eruption.  The mound is built of tephra formed when melting ice met magma, topped by lava. Fagradalsfjall, another location associated with the earthquake swarm, is a Pleistocene table-mountain.  As lava prefers to take the easy route out, it is unlikely to emerge via these two volcanoes whose lavas would be fairly solid – hence the expectation of a new fissure swarm.

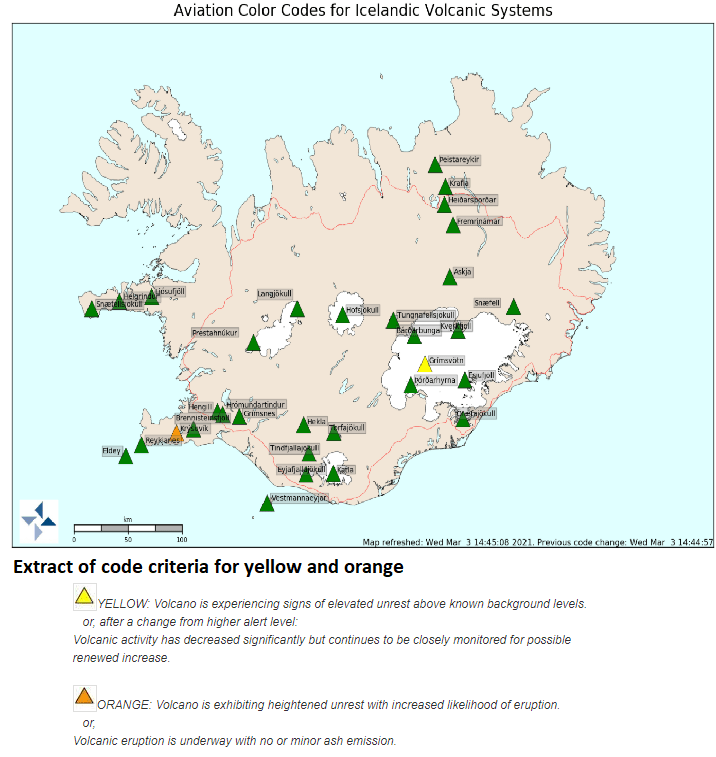
Fig 3: Current aviation codes for Iceland.  Source: IMO.

For status updates, please consult IMO.

A local news service that is also providing updates in English is the Reykjavik Grapevine.

Life is not easy for the research scientists monitoring events.  Two had to be rescued after having been separated from the main party while studying gas emissions.  Spare a thought for the risks they take. 

The public have been advised to stay clear of the area at least until it is known where and how lava emerges and where it would be safe to observe the eruption.

In our excitement at the thought of a possible eruption we overlooked the very real risk of larger earthquakes, if the intensity of the swarm continues: up to 6.0 M near Fagradalsfjall and up to 6.5 M in the Brennisteinfjöll range. Be careful if you are in the area.

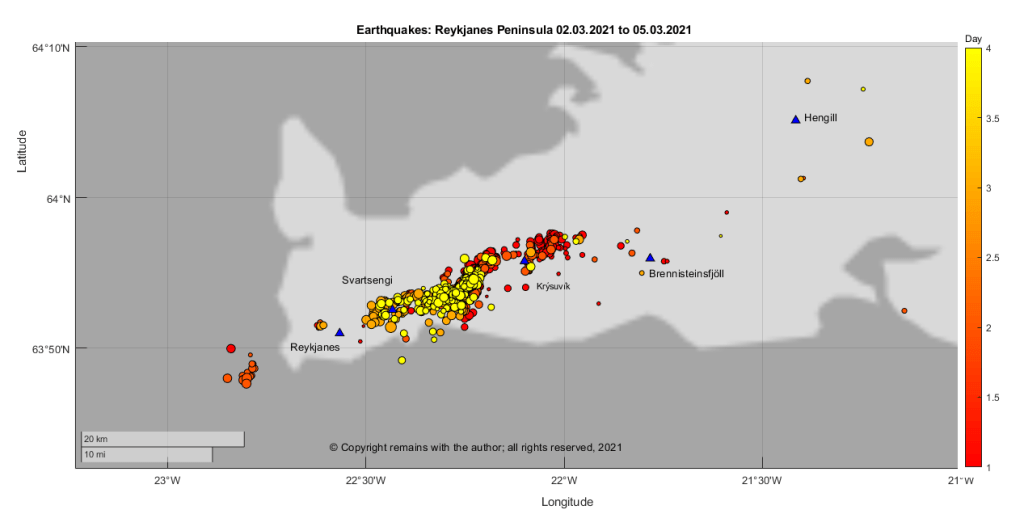
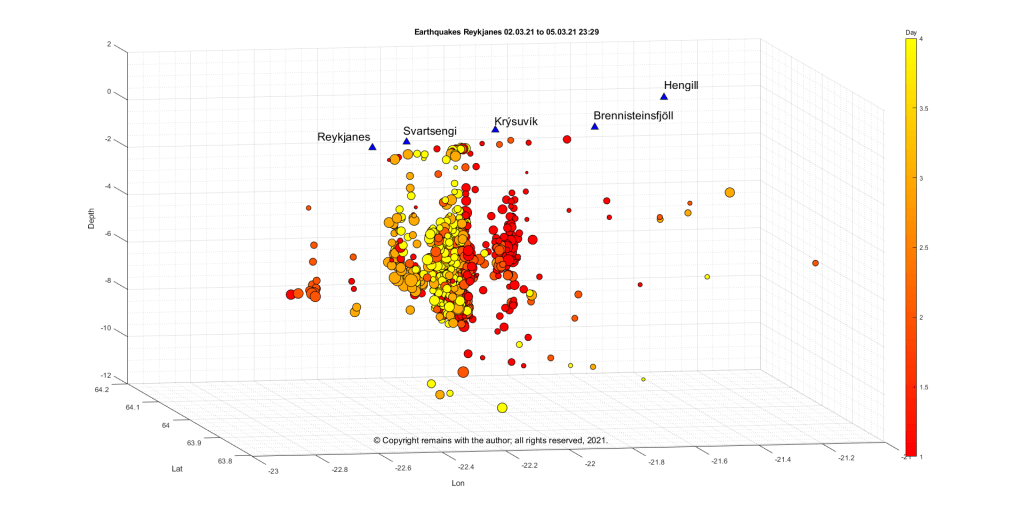
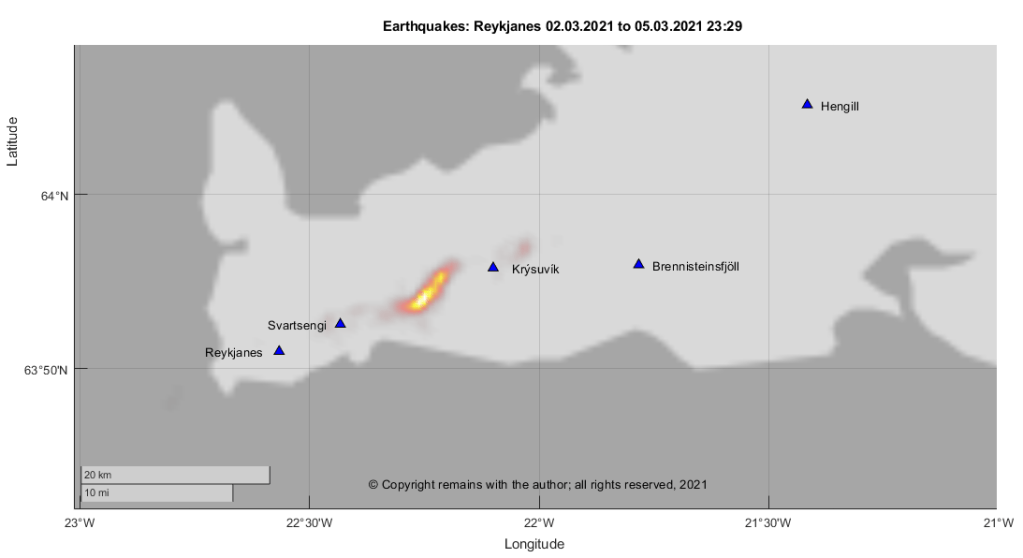
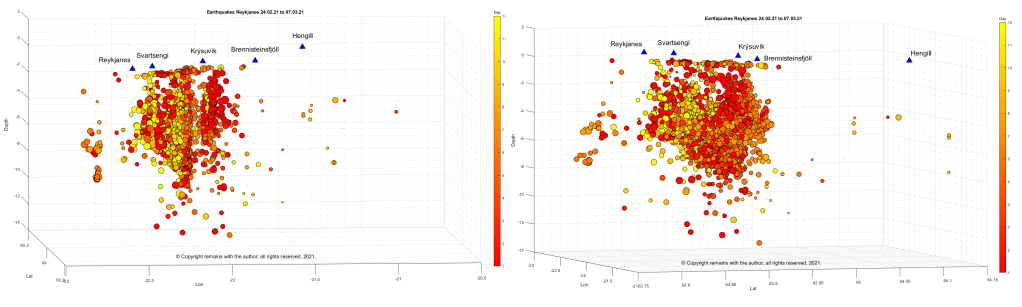
Update 05.03.2021 23:29

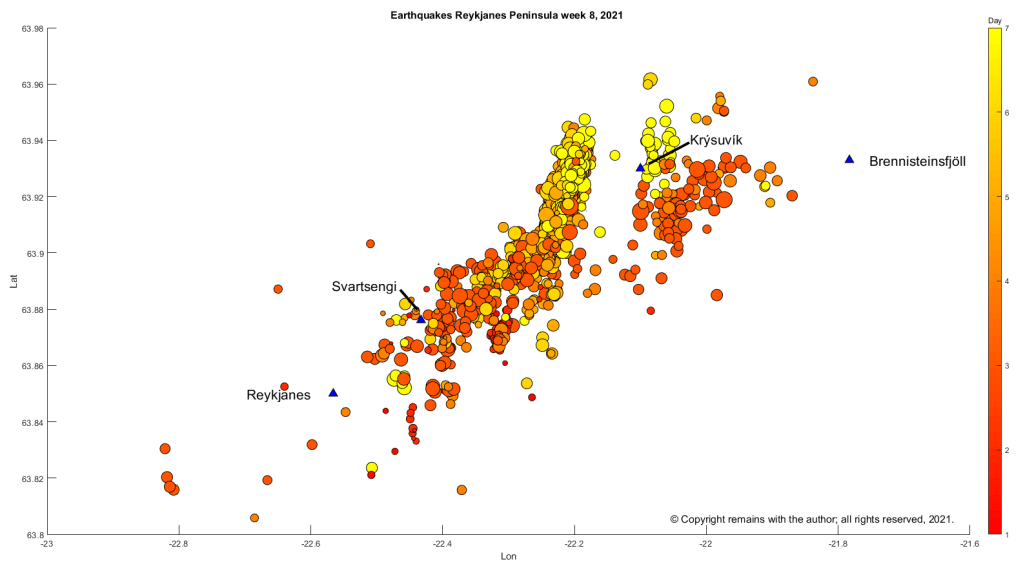
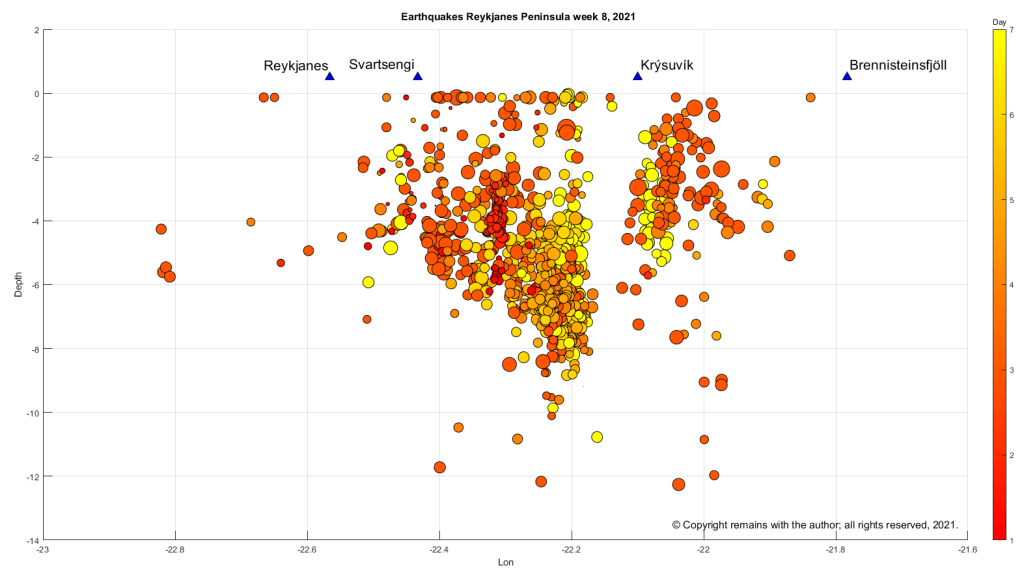
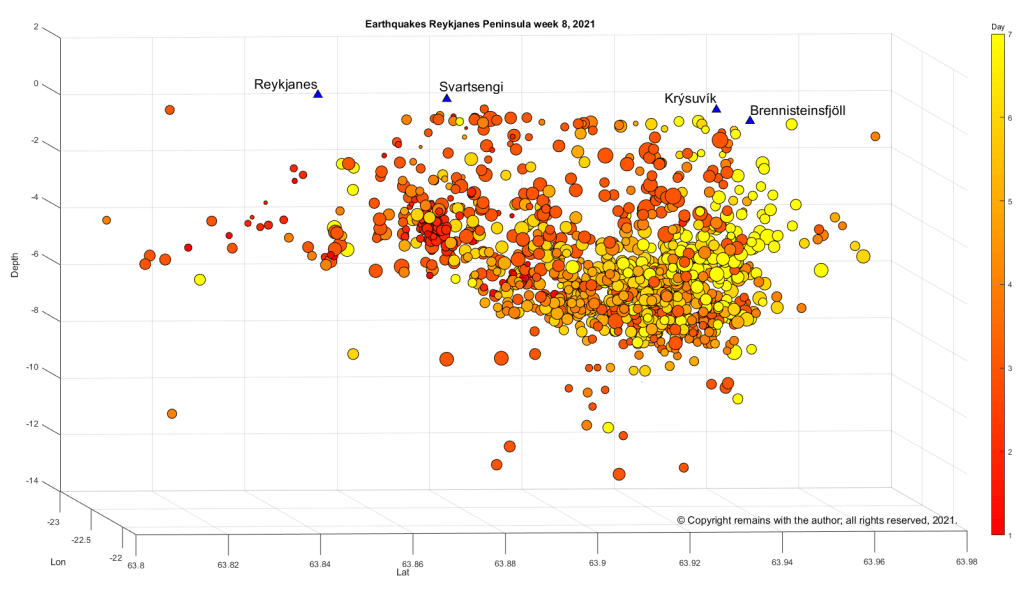
We have plotted the earthquakes with a quality of 99.0 from IMO’s page showing the earthquakes for the last 48 hours for the Reykjanes Peninsula for the period 2 March 2021 to 5 March 2021 (23:29) (we were too slow to capture 1 March 2021).  Here are the results.  Colour coding in the scatter plots is by day and size reflects magnitude.  The geodensity plot is weighted by magnitude.

Fig 4: Geoscatter plot by the author of the earthquake swarm on the Reykjanes Peninsula for the period 2 March 2021 to 5 March 2021 (23:29).© Copyright remains with the author; all rights reserved, 2021.
Fig 5: Depth scatterplot by the author of the earthquake swarm on the Reykjanes Peninsula for the period 2 March 2021 to 5 March 2021 (23:29). © Copyright remains with the author; all rights reserved, 2021.
Fig 6:  Geodensity plot by the author of the earthquake swarm on the Reykjanes Peninsula for the period 2 March 2021 to 5 March 2021 (23:29). © Copyright remains with the author; all rights reserved, 2021.

Update 07.03.2021

Here are plots for the entire swarm from 24.03.2021 to 07.03.2021

Fig 7: Geodensity and geoscatter plots by the author of the earthquake swarm from 24/02/2021 to 07/03.2021. © Copyright remains with the author; all rights reserved, 2021.
Fig 8: Scatter plots by the author of the earthquake swarm from 24/02/2021 to 07/03/2021. © Copyright remains with the author; all rights reserved, 2021.

As noted above, for the latest status please consult the experts: IMO.

The Armchair Volcanologist

© Copyright remains with the author; all rights reserved, 2021,

Sources:

Icelandic Met Office: https://en.vedur.is/

IMO: Aviation colour code map

Reykjavik Grapevine: https://grapevine.is/

Seismic Activity on the Reykjanes Peninsula

28 February 2021 (updated 2 March 2021 with the addition of earthquake plots showing rifting / dike formation)

Good Evening!

A large earthquake swarm started on 24 February 2021 on the Reykjanes Peninsula in the vicinity of the Krýsuvík volcanic system between Kleifarvatn and Svartsengi.  At the time of writing the swarm is still ongoing with over 7,200 earthquakes record by Iceland’s SIL system.  Three earthquakes of 5.0M or more have been recorded: 5.7M and 5.0M on 24 February and a 5.2 on 27 February 2021. 

The alert level for the Krýsuvík volcanic system has been raised to yellow following sightings of steam jets in geothermal areas in the region after the 5.7M and 5.0M.

The Icelandic Met Office have attributed this swarm to the recent re-awakening of volcano-tectonic activity on the Peninsula.

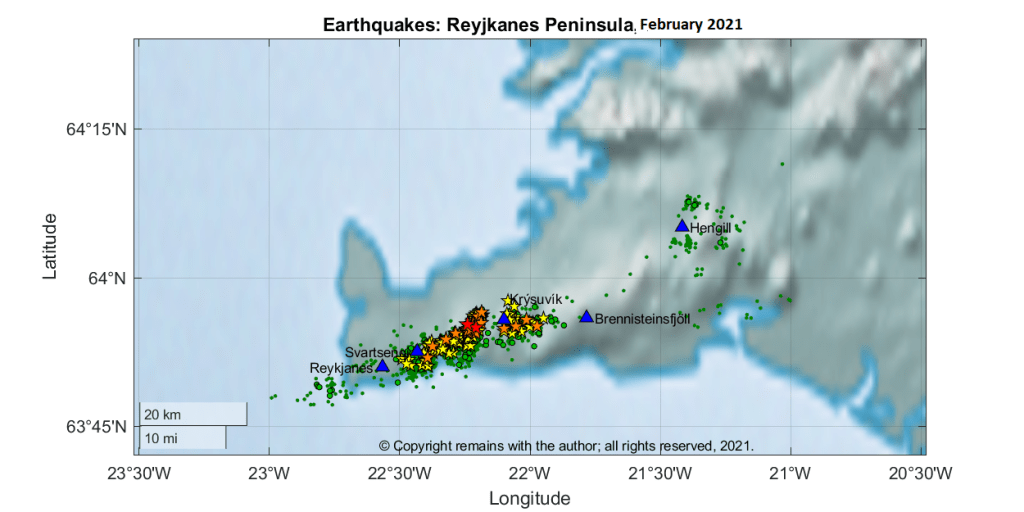
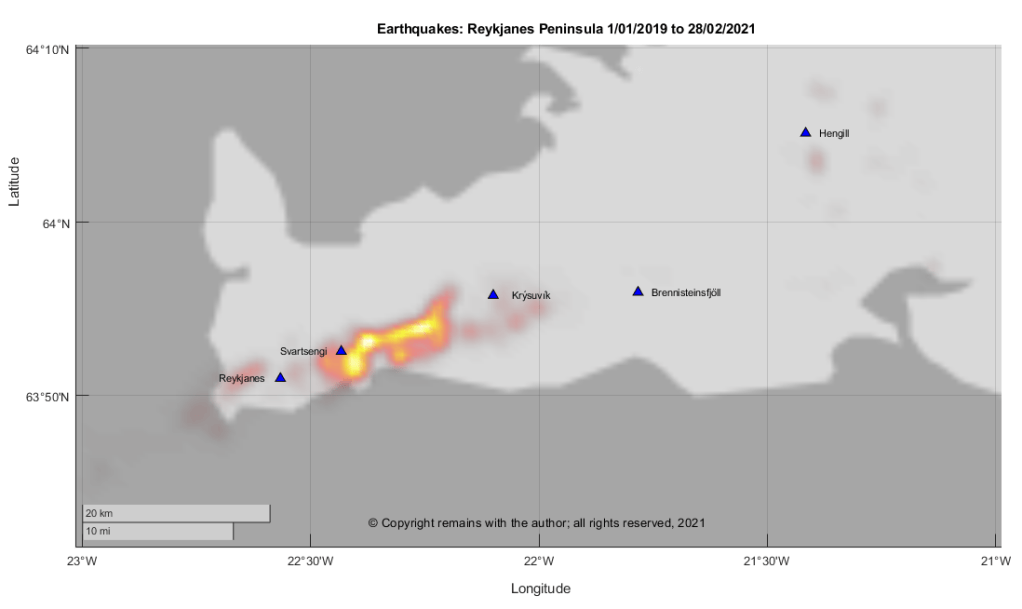
We downloaded the confirmed earthquakes from IMO’s site to take a look. We plotted earthquake density for Week 8, 2021, earthquake locations for February 2021 and earthquakes by month from January 2009 to February 2021.

From our plots we can see the awakening of the volcano-tectonic activity with the upkick in number of earthquakes from December 2019.  The current swarm is part of this activity.

Fig 1: Geodensity plot by the author of the earthquakes occurring on the Reykjanes Peninsula for Week 8 2021.  The locations of the earthquakes of 5.0M and more are shown by black stars. Blue triangles denote volcanoes.  © Copyright remains with the author; all rights reserved, 2021.
Fig 2: Earthquake plot by the author of earthquakes occurring on the Reykjanes Peninsula in February 2021. Yellow stars denote earthquakes over 3.0M, orange stars over 4.0M and red stars over 5.0M. Blue triangles denote volcanoes.  The rectangle shows the area plotted.  © Copyright remains with the author; all rights reserved, 2021.
Fig 3: Plot by the author of number of earthquakes by month occurring on the Reykjanes Peninsula from January 2009 to February 2021© Copyright remains with the author; all rights reserved, 2021.
Fig 4: Geodensity plot by the author of earthquakes on the Reykjanes Peninsula between 1 December 2019 and 28 February 2021. © Copyright remains with the author; all rights reserved, 2021.

At the time of writing, it is not possible to predict whether or not this activity will result in a local eruption in the near future.  Only time will tell.

Update 1 & 2 /03/2021

Since writing the swarm has continued, with more than 15,000 earthquakes since it began last week.

The Department for Civil Protection has advised on 1 March 2021, that satellite images show deformation in the area has increased more than expected, indicating possible magma inflow.

We can see from the local GPS stations that there has been significant uplift near Krýsuvík.

Fig 5: Composite GPS plots for KRI, SENG and THOB.

We have also produced scatter plots by day for the swarm in week 8, 2021 which show possible rifting or dike formation.

Fig 6: Lat v Lon Scatter plot by the author of earthquakes in the swarm in week 8, 2021 on the Reykjanes Peninsula.  Red is day 1 (22/02/2021) yellow is day 7 (28/02/2021).  © Copyright remains with the author; all rights reserved, 2021.
Fig 7: Depth v Lon Scatter plot by the author of earthquakes in the swarm in week 8, 2021 on the Reykjanes Peninsula.  Red is day 1 (22/02/2021) yellow is day 7 (28/02/2021).  © Copyright remains with the author; all rights reserved, 2021.
Fig 8: Depth v Lat Scatter plot by the author of earthquakes in the swarm in week 8, 2021 on the Reykjanes Peninsula.  Red is day 1 (22/02/2021) yellow is day 7 (28/02/2021).  © Copyright remains with the author; all rights reserved, 2021.

IMO are updating the list of earthquakes for week 8, 2021, at the time of writing. For up-to-date information, please consult IMO.

The Armchair Volcanologist

© Copyright remains with the author; all rights reserved, 2021.

Sources:

Raw earthquake data and status: the Icelandic Meteorological Office:  www.en.vedur.is

Department of Civil Protection and Emergency Management | Almannavarnir

GPS: http://gps.vedur.is/mapGPS.php