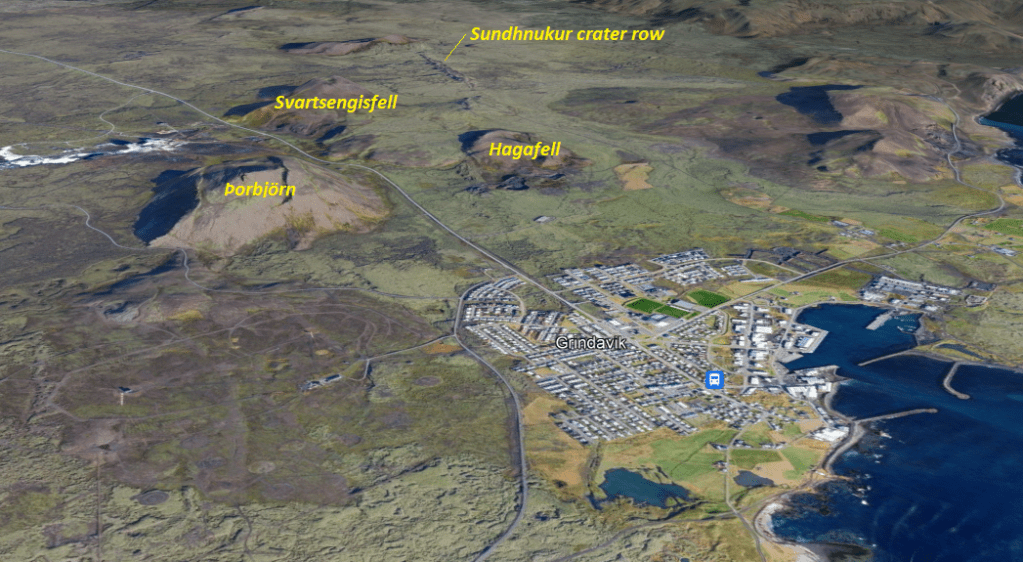
Seismic activity continues in the Svartsengi area, extending to the Sundhnúkur crater row. The earthquakes in the vicinity of Mount Þorbjörn appear to be getting shallower today as at the time of writing.
The Sundhnúkur crater row erupted c. 2,360 years ago. It is accredited with creating the Hópsnes/Þórkötlustaðanes land spit to the east of Grindavík.
Fig 8: Bird’s eye view of the Svartsengi area and Gringavík. Image from Google Earth; yellow text added by the author.
Here are our updated earthquake plots to 26th May 2022 15:06.
The following video shows both the geoscatter plots by day from 17th April 2022 to 26th May 2022 in the swarm for the western Reykjanes Peninsula, and the scatter plots for the same period for the area around Mount Þorbjörn.
While the earthquake plots are highly suggestive of more shallow magma ascent, we need to bear in mind that this area is on the plate boundary, the Mid Atlantic Ridge. Some of the seismic activity may be existing faults moving to accommodate the magma. Time will tell when and where magma emerges.
For the latest updates and alerts, please consult with IMO or the local authorities.
Armchair Volcanologist
Original Post 24th May 2022
The earthquake swarm that started on 17th April 2022 on the western Reykjanes Peninsula continues. Today we are plotting activity at the Svartsengi area near Mount Þorbjörn, which lies to the north of Grindavík, Iceland. We have used Mount Þorbjörn as the marker for Svartsengi in our plots.
Fig 1: Image cropped from one by Arian Zwegers of the Blue Lagoon looking towards Mount Þorbjörn. Published under CC-BY SA-2.0. Source: Þorbjörn (mountain) – Wikipedia
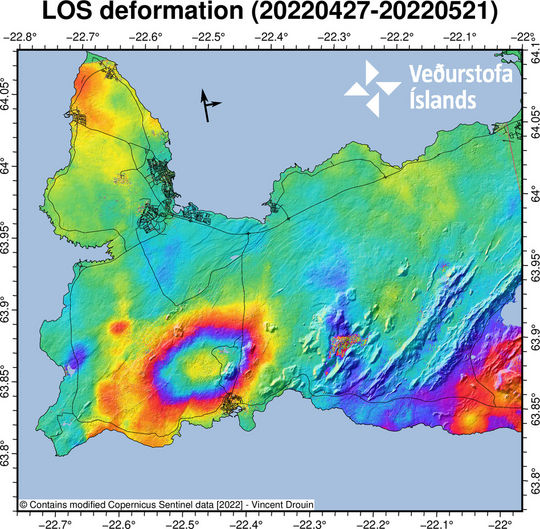
IMO reports that there has been significant uplift of 40mm to 45mm during the swarm in the area north of Grindavík indicative of magmatic activity.
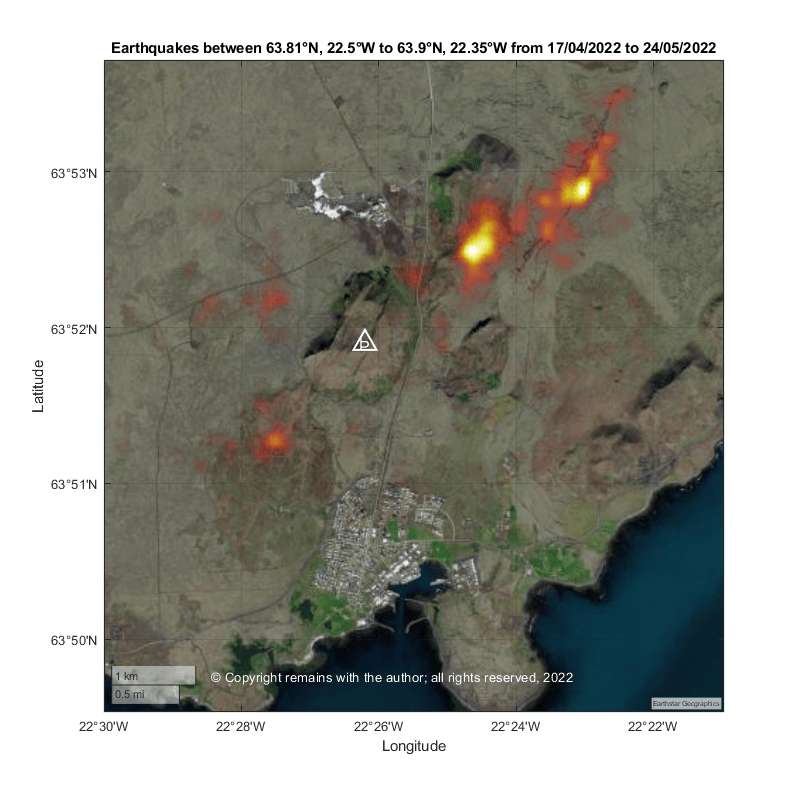
From a simpler scatter plot and a geodensity plot, we can see much of the activity has occurred near Mt Þorbjörn or Svartsengi in the area enclosed in the green box below.
There has been a large earthquake swarm on the Reykjanes Peninsula over recent months, still ongoing at the time of writing, albeit with reduced intensity.
The Reykjanes Peninsula lies at the south west tip of Iceland on the Mid Atlantic Ridge, the boundary between the North American and Eurasian Plates. The North American Plate is moving westwards in relation to the Eurasian Plate; transform and extension faulting accommodate the relative Plate motions. The Reykjanes Volcanic Belt lies on the Reykjanes Peninsula, comprising five north east trending volcanic systems: Reykjanes, Svartsengi, Krýsuvík, Brennisteinsfjöll and Hengill. The volcanic systems are fissure swarms.
Earthquakes
The line of earthquake epicentres in Fig 1 shows the path of the Mid Atlantic Ridge. These earthquakes were extracted from the data set used to generate the plots in the earlier post introducing Iceland. The raw earthquake data is publicly available data downloaded from the Icelandic Meteorological Office for the period January 2016 to 12 April 2020. The plot above is still data-heavy (too much data to see what is happening) so I have extracted the earthquakes by month to see where and when most activity occurred.
In the plots there is an impression of seismic activity trending along the Peninsula from the east to the west. This impression is born out most strongly in the activity from month 48 onwards. Although it should be noted that the level of activity for these months is unusually high.
There are several possible reasons for the east to west trending of the earthquake swarms:
the plates do not move smoothly past each other, so friction generates faults and earthquakes;
rifting is occurring to accommodate the upward motion of land further to the east, generated by the mantle plume in the vicinity of Vatnajökull; and /or,
magma intrusion in local volcanoes.
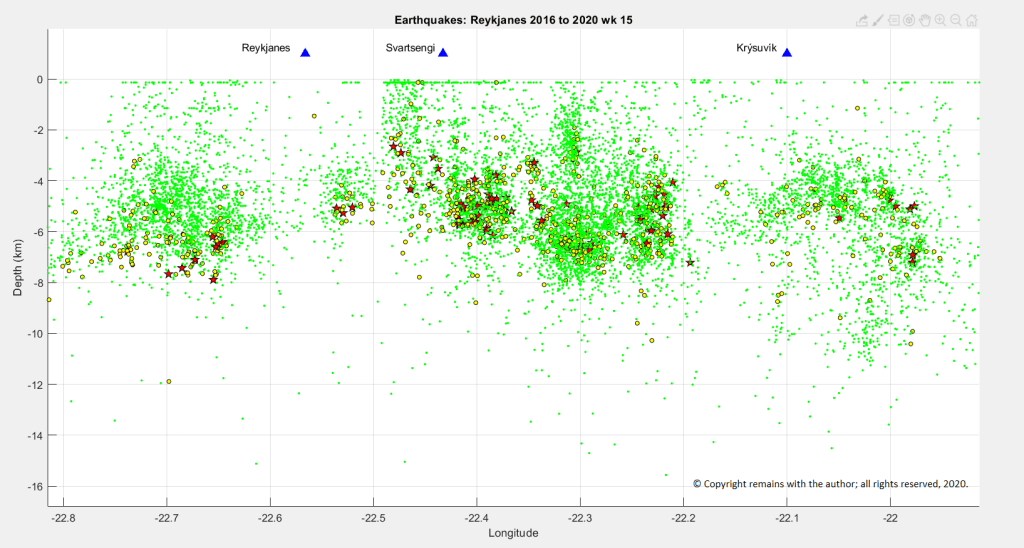
Let’s take a look at depth plots of earthquakes under the Reykjanes / Svartsengi area. This shows that the earthquakes over 3 M are largely in the lithosphere.
Plotting depth against longitude, effectively looking northwards through the swarms, also shows that most larger quakes are in the lithosphere but some over 2 M track towards the surface. On its own, this is not enough to draw any conclusions over the likelihood of an eruption; field observations, including gas emissions and ground deformation are required to determine how close to the surface magma may be.
These swarms were accompanied by local uplift, as shown by local GPS stations.
Fig 9: Uplift in the vicinity of Mt Thorbjörn as shown in recent GPS plots published by IMO: https://en.vedur.is/. THOB moved south eastwards and ELDC moved westward; both showed uplift.
IMO(3) has reported that the most likely explanation for the recent swarms and uplift is a magma intrusion near Mt Thorbjörn at depth; Mt Thorbjorn is located near the Blue Lagoon, Svartsengi. As to whether or not magma will reach the surface for an eruption and where it emerges, we will have to wait and see. In the meantime, let’s look at the recent activity in historical times.
Historic Volcanic Activity
As noted earlier, the volcanic systems are fissure swarms. Activity is driven by rifting which enables magma to reach the surface. The most recent onshore volcanic activity took place between 940 AD and 1340 AD; later activity has been offshore. Onshore lavas from these eruptions tend to be tholeiitic basalts (1). The systems are still active as demonstrated by current geothermal activity.
Hengill
Fig 10: Image cropped from one by Hansueli Krapf, published under cc licence: CC BY-SA 3.0
The Hengill volcanic system is a series of fissure vents, crater rows and small shield volcanoes, with a highest point of 803m. It lies at the triple junction of the Reykjanes Peninsula volcanic zone, the Western volcanic zone and the South Iceland seismic zone. The lava types are basalt / picro-basalt, andesite / basaltic andesite and rhyolite. Hengill’s lavas are more complex that those to the west, reflecting its position at the triple junction. GVP(2) lists 13 Holocene eruptions ranging between VEI 0 and VEI 2; the last known eruption was a VEI 2 in 150 AD.
Brennisteinsfjöll
The Brennisteinsfjöll volcanic system is a series of crater rows and small shield volcanoes, with a highest point of 610m. Its lava types are basalt / picro-basalt. GVP(2) lists 9 Holocene eruptions ranging between VEI 0 and VEI 2. One eruption, previously attributed to Hengill, occurred during a meeting of the Icelandic parliament at Thingvellier in 1000 AD. The most recent eruption was a VEI 2 in 1341.
Krýsuvík
Fig 11: Image cropped from one by Reykholt, published under creative commons licence: CC BY-SA 3.0
The Krýsuvík volcanic system is a series of crater rows and small shield volcanoes, with a highest point of 360m. Like Brennisteinsfjöll, its lava types are basalt / picro-basalt. GVP(2) lists 11 Holocene eruptions ranging from VEI 0 to VEI 2; the most recent of which was in 1340. The Krýsuvík Fires spanned a period between 1151 and 1188, producing 36 km2 of lava.
Reykjanes & Svartsengi
Fig 12: Image of Svartsengi Power Station from one by Jóhann Heiðar Árnason, published under creative commons licence: CC BY-SA 3.0
The Reykjanes volcanic system is a series of crater rows and small shield volcanoes, which extends offshore and includes several small islands. Reykjanes highest point is 140m. The Reykjaneshryggur volcanic system is a submarine system which is considered part of Reykjanes. GVP includes Svartsengi as a crater row of Reykjanes. Reykjanes lava types are basalt / picro-basalt. GVP(2) lists 22 Holocene eruptions ranging between VEI 0 and VEI 4, of which the most recent was a VEI 0 in 1970; the VEI 4 was in 1226. The 1226 eruption was part of the Reykjanes Fires which started in 1210 and lasted until 1240.
The area is one that has had a period of intense volcanic activity, so the recent earthquake swarms have generated a lot of interest.
Regular updates on seismic and volcanic activity in Iceland are published by the Icelandic Meteorological Office(3).
The Armchair Volcanologist
14 May 2020
References & Further Reading:
David W Peate, Joel A. Baker, Sveinn P. Jakobsson, Tod E. Waight, Adam J. R. Kent, Nathalie V. Grassineau, Anna Cecile Skovgaard , 2009. “Historic Magmatism on the Reykjanes Peninsula”, Contrib Mineral Petrol (2009) 157:359-382
Smithsonian Institution Natural History Museum Global Volcanism Program (GVP): https://volcano.si.edu


#/media/File:Blue_Lagoon_(6818651629).jpg)