Eruptive activity at the new fissure in Meradalir stalled on 21st August 2022 at around 6:00 am. The seismic tremor ceased following the emission of a blue grey plume. Lava was seen on webcams to be still flowing from the crater just before then. We await to see whether or not this is the end of this eruptive episode.
To quote IMO, “A new chapter is about to begin in the Fagradalsfjall fires, but whether the seismic activity will recur and it will erupt again in the near future or not, time will tell.”
What do we know of the eruption so far? The eruption started on 3rd August 2022. The initial discharge rate was c. 32 cubic metres per second, dwindling to 2 cubic metres per second by 16th August 2022. The total volume of lava emitted by 16th August 2022 was 12 million cubic metres, c. 8% of that emitted by the Geldingadalir eruption last year. At the crater the lava is 20 to 30 metres deep and 40 metres deep by the crater rims, themselves. Over the rest of the lava field the lava is between 5 and 15 metres deep. The new lava has displaced cooling older lava causing it to rise by 3 to 5 metres in places.
The lava composition is similar to the basalt emitted by Geldingadalir in September 2021. The K2O / TiO2 ratio ranges from 9.3 to 9.4 and the MgO is around 8.4 wt(%).
So, it was hours, not days! The eruption started near Fagradalsfjall / Meradalir yesterday at around 13:18 about 1.5 km north of Stóra-Hrut on a north-easterly southwest fissure. The onset was detected by a local webcam and later confirmed by scientists. The alert level is currently orange (Volcanic eruption is underway with no or minor ash emission.)
Like the previous eruption, lava is contained by the local geography so no infrastructure is currently threatened. Gas emissions are, however, a hazard. The lava flow is estimated to be 5 – 10 times that of Geldingadalir at 32 cubic meters per second in the first 24 hours; gas emissions may well be similarly larger.
Visitors are advised not to approach the site at the moment. When the site is open, bear in mind that it is not an easy walk, so for the fit only, and visitors should be properly prepared, including having gas masks and metres.
At the time of updating, we did not have confirmation of the coordinates of the eruption site, so we have guessed based on maps of the fissure. The plots will be updated when more up to date information becomes available.
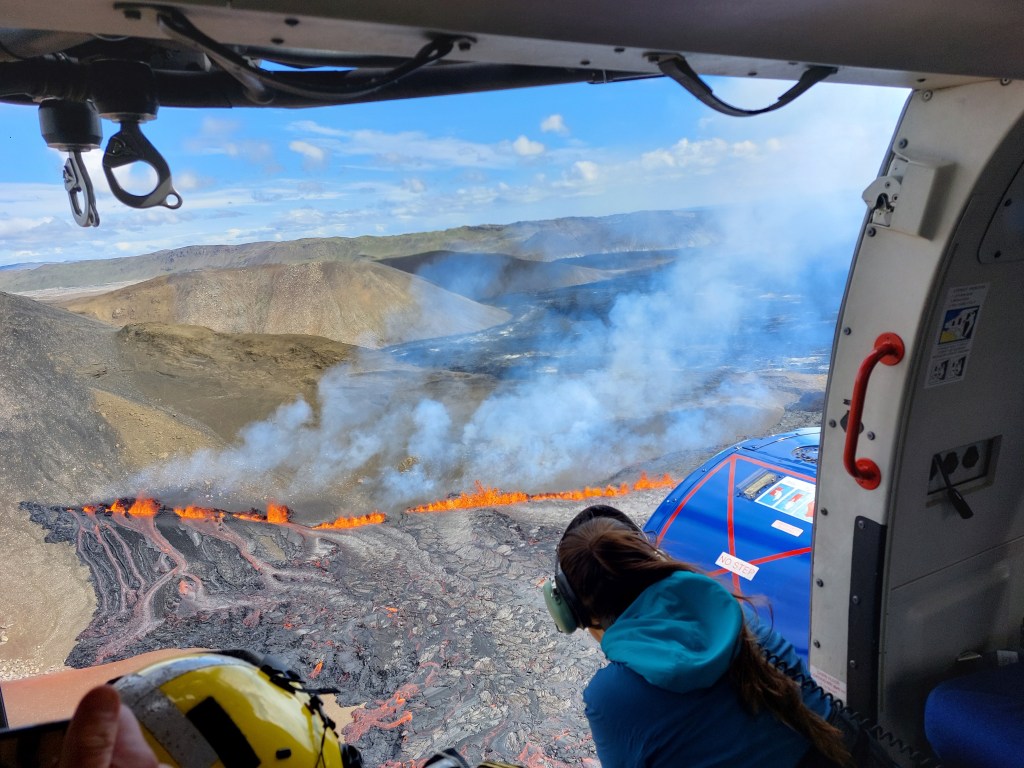
At the time of writing the eruption at Fagradalsfjall is not only continuing unabated but getting stronger. After the opening of five new fissures, eruptive activity has focused on one crater, fissure 5. Lava now covers the Geldingadalur valley floor and threatens to engulf the first cones; lava has been flowing steadily into Meradalir since 24 April 2021.
Eruptive activity changed from continuous fountaining with effusive lava flows to periodic jetting after midnight on 2 May 2021. The change is thought to be due to degassing of the magma in the upper part of the eruption channel where a small chamber may have formed. Each jet is now accompanied by strong gas emissions. Lava flow, itself, is mostly being carried in lava channels under the crater rim, rather than ejected in the current jets so periodic jetting has not adversely impacted the output.
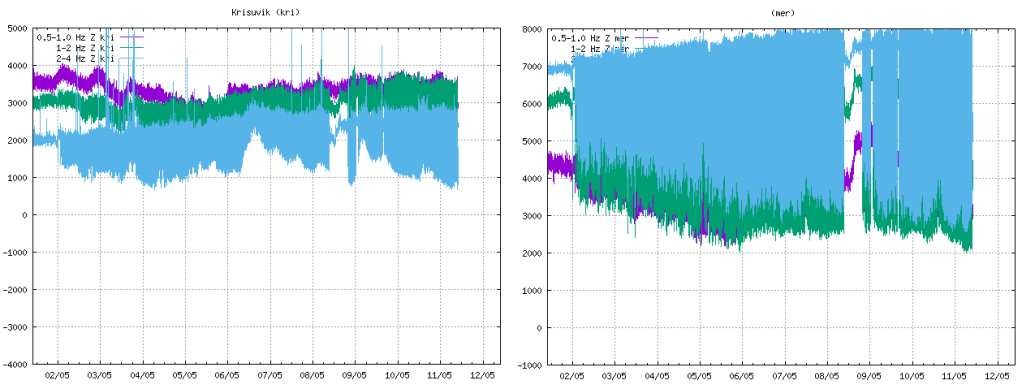
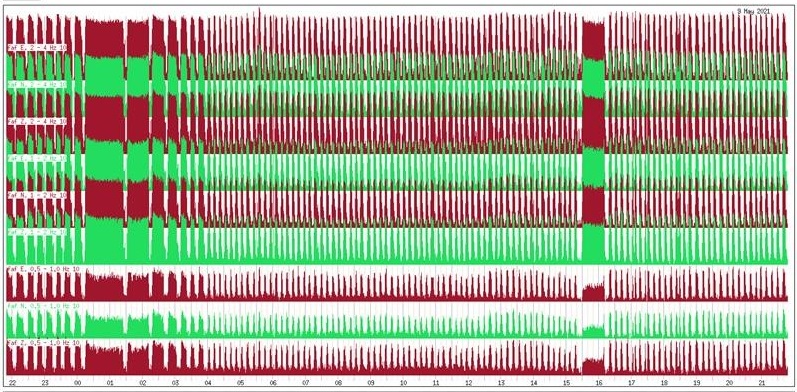
The onset of jetting can be seen in the tremor plots from local stations. We have included KRI because, being further away, we can see more of the lower frequency lines.
Fig 2: Tremor plots for KRI and MER showing the onset of jetting on 02 May 2021. Source: IMO
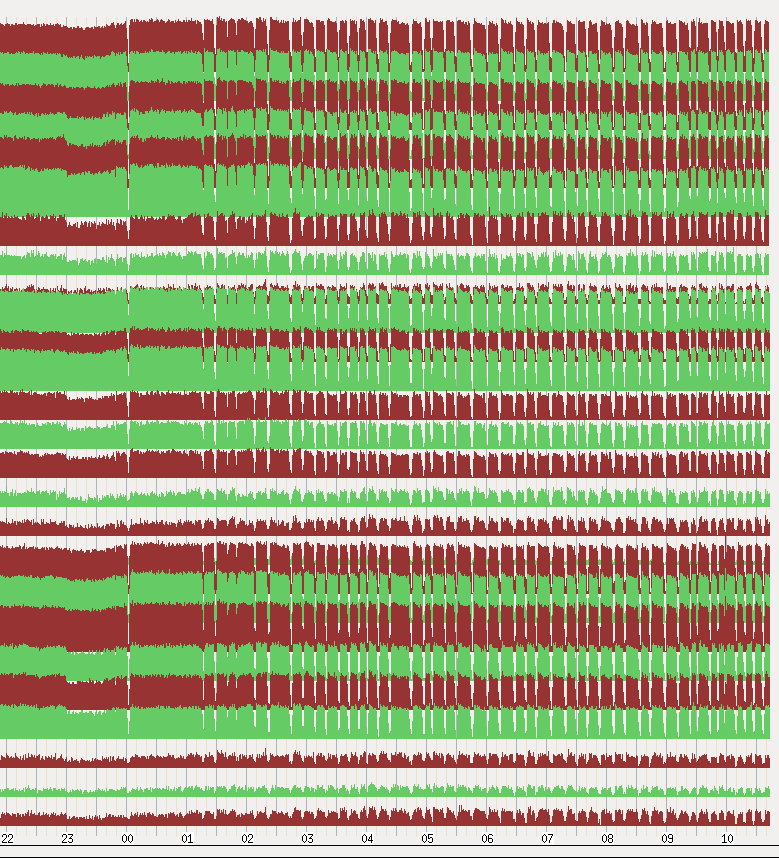
Fig 3: Unrest seen on seismometers near the eruption sites with pulses in volcanic activity from midnight on 2 May 2021. Source: IMO
Fig 4: This image shows the unrest on days 8-9. May. Source: IMO
Area of the Geldingadalsgos lava field: 1.78 Km2 (1.41Km2, 03 May 2021)
Volume of erupted lava: 30.7 million m3 (23.0 million m3, 03 May 2021)
Lava discharge rate: 12.9m3/s, (7.5m3/s, 03 May 2021)
Mg0: varies from 8.5 to 9.8
K20/Ti202 ratio: increasing from 0.1 to 0.3
In the first two weeks of the eruption lava flow decreased steadily from 7-8m3/s to 4-5m3/s. In the second two weeks, five new fissures opened with lava flow varying between 5 – 8m3/s. In the two weeks to 3 May 2021, one crater dominated with lava flow increasing. In the week to 10 May 2021, there has been a large increase in the output of lava to 12.9m3/s; the lava field now covers an area of 1.78km2 with a volume of 30.7 million m3. It is thought that the increase in output reflects changes in the lava channel from the mantle to the surface; it has widened over time.
Changes in chemical composition may mean that materials are mixing in the upper mantle before ascent or there is less partial mantle melt in the magma. If the latter, the eruption will end when the mantle source is sufficiently reduced.
Geldingadalsgos is still a toddler compared to Holuhraun; Geldingadalsgos’ eruption rate is 5% – 10% of the average eruption rate at Holuhraun between September 2014 and February 2015. Let’s hope it stays that way as it is a lot closer to residential areas.
La Soufrière St. Vincent
The alert status was lowered to orange after a period of relative quiescence on 6 May 2021; only a few long period events and volcano-tectonic earthquakes are occurring each day. People are allowed back into the orange zone but the red zone remains an exclusion zone.
The last explosive event was on 22 April 2021. However, a possible lava spine was spotted on photos on 27 April 2021. Tephra fills the crater, increasing the risk of pyroclastic flows should eruptive activity pick up again. In the meantime, lahars are the main hazard.
Mount Pelée
Mount Pelée remains on alert level yellow. Volcano tectonic events are occurring and seismic activity remains at above baseline level. An area of brown and dead vegetation was confirmed on 8 February 2021 caused by diffuse CO2 emissions; the vegetation has not recovered. The volcano is slowly reawakening.
Updated earthquake density video added (uses satellite image as background). 12.04.2021
Good Morning!
Geldingadalur – Where Are We at Now?
Since we last wrote, the new volcano at Geldingadalur has continued to erupt with a lava output rate between 5 m3 per second and 10 m3 per second, filling the Geldingadalur valley with more lava. The University of Iceland has confirmed that the early lava erupted has a magnesium content of 8.5%, a low titanium dioxide content and is more depleted in rare earth elements (low HREE to LREE ratio) than earlier historic lavas, indicating that it is a more primitive lava sourced from the lithospheric mantle at a depth of between 17 km and 20 km.
On 5 April 2021 at around midday, a new fissure opened up about 700 m north east of the original eruption site. The fissure, spotted by a sightseeing helicopter, was quickly confirmed by the RUV.is webcam monitoring Geldingadalur. Fortunately, no-one was in the vicinity at the time due to bad weather and sheer good luck; the site had been open to visitors at the time. The fissure is around 200 m long. Lava from the fissure is flowing into the Meradalir valley.
Fig 1: New fissure on 05.04.2021 in the foreground with lava flowing to Meradalir on the left of the image. The original Geldingadalur eruption is on the right of the image. Photo IMO.
Fig 2: Lava from the first new fissure entering Meradalir at 15:00 06.04.2021. The fissure itself is on the ridge in the background (Photograph: Public Protection/Björn Oddsson).
At around midnight on 6 April 2021, a second fissure opened up between the earlier fissure and the original eruption site. This had been preceded by a landslip earlier in the day. Lava from this fissure is now flowing into both the Geldingadalur and Meradalir valleys, linking the eruption sites. It is believed that the three eruption sites belong to the same fissure.
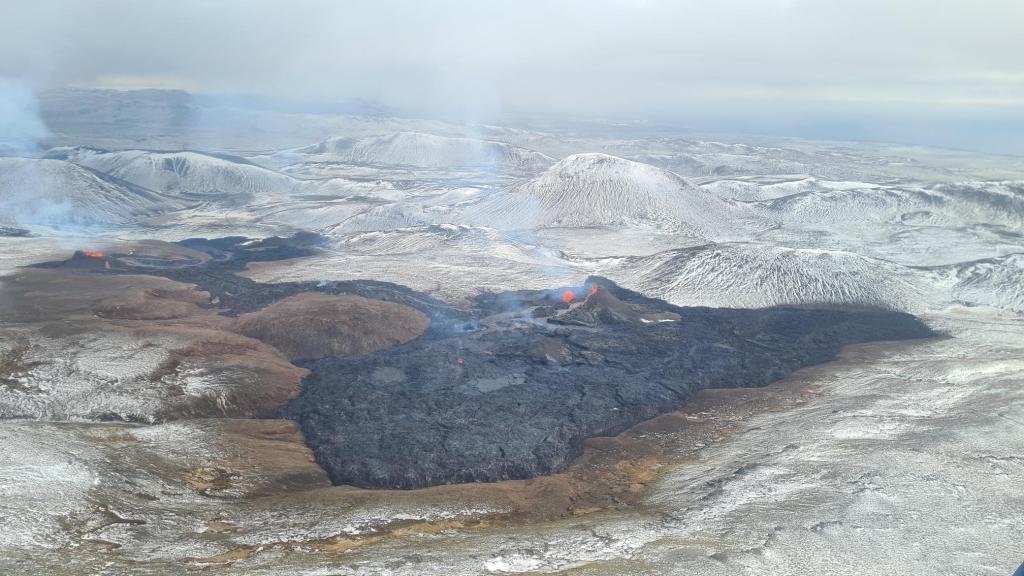
Fig 3: Photograph from Public Protection/Björn Oddsson showing the three eruption sites and lava flows.
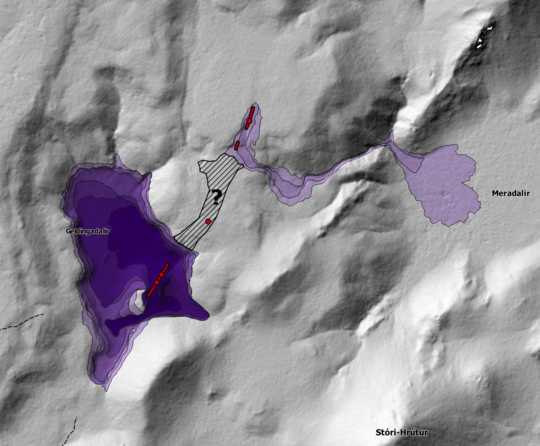
Fig 4: Map showing the location of the three eruption sites from IMO. The fissures are shown as red lines and dots; and, lava flows are based on photography.
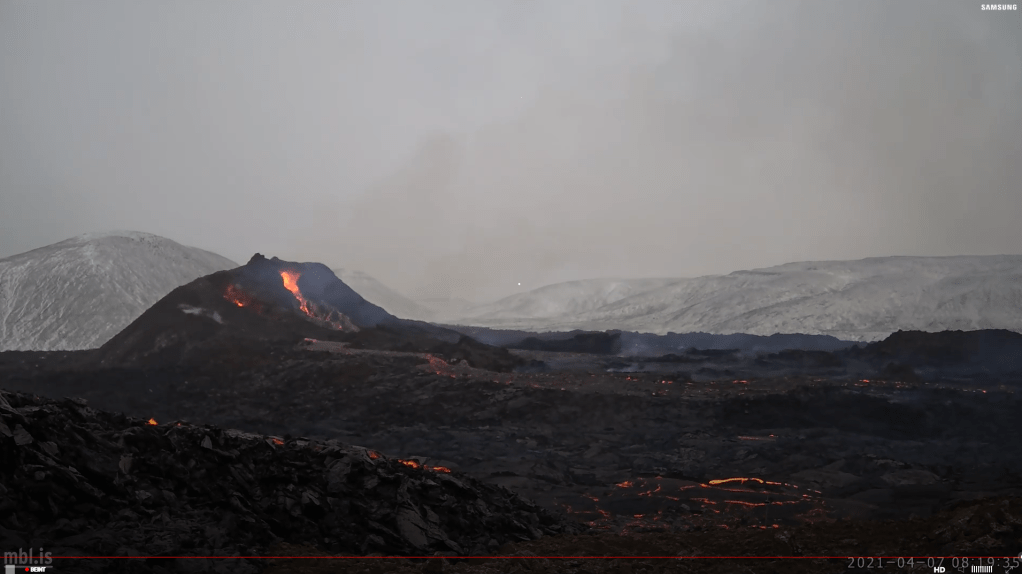
Unfortunately, one of the webcams set up by mbl.is to monitor the Geldingadalur cones was lost; its last image is shown below. We thank mbl.is for providing the webcam; we viewed its images with a lot of interest.
Fig 5: Screenshot from the mbl.is webcam.is set up to monitor the cones at Geldingadalur. This may be this webcam’s last image. The lava flow to the lower left of the image is from the newest fissure.
Like the original eruption site, neither fissure opening was heralded by an increase in seismicity in the immediate vicinity.
Seismicity Post the Initial Eruption
We have updated our earthquake plots for the period 19.03.2021 to 06.04.2021. We can confirm that there is very little earthquake activity in the vicinity of Geldingadalur. The fissures are not giving any seismic warning; seismic activity near Keilir dominates. It is perhaps surprising that magma has not made its way to the surface north east of Fagradalsfjall; does magma finds it easier to make its way through older fault-ridden Pleistocene rock that has not been covered in tougher historic lavas?
We have also tried our hand at making a video of the earthquake density plots by month from 2008 to 6 April 2021. Months are numbered from January 2008 (Month 1) to April 2021 (Month 160, which only has 6 days). If you make it all the way through, you will see that Fagradalsfjall has had several swarms, albeit much smaller than the current one. Enjoy!
The eruption at Geldingalur, Reykjanes, Iceland, which started on 19.03.2021 at 20:25, is continuing unabated as I write. The volcano is happily bubbling away building somewhat unstable but impressive looking cones and covering the Geldingadalur valley floor with lava.
Fig 1: Cones of Geldingadalur, cropped from an image by Berserkur, published under CC BY-SA 4.0
The eruption is steadily increasing at the time of writing; it has a lava output of 5 -7m3 per second. IMO have estimated that the valley would fill enough for lava to overflow into the neighbouring valley, Meradalir, in a matter of days at the current eruption rates.
Fig 2: Image by IMO. Expected path of the lava over the next few days at the current eruption rate.
Scientists at the University of Iceland are analysing the lava. To date, they have reported that the lava is a primitive one (i.e. little magma evolution in the crust), indicative of a mantle source at a depth of 17 km to 20 km.
Geological Setting
The Reykjanes Peninsula lies on oceanic crust created by the Mid Atlantic Ridge. The Peninsula, itself, straddles the Ridge. The crust here is 15 km thick, which is unusual so close to a spreading ridge. However, Iceland is a basaltic plateau overriding a mantle plume. Both the mantle plume and the Mid Atlantic Ridge influence formation of the crust. There are no magma chambers / reservoirs in the crust on the Peninsula; magma tends to ascend directly from the mantle.
The Peninsula is made up of lava shields, móberg hills, table mountains and fissure-fed lava flows and crater rows. The shield volcanoes on the Peninsula formed at the beginning of the Holocene between 10,000 and 7,000 years ago. Shield volcanoes form from hot picrite or olivine tholeiitic basaltic lava flows with rates of c . 5m3 per second. The móberg hills formed from submarine fissure eruptions and consist of pillow lavas, breccias and tuffs. The table mountains were formed from subglacial activity, which had the activity not been constrained by the ice cap, would have resulted in shields. Later Holocene activity has comprised effusive tholeiitic fissure eruptions which formed crater rows and produced large lava flows that now cover some of the earlier formations. Historic activity has been between 940 AD and 1340 AD, including the Reykjanes Fires of 1210 AD to 1240 AD; and, the Krýsuvík Fires of 1151 AD to 1188 AD.
Geldingadalur, itself, is a small valley to the south east of the summit of Fagradalsfjall, a 385m high hyaloclastite subglacial Pleistocene table mountain formed during the Weichselian glacial period, with a subaerial lava cap on its northwest part. It is currently classified as part of the Krýsuvík Volcanic System.
The Fagradalsfjall area is seismically very active, with large earthquake swarms, notably in 1998, 2000, and 2004, and again now as part of the new volcano-tectonic episode on the Reykjanes Peninsula that started in December 2019. Various studies from previous seismic activity have noted extensive faulting under the south west part of Fagradalsfjall; these faults strike N-S and NE -SW. In addition, there are two clusters of faults under the eastern part.
Earlier swarms in the current volcano-tectonic episode have resulted in magma intrusions, such as the one at Mt Þorbjörn which we discussed last year, but no eruption. The latest earthquake swarm which started on 22 February 2021 is the only one to result in an eruption at the time of writing.
Seismicity in the Current Swarm
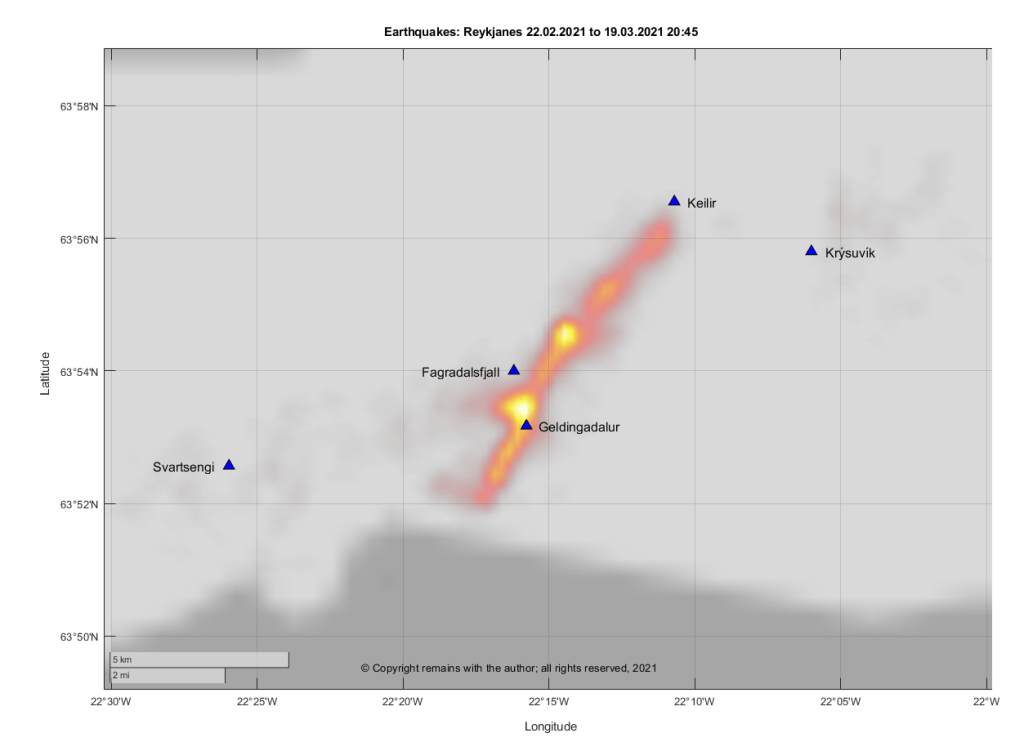
We have updated our plots for the Reykjanes Peninsula and dividing them between the run up to the eruption on 19 March 2021 at 20:45 and after the eruption to 26 March 2021 15:55.
The plots preceding the eruption repeat the ones shown earlier so we are just showing the geodensity plot for comparison. You will note that the earthquakes do not reach down to 15 km in the current swarm to date. However, there were one or two deeper earthquake in some of the earlier episodes.
The plots for the period after the onset of the eruption (19.03.2021 20:45 to 26.03.2021 15.55) show that activity is concentrated on Geldingadalur and two spots north east of Fagradalsjall. Seismic activity has also extended further south.


