Tag Archives: subduction zone

An Introduction to Plate Tectonics

Good Afternoon!

Here is one that we made earlier.

We’ve touched on plate tectonics in several articles so it would be useful to spend a brief moment summarise plate tectonics and to use earthquake data to show the plate boundaries.

Fig 1: Plot by the author of earthquake depths earthquakes of 4.5 M or more from 1975 to 2020. Purple dots denote depths of 0 – 33km, blue denotes 33 -70km, green denotes 70 – 150 km, yellow denotes 150 – 300 km, orange denotes 300 to 500 km and red denotes > 500 km. Deeper quakes are plotted over shallower ones so that they can be seen. © copyright remains with the author; all rights reserved, 2021.

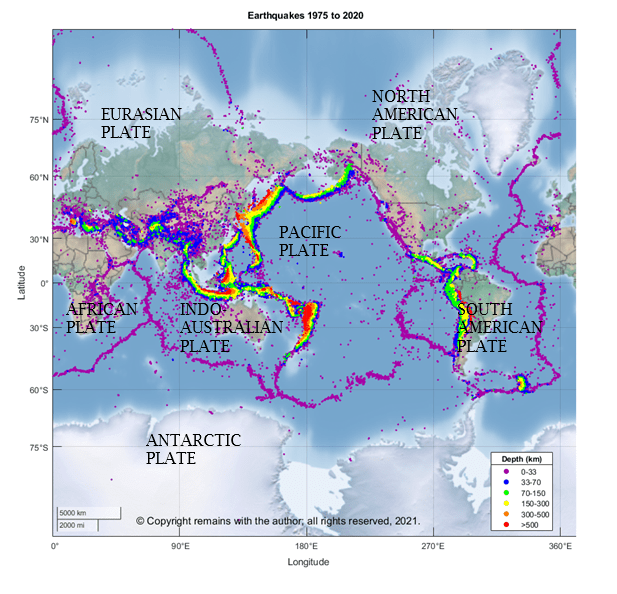
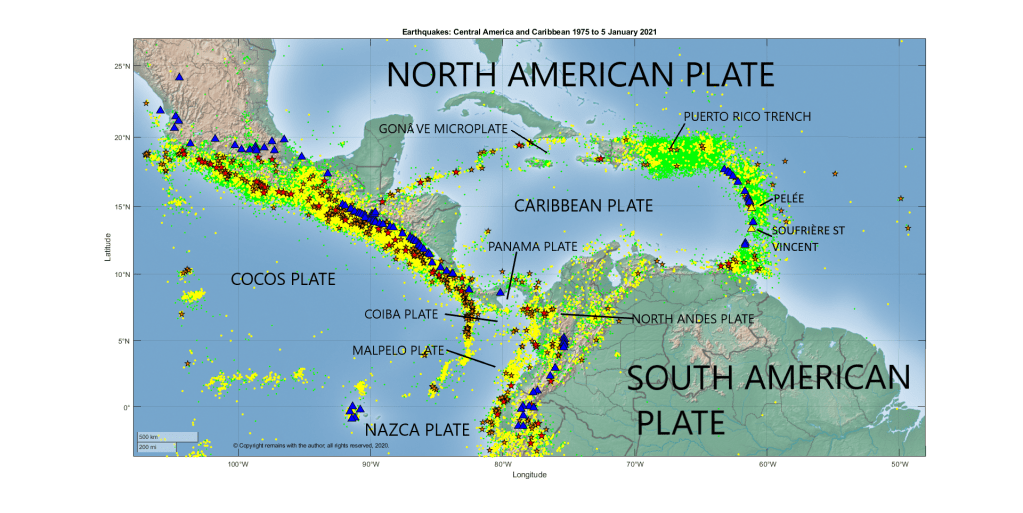
Plate tectonics is the relative movement of the plates to each other. The Earth’s crust is made up of many rigid blocks called plates. There are 7 major plates: the North American Plate, the Eurasian Plate, the Pacific Plate, the South American Plate, the African Plate, the Indo-Australian Plate and the Antarctic Plate; many smaller plates, such as the Juan de Fuca Plate, the Cocos Plate, the Nazca Plate, the Caribbean Plate; and, several micro-plates in the collision zones between the larger plates.  

History

The theory of plate tectonics has evolved from early mappers noting the similarities between the shapes of the continents to the current theories set out below.  F B Taylor and Alfred Wegener developed theories (1910 and 1912, resp.) of continental drift, which was followed by the discovery of subduction zones from seismic studies by Wadati and Benioff in the 1920s and 1930s, Holmes theory (1928) that convection currents in the mantle caused by heat from radio-active decay stretched the oceanic crust caused the continents to split (the old oceanic crust cooled and sank back into the mantle to be melted and recycled), Hess’ theory (1950s) that the formation of ocean basins pushed continents apart and oceanic crust is formed at mid ocean ridges,  confirmation in the 1960s of sea-floor spreading from post WWII studies of magnetic lineations on the sea floor, and the discovery of transform faults also in the 1960s.  

The importance of magnetic lineations in the rocks of the sea bed is that when rocks are formed at the mid ocean ridges they are magnetised in the then direction of the earth’s magnetic field; the polarity of the earth’s magnetic field changes over a cycle and these changes are recorded in rocks, giving an indication of when the rocks were formed; the lineations are replicated each side of the spreading ridge.

Later GPS studies have confirmed the plate motions and led to the discovery of some microplates.

Composition of the Plates

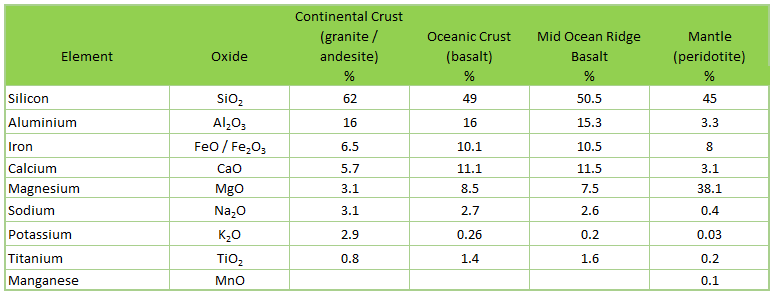
The plates are made up of relatively rigid lithosphere with oceanic and / or continental crust.

Oceanic crust is around 7 km thick, principally made up of basalt, whereas continental crust is up to 30 km thick made up of granites and andesite.  Oceanic crust is formed at sea-floor spreading centres (such as the Mid Atlantic Ridge).  Continental crust is created by volcanic activity and the accretion of terranes (terranes are smaller segments of crust). 

The lithosphere is the rocky upper mantle up to 100 km thick which rests on the weaker layer of the upper mantled called the asthenosphere.  In the asthenosphere, heat rising from the Earth’s core, causes solid state convection; rock in the asthenosphere circulates round – heated rock rising and cooling rock sinking.  The plates ride on the moving asthenosphere.  As the plates move, they generate earthquakes.

Types of Plate Boundaries

Fig 2 Schematic by the author of plate separation at a Spreading Ridge (A), ocean-to- continent collision(B) and continent- to-continent collision (C), showing the asthenospheric convection currents at the Spreading Ridge (large red arrows) and at a Backarc Basin (smaller red arrows) by the author after various sources.  White arrows denote lithospheric motion. © copyright remains with the author; all rights reserved, 2021.

There are three distinct types of plate boundary which are clearly delineated by seismic activity at the plate margins:

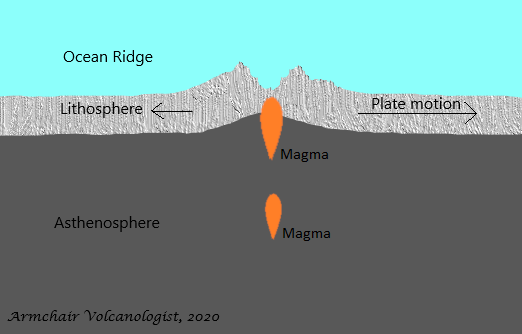
  • Divergent margins where plates move apart from each other.  Asthenosphere rises to fill the gap, cooling to form new lithosphere.  Ocean basins and ridges are formed in this process. Decompression melting of the mantle leads to the formation of magma and volcanoes.  An example of a divergent margin is the Mid Atlantic Ridge.
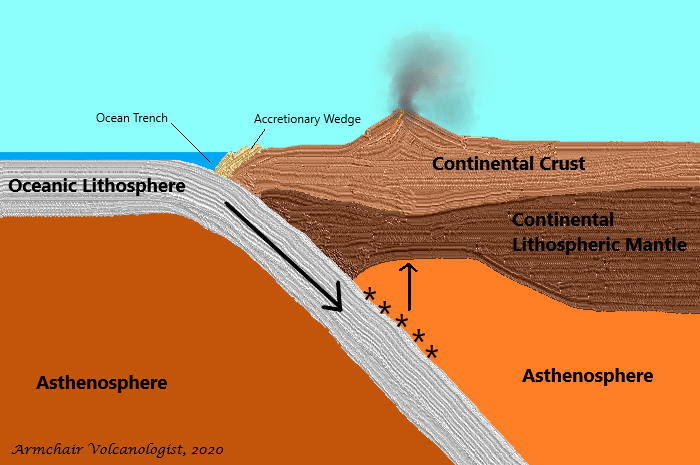
  • Convergent margins where the plates move towards each other and one plate descends beneath the other or overrides the other.  In ocean-to-continent or ocean-to-ocean collision, denser the oceanic crust subducts beneath the lighter continental or oceanic crust.  The descending slab causes the formation of a trench and accretionary wedge (sediment scraped off adheres to the overriding plate). As the temperature and pressure increases on the descending plate, water is released which causes hydration melting of the mantle and surface volcanism.  In continent-to-continent collision, there is no marked subduction: the plate edges are compressed, folded and uplifted.  An example of ocean-to-continent collision is the plate boundary between the Pacific Plate and the North American Plate at the Aleutian Arc. 
  • Transform margins where the plates slide past each other with no vertical motion.  An example of this is the San Andreas Fault which marks the western boundary of the North American Plate.

There are other boundaries that are less well defined.

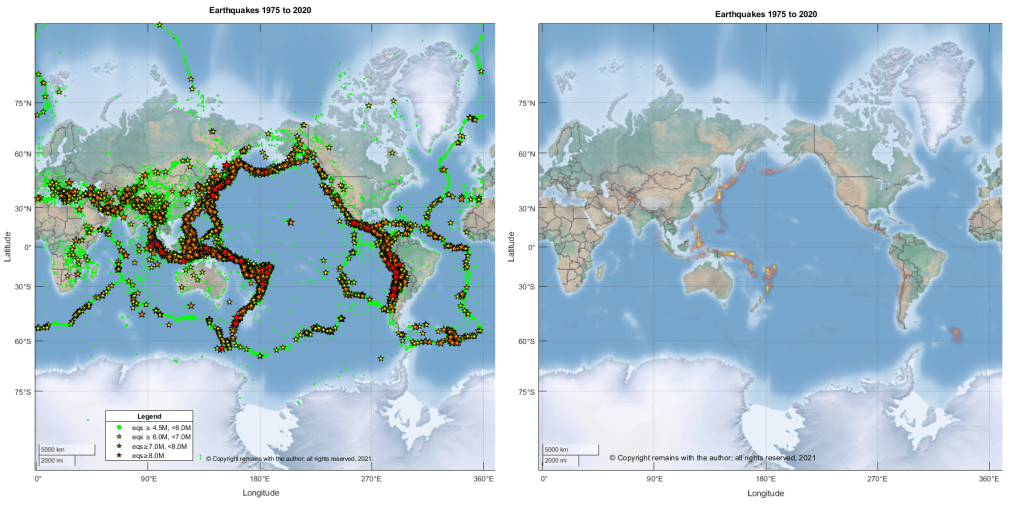
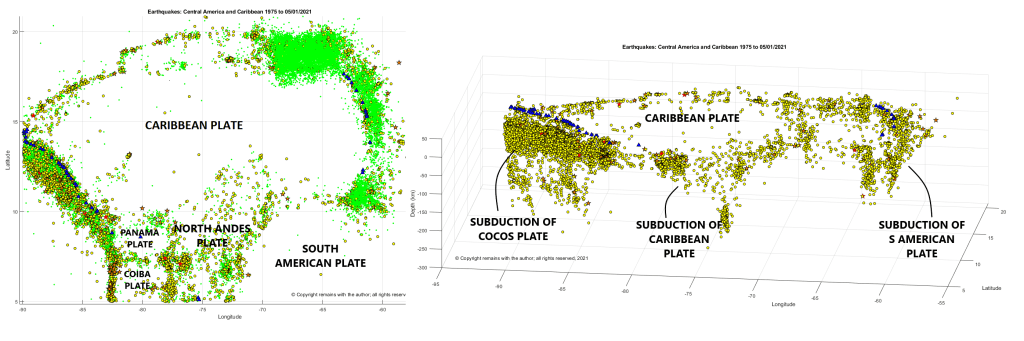
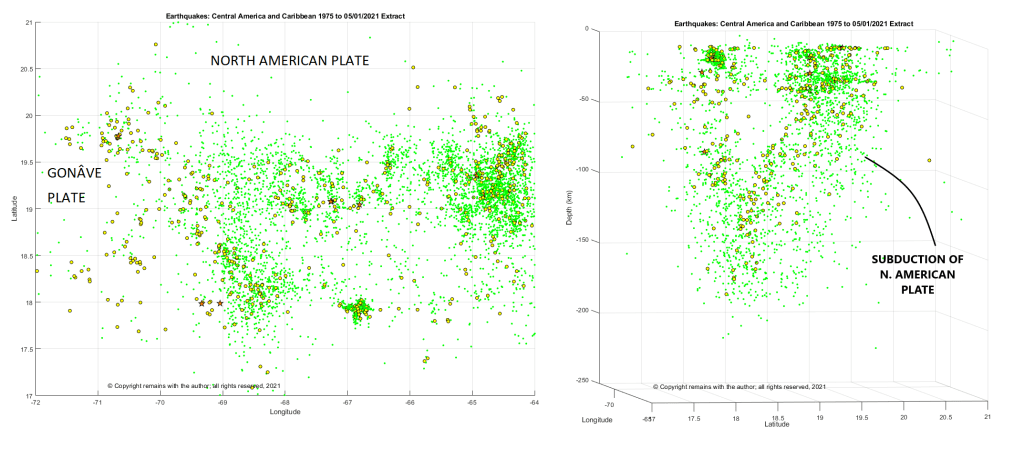
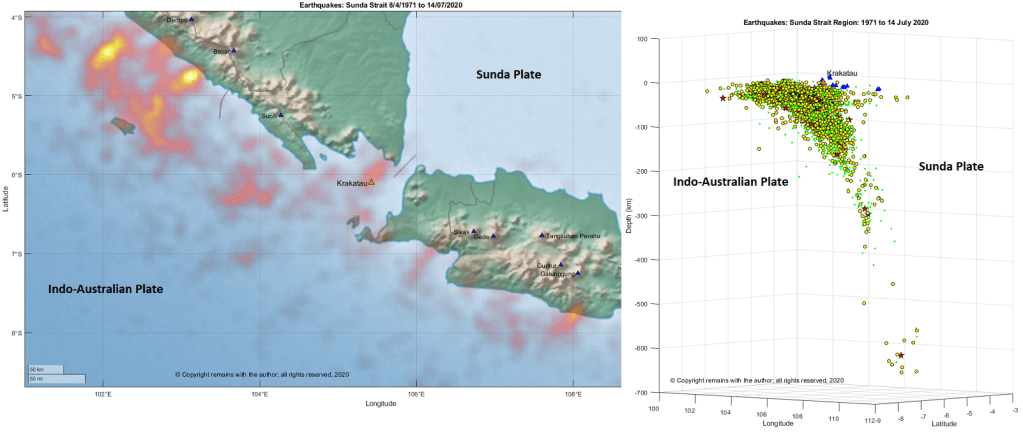
If we plot the earthquakes, we can see the plate boundaries.  We plotted earthquakes downloaded from USGS’s earthquake search with magnitude ≥ 4.5M for the period 1975 to 2020 for coordinates 90°S, 180°W to 90°N, 180°E.

From out plots, most of the plate boundaries are clearly visible (some of the microplate boundaries are hidden due to the scale of the plots): the mid-ocean ridges, ocean-to-continent collision zones marked by deep subduction zones and the shallower continent-to-continent collision zones.   We can also see that the subduction zones bordering the Pacific Ocean and subduction zones of Indonesia are responsible for most of the earthquakes with magnitude of 8.0M or more.

Fig 3: Earthquake plots by the author of earthquakes with magnitude of 4.5M or more; green dots denote earthquakes with magnitude of 4.5M to 6M, yellow stars denoted earthquakes with magnitude 6M to 7M, yellow stars denoted earthquakes with magnitude 7M to 8M and yellow stars denoted earthquakes with magnitude ≥ 8M.  In the left-hand plot, earthquake belts delineate the plate boundaries. The right-hand plot is the geodensity plot of the same earthquake data set. © copyright remains with the author; all rights reserved, 2021.

 What makes the plates move?

The drivers for plate motion are the convection currents in the asthenosphere drag the lithosphere (basal drag) and the pull of the cooler lithosphere sinking into the asthenosphere at subduction zones (slab suction, gravity or slab pull).  Slab pull is considered to be the largest driver of plate motions.  However, as you will see from the plots below, neither the North American Plate nor the Eurasian Plates have active subductions zones so another mechanism is needed. Super plumes of deeper mantle material may drive larger convection currents.  Surge tectonics developed later suggests that the mantle flows in channels beneath the lithosphere which provide basal friction. 

Reykjanes Peninsula – update

The Reykjanes Peninsula straddles the Mid-Atlantic Ridge. Here, the plate boundary consists is a transform margin, made up of a transform fault and localised rifting. At the time of writing, a large earthquake swarm is occurring. We have now added plots of the current rifting / dike formation event to our previous post (“Seismic Activity on the Reykjanes Peninsula“) for earthquake data downloaded on 1 March 2021. IMO is in the process of updating week, 2021 .

The Armchair Volcanologist

© copyright remains with the author; all rights reserved, 2021.

Sources and Further Reading

Plots are the author’s own work.

Earthquake raw data downloaded from USGS earthquake search:

“Global Tectonics – Third Edition”, Philip Kearey, Keith A. Klepeis & Frederick J. Vine, Wiley-Blackwell, 2009.

Mt. Pelée, La Soufrière St. Vincent And A Quick Tour Of The Plates Surrounding The Caribbean Plate

Good Morning!

On 4 December 2020 the alert level for Mt. Pelée was raised to yellow due to increasing seismicity above background levels; and, on 29 December 2020 the alert level for La Soufrière St. Vincent was raised to orange following an increase in seismic activity, changes seen in the lake and fumaroles and a new growing lava dome emerging in the summit crater.  

This led us to look into what drives volcanism in the area, notably the interaction of the Caribbean Plate with its surrounding plates.

Fig 1: Mt. Pelée on the left with St. Pierre, photo by Lee Siebert, 2002 (Smithsonian Institution); Soufrière St. Vincent on the right, photo by William Melson, 1972 (Smithsonian Institution).

Mt. Pelée is famous for destroying the town of Saint- Pierre and its inhabitants plus visitors – a total of 29,000 people – in a matter of minutes on the morning of 8 May 1902 in a pyroclastic flow during a VEI 4 eruption.  La Soufrière St. Vincent also erupted around the same time.  Both volcanoes are located in the Lesser Antilles on the Caribbean Plate. 

Mt. Pelée

Mt. Pelée is located on Martinique.  She is a 1,400m high stratovolcano located in the caldera of an earlier volcano; edifice failures have breached the south west section of the caldera. Her lava types are andesite, basaltic andesite, dacite and basalt, picro basalt.

54 Holocene eruptions are recorded by GVP. Her historic eruptions include 1792 (VEI 1), 1851 (VEI 2), 1902 (VEI 4) and 1929 (VEI 3).  Two lava domes were emplaced in the summit crater, l’Etang Sec, during the 1902 and 1929 eruptions. 

1902 Eruption

Prior to the 1902 eruption, Mt Pelée’s known eruptions had been mild.  Activity at the volcano started to ramp up gradually with fumaroles in the summit crater in 1889 to March 1902.  From 23 April 1902 phreatic activity cleared out old rock, starting with minor explosive activity. By 4 May 1902 ash was raining down on Saint- Pierre. On 5 May, 23 people were killed when near boiling water from the crater heated by rising magma overran a distillery in a lahar in the Rivière Blanche valley.

On 6 May 1902, new lava emerged creating a lava dome.  During 7 May 1902, small parts of the dome collapsed.  At 07:50 on 8 May 1902, explosions were heard and a large black cloud seen to emerge and flow down the volcano, engulfing Saint-Pierre and some of the ships in the harbour.  Most of the casualties were killed by hot gases and dust from the blast.  Several pyroclastic flows followed: on 20 May 1902 a second pyroclastic current swept over Saint-Pierre destroying several of the remaining buildings; the Rivière Blanche valley saw several PDCs over the ensuing months; and, Morne Rouge was destroyed and 2,000 people killed by a pyroclastic current on 30 August 1902.  During this activity a 300m lava spine emerged. After this eruptive activity continued until 1903. The lava spine has since been eroded.

Saint-Pierre had not been evacuated prior to 8 May 1902 for a couple of reasons: it was not known at the time that the volcano produced pyroclastic flows so the danger was not understood; and, an election was due on 11 May 1902, which politicians were keen should go ahead.  No evacuation order was given. 

When activity ramped up again prior to the 1929 eruption, people were evacuated in time.

La Soufrière St. Vincent

La Soufière St. Vincent can be found on St Vincent Island.  She is a 1,234m high stratovolcano with crater lake and lava domes.  The 1.6km wide summit crater is located on the south west edge of a 2.2km wide Somma crater; slope failure caused a breach in the Somma crater.  Her lava types are andesite, basaltic andesite and basalt, picro basalt.

22 Holocene eruptions are recorded by GVP. Her historic eruptions include 1718 (VEI 3), 1812 (VEI 4), 1902 (VEI 4), 1971 (VEI 0) and 1979 (VEI 3).  The 1902 eruption occurred on 6 May 1902, killing 1,680 people. The 1812 eruption produced a new crater, cutting through the summit crater.  1971 eruption extruded a lava dome in the summit crater, which erupted explosively in 1979 to be replaced by another dome. 

Tectonic Setting

As noted above, both Mt. Pelée and La Soufrière St. Vincent are located on the Caribbean Plate in the Lesser Antilles. The Caribbean Plate is thick oceanic crust located between the North American and South American Plates.  The northern boundary of the Caribbean Plate is a transform boundary with the North American plate, running from Central America to the Virgin Islands. The Gonâve microplate and Puerto Rico Trench form part of the northern boundary. At the eastern boundary, the South American Plate subducts under the Caribbean Plate in the Lesser Antilles. At the western boundary, the Cocos Plate subducts under the Caribbean Plate, forming the Central American Volcanic Arc.  The southern boundary with the South American plate is a complex, comprising a convergent margin with the Panama Plate, a subduction zone with the North Andes Plate and a transform boundary with the South American Plate.  The main plates velocities relative to the African Plate are noted below.

PlateDirectionVelocity
North American PlateWest25 mm per year
Cocos PlateNorth east67 mm per year
Caribbean PlateNorth west10 mm per year
Panama PlateNorth west19 mm per year
Coiba and Malpelo PlatesEast 
North Andes PlateNorth west23 mm per year
Nazca PlateNorth east40 -53 mm per year
South American PlateWest27 – 34 mm per year

The origins of the Caribbean Plate are debated.  There are two main theories which attempt to explain why the less dense but thicker crust of the plate overrides the Cocos and South American Plates. It may have evolved millions of years ago from the Caribbean large igneous province, formed at the Galapagos hotspot, drifting to its current location as the plates moved to accommodate the widening of the Atlantic Ocean.  Alternatively, it may have formed from an old hotspot in the Atlantic.  These theories are based on the relative motions of the plates.  The first theory works on the basis that the Caribbean Plate is moving eastward compared to the North and South American Plates, whereas the latter uses the actual westward motion of the Caribbean Plate.

Recent Seismicity

Yes, we’ve downloaded earthquakes for the region from USGS’s earthquake search, taking a larger area than the Caribbean Plate in order to pick up the subduction zones.  In this case, it was not really necessary as most subduction is beneath the Caribbean Plate, but it was fun to find several microplates in the process: the Gonâve, Panama, Coiba and Malpelo Plates.  The Malpelo Plate was first identified as late as 2017 by Tuo Zhang, Richard G Gordon et al of Rice University.

The coordinates selected were: 3.760°S, 107.051°W to 26.838°N, 48.867°W for earthquakes with magnitudes of 2.5 or more between 1 January 1975 and 5 January 2021.  This picked up 80,751 earthquakes.

Fig 2: Earthquakes plotted by the author using data downloaded from USGS (see sources below).  Green dots denote earthquakes with magnitude between 2.5 M and 4.5 M, yellow dots earthquakes between 4.5 M and 6.0 M, orange stars, earthquakes between 6.0 M and 7.0 M and red stars, earthquakes over 7.0 M.  Some volcanoes are shown, these are denoted by blue triangles. Mt. Pelée and Soufrière St.Vincent are shown as yellow triangles. © Copyright remains with the author; all rights reserved, 2021

From Figs 2, 3 and 4 below, we can see the plate boundaries and the subduction zones on the western and eastern margins of the Caribbean plate are well marked by earthquakes and volcanoes; the subduction of the Caribbean Plate under the North Andes Plate is also visible (lower centre of the depth plot); and, the Puerto Rico Trench is also tectonically very active.  The Puerto Rico Trench has produced some large earthquakes and tsunamis.

Fig 3 Scatter plot of earthquakes round the Caribbean plate: latitude v longitude on the left and a depth plat on the right.  Earthquake with magnitude less than 4.5 are not shown in the depth plot to reduce noise.  Colour key as before. © Copyright remains with the author; all rights reserved, 2021
Fig 4: Scatter plot of the earthquakes at the Puerto Rico Trench: latitude v longitude on the left and a depth plat on the right. Colour key as before. © Copyright remains with the author; all rights reserved, 2021

Fig 4 shows subduction of the North American Plate on the right of the depth plot.  But there is also a line of earthquakes on the left of the plot which appears to indicate another subduction zone.  Neither subduction zone here, despite being seismically active, has active volcanoes associated with it.  It’s possible that there is another microplate here, but this is conjecture on our part until we can find an explanation or confirmation.

If you are interested or concerned by the alert statuses of Mt Pelée and La Soufrière St Vincent, you can find more information at L’Observatoire Volcanologique et Seismologique de Martinique, the National Emergency Management Organisation (NEMO) or GVP.

Hope you enjoyed our little tour.  We will be looking in more detail at points of interest in the future.

The Armchair Volcanologist

© Copyright remains with the author; all rights reserved, 2021.

Sources & Further Reading

Raw earthquake data from USGS Earthquake Catalogue Search: https://earthquake.usgs.gov/earthquakes/search/

L’Observatoire Volcanologique et Seismologique de Martinique: http://www.ipgp.fr/fr/ovsm/lobservatoire-volcanologique-sismologique-de-martinique-ovsm-ipgp

National Emergency Management Organisation (NEMO): http://nemo.gov.lc/

The Smithsonian Institution’s Global Volcanism Program (GVP): https://volcano.si.edu/

Caribbean Plate – Wikipedia: https://en.wikipedia.org/wiki/Caribbean_Plate

Zhang, Tuo; Richard G. Gordon; Jay K. Mishra, and Chengzu Wang. 2017. The Malpelo Plate Hypothesis and implications for nonclosure of the Cocos-Nazca-Pacific plate motion circuit, 1. AGU Fall Meeting, New Orleans. Accessed 2018-06-06.

“Volcanoes”, Peter Francis and Clive Oppenheimer, Oxford University Press, Second Edition, 2004.

La Soufrière (volcano) – Wikipedia: https://en.wikipedia.org/wiki/La_Soufrière_(volcano)

An Introduction to the Aleutian Arc

Good Morning!

Today we are looking at plate tectonics, giving a brief introduction to the Aleutian Arc, which marks the boundary between the North American Plate and the Pacific Plate. The Arc is both seismically and volcanically active. Volcanic activity is of interest because the Arc lies under very busy North American and Asian aviation routes .

Fig 1: The Aleutian Arc.  Map base from Google Maps.  Names of some geological features added by the author.

The Pacific Plate is moving north westward at a rate of 59mm per year in the north east and 92mm per year in the north west. It subducts orthogonally under the North American Plate on its north-eastern margin, obliquely further westward, and parallel to the North American plate at the transform boundary on its north-western margin.  The subduction zone comprises the island arc, the Aleutian Trench, and distinct Wadati-Beniof zones, which extend down to around to between 100 km and 250 km. 

The Aleutian Arc is 3,000 km long from the junction with the Fairweather Fault (an extension of the Queen Charlotte Fault) in the east to the triple junction of the Ulakahan Fault, Aleutian Trench and Kuril-Kamchatka Trench in the west.  The arc includes a 2,500 km long chain of basaltic andesitic stratovolcanoes and calderas.  Behind the arc are basaltic lava fields in the Bering Sea. Most volcanoes are in uninhabited or sparsely populated areas so they pose more of a risk to aviation.

Origins of the Aleutian Arc

In the early Cenozoic, 60 million years ago, the Farallon Plate and Kula Plates covered what is now the northern Pacific Ocean; the Kula Plate moved northwards, while the Farallon Plate moved eastwards.  There were active continental margins: in the north west there was in island arc; and, in the north east there was subduction of oceanic crust beneath the Bering Shelf volcanic belt.  The Kula-Pacific Transform Fracture Zone may have separated the north west Pacific from the north east. 

In the middle of the Eocene (50 million years ago to 47 million years ago) the movement of the Pacific Ocean plates changed from the NNW subduction of the Kula Plate, followed by ridge subduction, to the NW subduction of the Pacific Plate. This change in motion resulted in the formation of the Aleutian Arc and its back-arc basin in the Bering Sea. The Shirshov Ridge and Bowers Ridge originated from the ongoing displacement of the North American Plate in relation to the Eurasian Plate in the mid Eocene.  Subduction beneath the Kamchatka margin is associated with the late Cenozoic. The Komandorsky Basin formed in the Miocene.

The oblique subduction of the Pacific Plate towards the centre of the Aleutian Arc has caused clock-wise rotation of island arc blocks and breaches in the island chain, notably at the Near, Buldir, Amchitka and Amukta Straits.  This motion moved the Komandorsky block from its location at the subduction zone near the junction with the Bowers Ridge to its current location at the transform boundary; Eocene volcanicsnin the block ceased after its movement away from the subduction zone.  Recent tomographic studies have shown a possible slab under the Bering Sea that may be a remnant of the Kula Plate.

Recent Seismicity

The current Aleutian Arc is seismically very active; it has produced several large earthquakes with magnitudes in excess of 7.0M.

We looked at the earthquakes between 1 January 1975 to 30 November 2020 with a magnitude greater than 4.5M from 47.04°N, 142.559°W to 66.548°N, 198.984°W downloaded from USGS Earthquake search (see Sources below).  This includes the triple junction at the west of the Arc and the junction with the Fairweather Fault in the east, and the Bering Sea.  It also picks up some of the subduction zone to the west at the northern end of the Kuril-Kamchatka Trench.  We also identified seismic swarms in the period; for this purpose, swarms are defined here as more than 30 earthquakes per day (normally there are less than 10 per day).

Fig 2a:  Plot by the author of earthquakes with magnitude greater than 4.5 from 47.04°N, 142.559°W to 66.548°N, 198.984°W downloaded from USGS Earthquake search.  Coloured dots indicate the seismic swarms identified; gold stars denote earthquakes greater than 6.0M and red stars denote earthquakes greater than 7.0M. Black triangles denote Holocene volcanoes.  © Copyright remains with the author; all rights reserved, 2020.
Fig 2b:  Geodensity plot by the author of earthquakes with magnitude greater than 4.5 from 47.04°N, 142.559°W to 66.548°N, 198.984°W downloaded from USGS Earthquake search.  Black triangles denote Holocene volcanoes.  © Copyright remains with the author; all rights reserved, 2020.

Figs 2a and 2b show that most of the action is at the southern section of the Arc where the subduction of the Pacific Plate changes from orthogonal to oblique.  The geoscatter plot shows that most of the swarms are occurring here, confirmed by the geodensity plot.  There is very little seismic activity behind the arc, except for a swarm in Kamchatka north of the arc. 

Earthquakes with magnitudes greater than 7.0M occur round the arc, with the exception of the region near the Fox Islands; the lack of earthquakes here greater than 7.0M may be due to the nature of the crust, or, the comparatively short time period selected (45 years is a short time in geological terms).

If we look closer at sections of the arc (see figs 3a to 3e below), we can see that that earthquakes tend to follow a block pattern with gaps in between; the gaps may be gaps between crustal blocks or they may be areas likely to have swarms in the future.  We can also see the well-defined Wadati-Benioff Zones which extend to a depth of 250 km in the Eastern and Central Blocks (blocks here are the sections of the arc that we have selected to plot and are not intended to represent crustal blocks).

Fig 3a: Plot by the author of the earthquakes over 4.5 M between 1 January 1975 and 30 November 2020 on the Eastern Aleutian Arc between 54.00°N, 203.75°E and 66.0°N, 214.45°E.  This shows the Wadati-Beniof Zone and also the complexity of the junction between the Arc and the fault systems of Alaska and northern Canada.  Green dots denote earthquakes ≤ 6.0. yellow dots, earthquakes between 6.0 and 7.0, red stars, earthquakes > 7.0M, and blue triangles, Holocene volcanoes. © Copyright remains with the author, all rights reserved, 2020.
Fig 3b: Plot by the author of the earthquakes over 4.5 M between 1 January 1975 and 30 November 2020 on the Central Aleutian Arc between 52.00°N, 193.75°E and 59.0°N, 203.75°E.  This shows the Wadati-Beniof Zone.  Green dots denote earthquakes ≤ 6.0. yellow dots, earthquakes between 6.0 and 7.0, red stars, earthquakes > 7.0M, and blue triangles, Holocene volcanoes. © Copyright remains with the author, all rights reserved, 2020.
Fig 3c: Plot by the author of the earthquakes over 4.5 M between 1 January 1975 and 30 November 2020 on the Central Aleutian Arc between 50.00°N, 187.55°E and 55.0°N, 193.75°E.  This shows the Wadati-Beniof Zone.  Green dots denote earthquakes ≤ 6.0. yellow dots, earthquakes between 6.0 and 7.0, red stars, earthquakes > 7.0M, and blue triangles, Holocene volcanoes. © Copyright remains with the author, all rights reserved, 2020.
Fig 3d: Plot by the author of the earthquakes over 4.5 M between 1 January 1975 and 30 November 2020 on the Central Aleutian Arc between 49.5°N, 174.0°E and 54.0°N, 188.0°E.  This shows the Wadati-Beniof Zone.  Green dots denote earthquakes ≤ 6.0. yellow dots, earthquakes between 6.0 and 7.0, red stars, earthquakes > 7.0M, and blue triangles, Holocene volcanoes. © Copyright remains with the author, all rights reserved, 2020.
Fig 3e: Plot by the author of the earthquakes over 4.5 M between 1 January 1975 and 30 November 2020 on the Western Aleutian Arc between 48.00°N, 161.02°E and 60.0°N, 174.0°E.  This shows from west to east: the Wadati-Beniof Zone in the west at the Kuril-Kamchatka Trench, the transform zones and the edge of the subduction zone at the Aleutian Trench. Green dots denote earthquakes ≤ 6.0. yellow dots, earthquakes between 6.0 and 7.0, red stars, earthquakes > 7.0M, and blue triangles, Holocene volcanoes. © Copyright remains with the author, all rights reserved, 2020.

The lack of an active Wadati-Beniof Zone under the western segment of the Aleutian Arc explains why there is little current volcanism there.  Active volcanism in Kamchatka is south of the Aleutian arc, driven by the subduction of the Pacific Plate under the Okhotsk Plate.  There is some seismicity in Kamchatka, north of the Aleutian Arc; this does not appear to be connected to an active subduction zone, although looking at Google Maps there may be an old trench in the area.

Clearly, the western and eastern segments of the Aleutian Arc are complex junctions and deserve a closer look. We will examine this in more detail when we discuss volcanic activity.

Season’s Greetings

The Armchair Volcanologist.

19 December 2020

© Copyright remains with the author, all rights reserved, 2020.

Sources & Further Reading

Map base for Fig 1: Google Maps

Raw earthquake data from USGS Earthquake Catalogue Search: https://earthquake.usgs.gov/earthquakes/search/

The Aleutian Arc, Wikipedia: https://en.wikipedia.org/wiki/Aleutian_Arc

“Volcanoes of the World”, Third Edition, Lee Siebert, Tom Simkin, and Paul Kimberly, Smithsonian Institution, 2010, University of California Press

“Cenozoic Geodynamics of the Bering Sea Region”, V. D. Chekhovich, A. N. Sukhov, O. G. Sheremet, and, M. V. Kononov, Geotectonics, 2012, Vol. 46, No. 3, pp 212-231.

“Bowers Ridge (Bering Sea): An Oligocene – Early Miocene Island Arc”, Maren Wanke, Maxim Portnyagin, Kaj Hoernle, Reinhard Werner, Folkmar Hanff, Paul van den Bogaard, and Dieter Garbe-Schönber, Geology (2012) 40 (8): 687–690.

Krakatau, Sunda Strait, Indonesia: 1883 Eruption & 2018 Tsunami

Good Afternoon!

Krakatau’s VEI 6 eruption of 1883 is the next in our series of famous eruptions.  We have also included a summary of birth of Anak Krakatau from the caldera, and the December 2018 cone collapse and resulting tsunami.

The 1883 eruption is not only famous for the catastrophic destruction of Krakatau Island, pyroclastic flows, global cooling, devastating tsunamis and a death toll of between 36,164 to 120,000 people, but it is also the first major eruption to have been reported globally by telegraph. A typo in the telegraph led to the west calling the volcano Krakatoa.

The 2018 eruption, cone collapse and tsunami are well-documented by various sources. Our go-to resource here was primarily GVP.

Fig 1: Lithograph: Parker & Coward, Britain. 1888. Public Domain

Geological Setting

Katakatau lies to the west of the Sunda Strait between Sumatra and Java.  It is the site of a much larger 7 km wide caldera which may have been formed during eruptions in 416 AD or 535 AD.  The edges of the caldera are marked by Verlaten and Lang Islands.

Before the 1883 eruption, Krakatau was a 9 km long verdant, wooded island formed from three volcanoes, Rakata, Danan and Perbuwatan in the caldera.  Another small island in the group was Polish Hat.  The islands were uninhabited but used by local fishermen, woodcutters and the Dutch and British navies.

Fig 2: Map by ChrisDHDR showing Krakatau Island before the eruption and the site of Anak Krakatau, Public Domain

Eruptive History

GVP records 56 known Holocene eruptive periods for Krakatau, of which only 10 precede the 1883 eruption.  The evidence for the 10 is historical observations from 250 AD to 1684, so perhaps earlier activity has been lost under the debris from more recent events. Activity after 1883 relates to building of Anak Krakatau.

The 535 AD eruption of Krakatau may have caused the volcanic aerosol veil that dimmed the Sun (filtered out sunlight) for eighteen months, causing crop failures, cooling and hiding Canopus, a bright star used by Chinese astronomers to mark the seasons – more likely if the eruption was a large caldera forming event. The other contender (preferred by some) is the 408 AD – 536 AD Tierra Blanca Joven eruption of Ilopango, El Salvador. On the other hand, why exclude one? Both may have contributed in some way.

Krakatau’s lavas are typical of a subduction zone: andesite, basaltic andesite, dacite, trachyte and trachydacite; and, also basalt and picro basalt.  The last mentioned indicates that there may be more rapid magma ascent through extensional faulting in the area.

The 1883 Eruption: 100 Days of Activity

The Intro

The only known precursors to the 1883 eruptions are a large earthquake on 1 September 1880 followed by a period of increasing seismicity.  Unfortunately, the area is seismically very active, being near the convergent margin between the Sunda Plate and the descending Indo-Australian Plate so, without modern instrumentation, there was insufficient information to interpret escalating events.

On the 20 May 1883 eruptive activity started at the Perbuwatan crater with series of loud explosions audible 150 km away.  Light ashfall covered the area and a column of steam was visible.  Activity continued for a few days then calmed down enough for a party to charter a boat to the island on 27 May 1883; they were the only witnesses to the Perbuwatan crater, then about 1 km in diameter, 50 m deep, with a small pit generating a steam column and small explosions every 5 to 10 minutes.  By the end of June 1883, the summit of Perbuwatan had been destroyed and a second eruption column was visible at the centre of the island.

Captain Ferzenaar, a surveyor for the Dutch government, collecting ash samples on 11 August 1883, found a thick covering of tephra, all vegetation stripped bar a few tree trunks; three active eruption columns (one at Perbuwatan and the other two near the centre of the island); and, at least eleven other sites with some activity.  However, upwind of the eruption, he was unable to see more beyond the steam and ash.

The Cataclysmic Eruption

The main event occurred over 26 and 27 August 1883. There were very few survivors so it took while for Dutch investigators, led by Rogier D.M. Verbeek, a mining engineer and geologist, and British investigators from the Royal Society to reconstruct the events.  Their information came from various sources, including ships caught in the Sunda Strait, pressure gauges at the Batavia gasworks on Java, Dutch officials living in Batavia and Buitenzorg, and requests for information from the Royal Society for data further afield, including one printed in The Times.

Three days before 26 August, there had been a marked increase in activity on the island.  By 13: 00 on 26 August explosions were loud enough to be heard 150 km away.  By 14:00 a 25 km high black eruption column was visible.  By 17:00 activity was audible throughout Java and pumice was raining down on vessels in the Strait.  By 19:00 a Plinian eruption column with intense volcanic lightening was witnessed. Several ships were among those caught up in the eruption, one of which, the Charles Bal, trapped by poor visibility had to sail within sight of  the volcano to keep its bearings amid hot ash fall, volcanic gases, lightening and St Elmo’s Fires (static electricity which lit up the mastheads).

The eruption escalated on 27 August with large explosions at 05:30, 06:44, 10:02 and 10:52 in the morning (local time).  The noise from these woke people 3,224 km away in Australia; and, further away at a distance of 4,811 km, it was confused with gunfire.  Atmospheric pressure changes were detected globally.  These explosions generated a 40 km high Plinian eruption column that cut out the sun for up to two days in the vicinity; further away in Batavia, full loss of light lasted for just over an hour and a half.  There is some debate on what caused the large explosions, including the possibility of sea water reaching either the magma chamber or ascending hot magma.  

Pyroclastic density currents (PDCs) made it to southern Sumatra, killing 2,000 people. The inhabited islands of Sebesi and Sebuku between Krakatau and Sumatra were devastated, with no survivors. Hot ash from the PDCs burned people as far away as Kalimbang, Sumatra.

The tsunamis caused the most of the remaining fatalities (estimates of the total number of fatalities vary from c. 36,000 to 120,000).  A series of tsunamis devasted the shores of the Sunda Strait; waves reached a height of 25m on the coast of Sumatra and 40m on Java. The town of Anjer was washed away. The largest tsunami wave at Batavia was detected at 12:36 on 27 August.  The waves reached as far as Auckland, New Zealand.  The tsunamis may have been caused by displacement of large amounts of seawater from the rapid deposit of ash in the caldera form discrete explosions, collapse of the eruption columns or edifice collapse.  As you will see later, the edifice failure of Anak Krakatau in December 2018 caused a catastrophic tsunami.

The eruption calmed down after the four large explosions, with some outbreaks of minor activity, to be quiet after 28 August 1883.

The Immediate Aftermath

Two thirds of Krakatau Island had disappeared – either blown apart by the eruption or sunk as part of the creation of a 300m deep caldera; only the southern section of Rakata remained.  Pumice and a small rock were all that remained of the northern part of the island.   

20 km3 of dacite pyroclastic material had been erupted as tephra, pyroclastic density currents and the rest deposited into the sea and on surrounding islands.  Deposits enlarged Verlaten and Lang Islands and two new islands were formed: Steers and Calmeyer.  Polish Hat, however, had disappeared.  Steers and Calmeyer were later eroded by sea water.

The 40 km high eruption column had reached into the stratosphere, where ash was spread round the globe, initially in the tropics but then migrating northwards and southwards, lingering for a couple of weeks.  Aerosols filtered sunlight resulting in vivid sunsets; the sun is reported as appearing as green or blue, depending on its angle in the sky.  Filtering of the sunlight caused global cooling probably in the order of 0.34°C in 1884.

The Birth, Collapse and Regrowth of Anak Krakatau

Krakatau has remained active with over 40 eruptive episodes since the 1883 eruption. Anak Krakatau (Child of Krakatau) emerged in 1927 from the caldera and had reached a height of 338m by 2018, only to lose a large part of the new cone in December 2018 when a relatively small eruptive episode (VEI 3), which started in June 2018, caused edifice failure.  The edifice collapse was preceded by an eruption at 21:03.  Øystein Lund Andersen, a photographer, recorded that by 21:05 a dark plume obscured the volcano and earlier incandescence.  At 21:27 the first tsunami wave hit the shore, travelling 15m inland; at 21:31 a second much larger wave followed.

Two thirds of Anak Krakatau had been destroyed. The tsunamis killed 437 people, injured 31,943, displaced a further 16,198 and damaged 186 miles of the shore line in Sumatra and Java.  Ash and gases cleared Kecil Island and a large part of Anak Krakatau, itself, of vegetation.  

This edifice collapse had been predicted.  Volcanologists from the University of Oregon had noted in January 2012 that the cone, formed on a steep slope of the 1883 caldera, was vulnerable to edifice collapse, especially on the western side.

The eruptive activity has continued, initially underwater, producing Surtseyan activity.  Cone rebuilding is continuing with both submarine and subaerial activity.  Recently, there was a small magmatic eruption in April 2020, producing two ash columns that reached 14 km and 11 km height and lava fountains.

 Recent Seismicity

Volcanism in the area is driven by the subduction of the Indo-Australian Plate under the Sunda Plate.  The Sunda Strait is seismically very active, possibly because it is accommodating the change in direction between the northern and eastern arms of the plate boundary.  Krakatau, itself, lies in the bend of the Arc above the Wadati-Benioff zone. 

We looked at the earthquakes in the region 8.67°S 101.00°E to 3.94°S 110.09°E for the period 1971 to 14 July 2020; this area includes the southern end of Sumatra, the Sunda Strait and the western end of Java.  We downloaded the earthquake data from IRIS’s earthquake browser. The download comprised mostly earthquakes with magnitude over 4.0; smaller volcanic / tectonic earthquakes were not included in the data set.

Fig 3: Density plot and depth plot of earthquakes between 1971 and 14 July 2020 by the author.  Green dots denote earthquakes with magnitude below 4.5, yellow circles, earthquakes between 4.5 and 6.0 and red stars, earthquakes over 6.0. © Copyright remains with the author; all rights reserved, 2020.

Our plots show the subduction zone in the curve of the Sunda Volcanic Arc, with more intense seismic activity in the northern arm of the arc. The intense areas of activity in the northern arm starts in 2000, preceding the 2004 Banda Aceh earthquake, which is north of the area in our plot, and continuing for a few years afterwards.

The Armchair Volcanologist

7 August 2020

© Copyright remains with the author; all rights reserved, 2020.

Sources and Further Research

“Volcanoes”, Second edition, Peter Francis and Clive Oppenheimer, Oxford University Press, 2004

“Volcanoes, Earthquakes and Tsunamis”, David Rothery, Teach Yourself, 2010

Smithsonian Institution Global Volcanism Program, Krakatau: https://volcano.si.edu/volcano.cfm?vn=262000

 Krakatoa, Wikipedia https://en.wikipedia.org/wiki/Krakatoa

Anak Krakatoa, Wikipedia https://en.wikipedia.org/wiki/Anak_Krakatoa

Raw earthquake data downloaded from IRIS http://ds.iris.edu/ieb/

Earthquake plots are the author’s own.

The Magic of Magma

Good Afternoon!

Magma is the molten source of many of the rocks at the Earth’s surface; the others come from meteorites or other terrestrial processes.  Here, we look at how magma is generated and how it affects volcanic eruptions.   This is a long one; you may want to dip into it as a reference rather than read it all in one go, but bear with me.

Fig 1: Holuhraun on 4 September 2014 by peterhartree.  Published under CC BY-SA 2.0. Note the fire fountains, effusive lava flows and gas emissions.

There are several different types of volcanic eruption, varying from effusive to explosive.  The type is determined by the magma composition- both its silica content and its volatile (gas) content.

How is magma generated?

From our earlier post, we know that the heat required to generate magma comes from nuclear reactions at the Earth’s core.  This heat makes its way to the surface via conduction, convection and radiation.  The surface rocks are cold enough to be solid.  However, we saw that the heat from the core drives plate tectonics; it is the variations in temperature and pressure caused by plate motion, combined with changes in rock composition, that create the conditions for rocks to melt and create magma.

Effusive Continental Rifts / Ocean Ridges

Effusive eruptions (think Hawaiian eruptions such as Kilauea) tend to occur at rifts or fissures, cracks in the Earth’s crust that let magma reach the surface relatively quickly and allow gases to escape gently.  Such fissures are common at constructive plate boundaries (continental rifts or mid ocean ridges), caused by plate separation.  Magma is generated in a process called decompression melting; as the plates move apart the overlying pressure is reduced, which in turn reduces the melting temperature of the mantle.  Because magma ascends relatively rapidly there is less time for it to mix with other magma or the crust.  This magma tends to be basic basalt. 

Magma ascent at ocean ridge
Fig 2:  Magma ascending at a Mid Ocean Ridge by the author after the many examples available.  Arrows denote plate motion.  Not to scale. © All rights reserved, 2020.

More Explosive Subduction Zones

Magma may also be generated at what is called subduction zones.  Subduction zones occur where plates meet: a denser oceanic lithosphere descends beneath either a less dense continental lithosphere or other oceanic lithosphere. These zones were discovered by two scientists independently researching earthquakes, Hugo Benioff and Kiyoo Wadati. Earthquake foci delineate the descending slab; this zone may be referred to as the Wadati-Benioff zone.   Magma is created from the descending slab by a process called hydration melting: as the slab descends water is squeezed out which mixes with the overlying asthenosphere, lowering its melting temperature.  Hydration melting occurs between 50 km to 200 km, with volcanoes accumulating at around 70 km above the descending slab.  

Magma mixes with the asthenosphere and the crust which increases its silica content. Partial melting of the mantle results in basalts (<52% silica); partial melting of the descending ocean crust provides andesites (52% to 65% silica); and, partial melting of the continental crust gives rhyolites (> 65% silica).  Increasing the silica content of the magma increases its viscosity and the explosivity of eruptions.

These plate boundaries are called destructive boundaries; it is believed that the descending plate is destroyed in the process. 

Fig 3:  Magma generation at a subduction zone by the author, after the many sources available.  Large arrow denotes plate motion; stars, the site of hydration melting; and, the smaller arrow, magma ascent.  The accretionary wedge is rock scraped off as the plates meet. Earthquake foci, not shown, would indicate the path of the descending plate. Not to scale. © All rights reserved, 2020.

Obduction

There is another process where plates meet called obduction; one plate rides over the other.  It is mentioned because obduction revealed the origins of oceanic crust.  Ophiolites, the remnants of old oceanic crust, show that this crust is made up of peridotites from the mantle overlain by old magma chambers, sheet dyke complexes, pillow lavas and sediments.  The magma was sourced from partial melting of the peridotite.  Sheet dyke complexes are complexes of vertical magma intrusions where magma has filled gaps caused by extension from plate separation.  Pillow lavas occur when basalt is erupted underwater.

Magma Evolution

We know that not all magma is basic basalt: there are others, including andesite and rhyolite.  These are formed from basalt by a process called magma evolution.

Magma rises slowly under its natural buoyancy, being around 10% less dense than the surrounding rock.  It tends to accumulate in magma chambers / reservoirs at depths of around 5 km to 20 km below the volcano.  Magma evolves by one or more of the following:

  • Magma mixing: one batch of magma mixes with another in the magma reservoir;
  • Assimilation: the rising magma collects surrounding rock during its ascent;
  • Fractional crystallisation: as magma rises, it cools, which causes the components with higher melting points to crystallise out.

Evolution tends to increase the silicate content of the magma and increase its viscosity; the higher the viscosity, the slower magma moves.

The table below shows a comparison of rock and magma compositions for some its key elements.  The convention for magma composition is based on the oxide equivalents of the elements, presumably on the basis that oxygen does not occur on its own in rock. 

Fig 4:  Comparison of key elements in the composition of different magmas by the author after various sources.  © All rights reserved, 2020.

So how does magma get to the surface?

The short answer is plate tectonics. Distortions in the crust from plate motion either squeeze magma out via existing or new fractures, or provide a wide enough pathway for the magma to ascend.  This is why we see so many volcanoes around plate boundaries.

Eruption Style

Magma contains dissolved gases (e.g. water, carbon dioxide, sulphur, and halogens: chlorine and fluorine).  When the constraining pressure decreases, the gases are released from solution: e.g. carbon dioxide exsolves at depths of several kilometres and sulphur at around 1 km.   This is a process called degassing (think of carbon dioxide released from a fizzy drink when the cap is loosened.) These gases may be held in the magma as bubbles or it may escape via fractures in the crust to the surface.  Measuring gas emissions around volcanoes indicates whether or not new magma is close to the surface.  We have seen with Grímsvötn that Icelandic scientists have reported the presence of sulphur dioxide near the caldera rim, indicating that Grímsvötn may be heading for a new eruption.

Effusive eruptions tend to occur with the less viscous basaltic magmas from which gases can escape gently.  More explosive eruptions are caused when the gases are trapped in more viscous magma and accumulate either as foam or as bubbles; it is their rapid expansion causes an explosive eruption. If a degassing event is large enough, less viscous magmas may also produce explosive eruptions.

When gas bubbles coalesce and expand, large bubbles form which rise with the magma.  If the magma reaches the vent, the bubbles explode with the reduction in constraining pressure, throwing out chunks of lava and ash; some of the chunks can be large boulders.  If gas bubbles get trapped in the magma chamber, when the accumulated pressure is high enough, the gas is forced out as a jet strong enough to cause fire fountains from less viscous basaltic magmas or ash / shards from fractured more viscous magma.  Fire fountains are / were visible in some of Etna’s eruption, in the 2014 eruption at Holuhraun or in the 1783 eruption of Laki. Famous explosive eruptions include Pinatubo, 1991, Krakatau, 1883, and Vesuvius, 79AD,

Impact of ground water or ice

We have seen explosive eruptions from some of Iceland’s basaltic volcanoes.  Another source of volatiles is ground water (aquifers) or glaciers.  When magma gets close enough to these, the heat from the magma flashes the water to steam; the rapid expansion of the water / steam results in an explosive eruption.  If only old rock is involved, the eruption is referred to as phreatic; if new magma is involved, the eruption is referred to as phreatomagmatic.  Phreatic eruptions may be a vehicle to clear the vent / provide a pathway for new magma to reach the surface. Recent phreatic eruptions include White Island, 2019, Mount Ontake, 2014; both caused loss of life because of the unpredictable nature of this eruption type.

Future Topics

There is another important process for magma that we have not touched here: mantle plumes.  We will look at this later.

We will also look in more detail the various locations for volcanoes, including the earthquake foci plots that indicate activity (usually tectonic).  Our Icelandic posts show the influence of the Mid Atlantic Ridge; others will look at subduction zones.

We may get diverted / distracted on the way to look at current events of interest.  (Probably, no “may” about it 😉 ).

Thank you for staying with me,

The Armchair Volcanologist

1 July 2020

© Copyright remains with the author; all rights reserved, 2020

Sources and Further Reading

“Volcanoes, Earthquakes and Tsunamis”, David A. Rothery, “Teach Yourself”, 2010

“Volcanoes”, Peter Francis, Clive Oppenheimer, Oxford University Press, 2004

“Volcanoes Global Perspectives”, John P. Lockwood and Richard W. Hazlett, Wiley-Blackwell, 2010

“Wadati-Benioff zone”, Wikipedia: https://en.wikipedia.org/wiki/Wadati%E2%80%93Benioff_zone

“Igneous rock”, Wikipedia: https://en.wikipedia.org/wiki/Igneous_rock

“Magma”, Wikipedia: https://en.wikipedia.org/wiki/Magma