An amateur volcanology enthusiast with an interest in volcanic and seismic activities, viewed from the comfort and safety of my armchair.
Meandered into this from using publicly available earthquake data to improve my Excel modelling skills. Then had to research the results both to understand and verify them. :)
Today, we are looking at the earthquake plots for the Reykjanes Peninsula since the 16th July 2025 eruption on the Sundhnúkur crater row.
The Icelandic Met Office (IMO) are reporting that ground deformation and magma accumulation has continued under Svartsengi on the Reykjanes Peninsula, Iceland, since the 16th July 2025 eruption on the Sundhnúkur crater row. To date the cumulative uplift is just over 25cm and the estimated volume of magma accumulated is in the region of 26 million cubic metres. IMO conclude that the most likely outcome is another eruption on the Sundhnúkur crater row. Their updates can be found here: Ground uplift and magma accumulation continue beneath Svartsengi | News | Icelandic Meteorological office .
We started by plotting the earthquakes for the Reykjanes Peninsula from 16th July 2025 to 10th May 2026 for the area between 63.7°N, 23.0°W to 64.4°N, 21.0°W. This is followed by a closer look at the area covering Svartsengi and Krýsuvík.
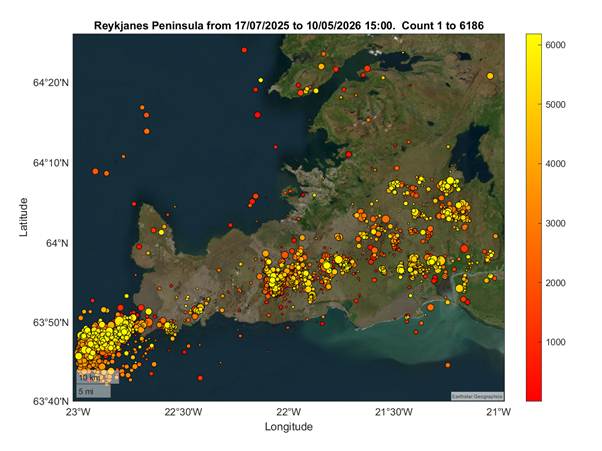
Reykjanes Peninsula, 17th July 2025 to 10th May 2026
We downloaded publicly available earthquake data from Skjálftalísa for the area above; a total of 6,186 earthquakes. Our data set includes automatically recorded earthquakes which have not been reviewed so there is less certainty about their location, especially where have been earthquake swarms.
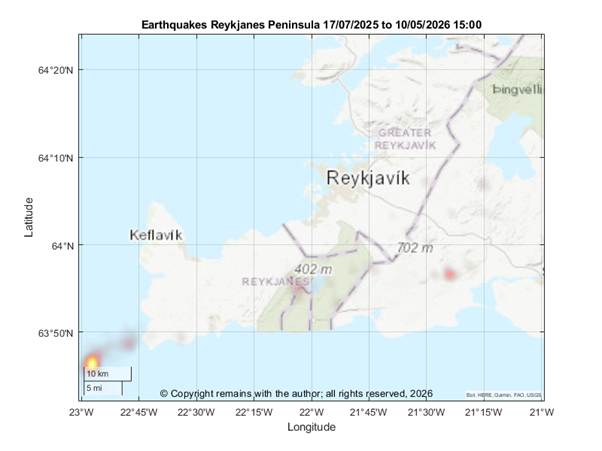
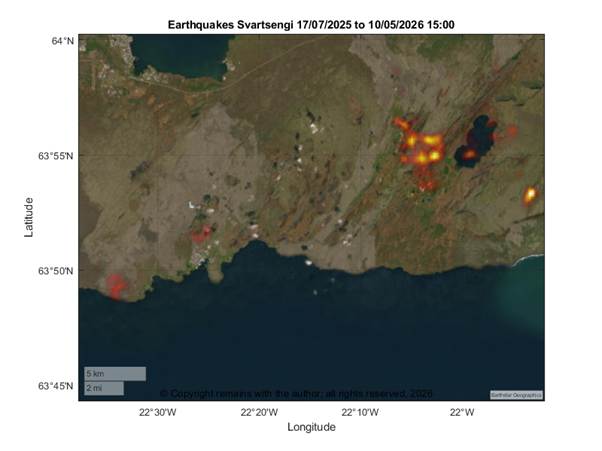
A geodensity plot of the same data set shows that activity is focussed on Eldey out on the Reykjanes Ridge, an area to the west of Hveragerdi near Raufarhólshellir, Krýsuvík and, harder to see, Svartsengi and an area to the west of Grindavík. We had to change the background to improve visibility.
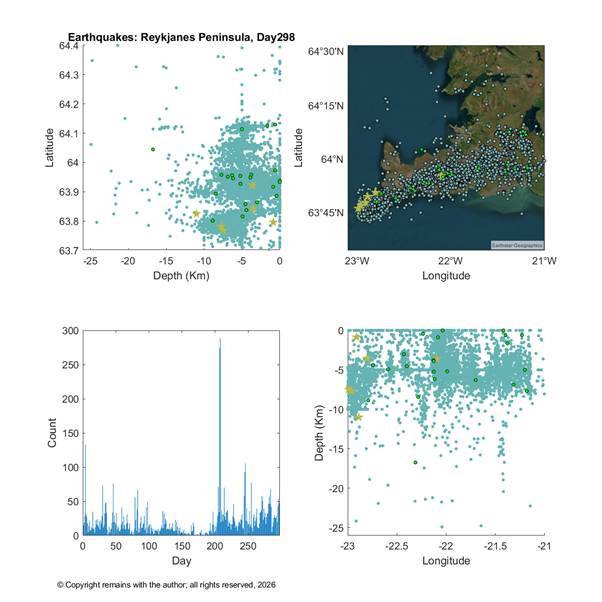
To see what is going on below the surface, we plotted the earthquakes latitude v depth, count per day and depth v longitude; the geoscatter plot is shown for reference.
Most earthquake activity is occurring in the crust. There would appear to magma doming under the western end of the Reykjanes Peninsula. It is less clear what is going on to the east of this and also further west, but, as most activity is in the crust, we feel that this most likely faults moving to accommodate the uplift under Svartsengi. Whether the activity at Krýsuvík or Eldey is enough to permit magma ascent in the future remains to be seen, but, at the time of writing, they are showing little ground deformation.
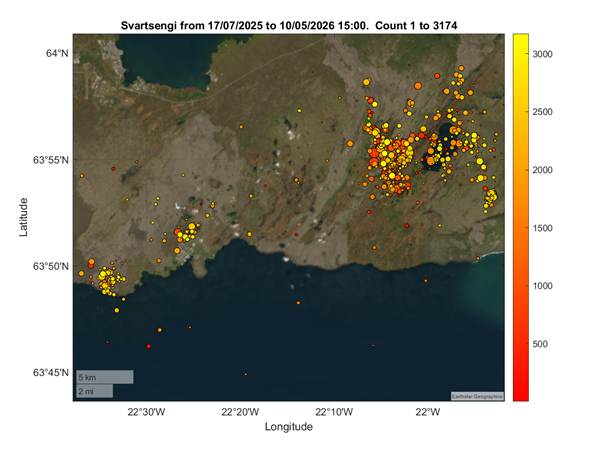
Svartsengi, 17th July 2025 to 10th May 2026
We plotted the area 63.746°N, 22.631°W to 63.996°N, 21.864°W; this covers both the Svartsengi and Krýsuvík regions from the above data set; a total of 3,174 earthquakes.
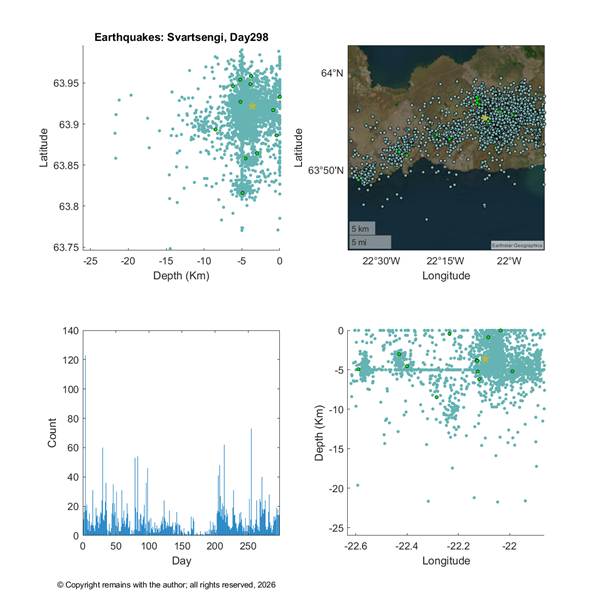
To see what is going on below the surface again, we plotted the earthquakes latitude v depth, count per day and depth v longitude; the geoscatter plot is shown for reference.
Due to the low level of seismic activity in the Svartsengi area, our plots do not add much more than the plots of the Reykjanes Peninsula at the moment in terms of predicting what will happen next. Time will tell when and where the next eruption occurs.
We hope you find the plots useful.
For up to date information and advice, please visit the Icelandic Met Office site: https://en.vedur.is/
After a long period of absence to care for a sick relative, we are back.
A lot has happened in the interim in terms of volcanic and seismic activity globally. So a lot of catching up to do.
We are starting by looking at Iceland. The Icelandic Met Office (IMO) (https://en.vedur.is/) has changed its earthquake monitoring system from its SIL system to SeisComP to make monitoring easier. In the process they have updated Skjálftalísa (https://skjalftalisa.vedur.is/) which we use to download earthquake data. This makes it easier to select data. It also has a 3D plotting capability for those who do not have the time or software to be able to do it themselves. Our thanks to IMO.
Our new post on the seismic activity on the Reykjanes Peninsula will be up shortly.
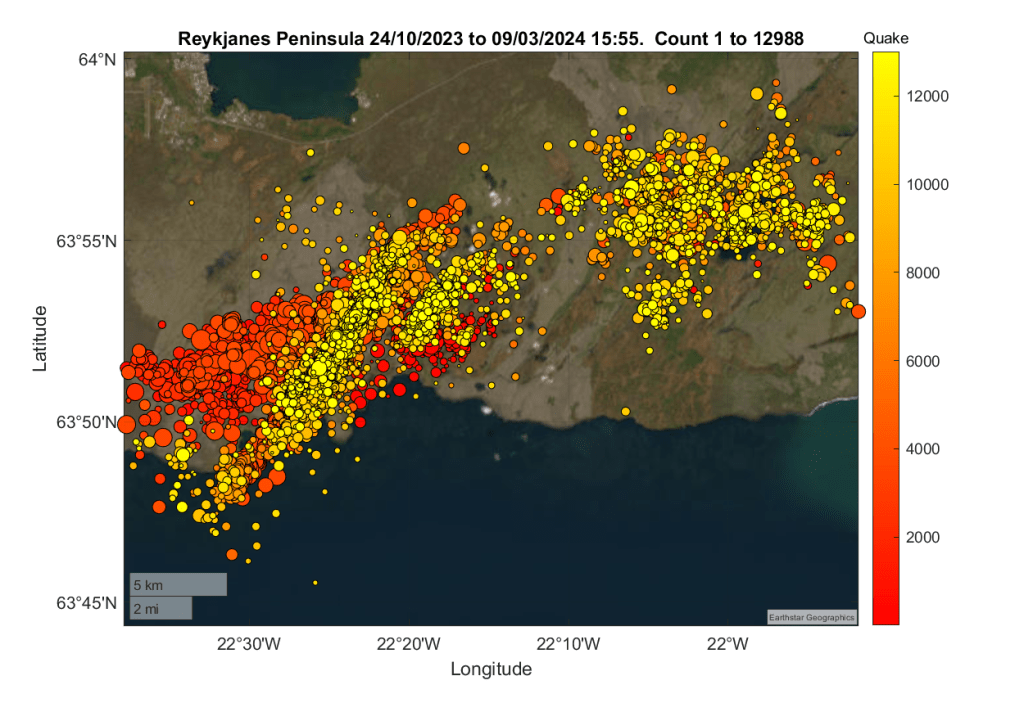
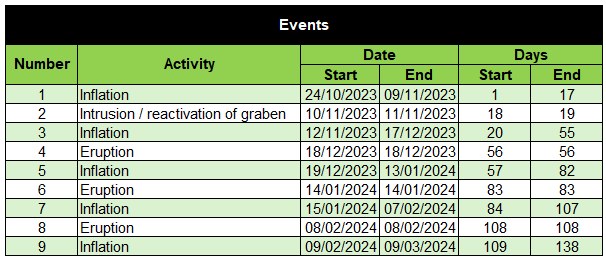
While waiting to see where and when the next eruption on the Reykjanes Peninsula occurs, we have updated our earthquake plots for the area between 63.746°N, 22.631°W and 63.996°N, 21.864°W from 24th October 2023 to 9th March 2024 – a total of 12,988 earthquakes. We have extended the area plotted to include Krýsuvík.
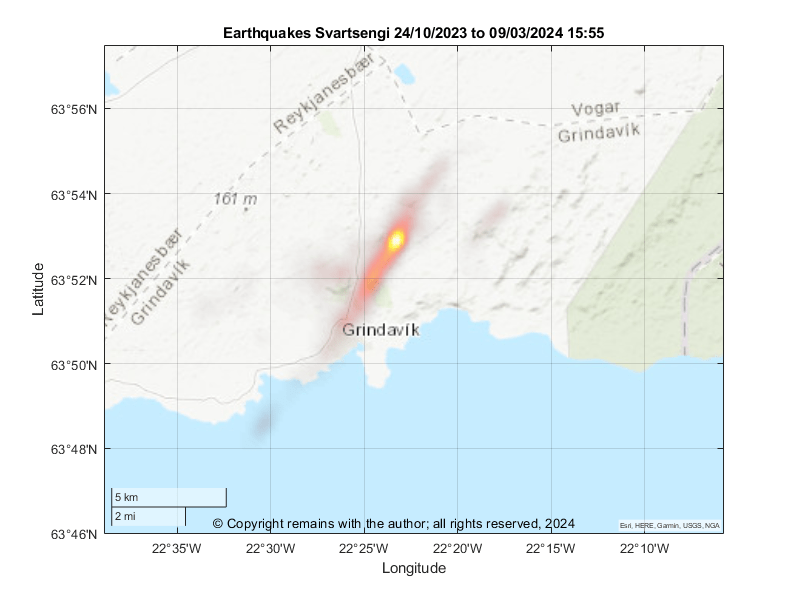
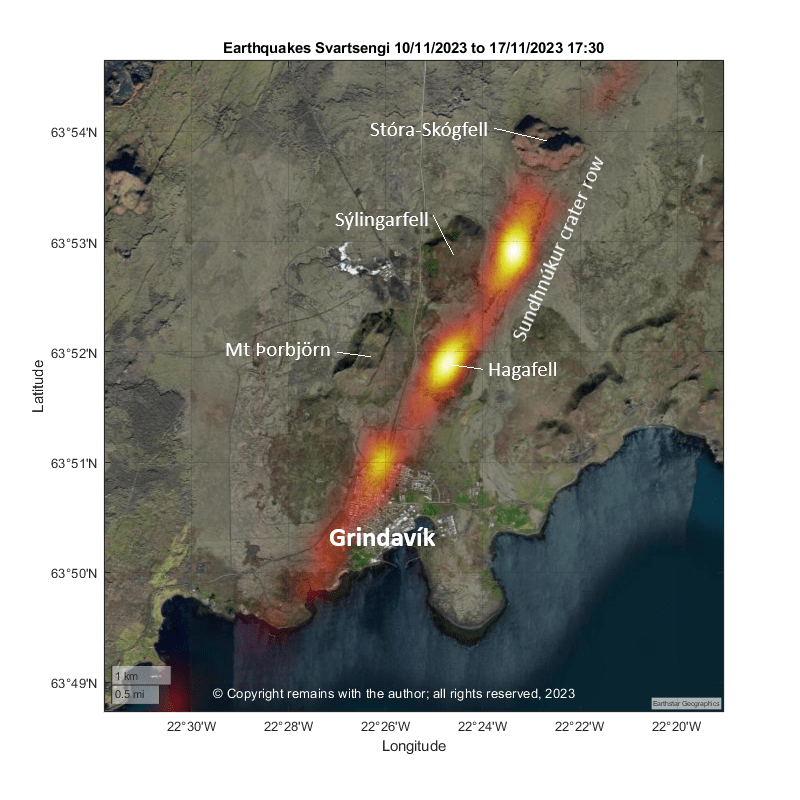
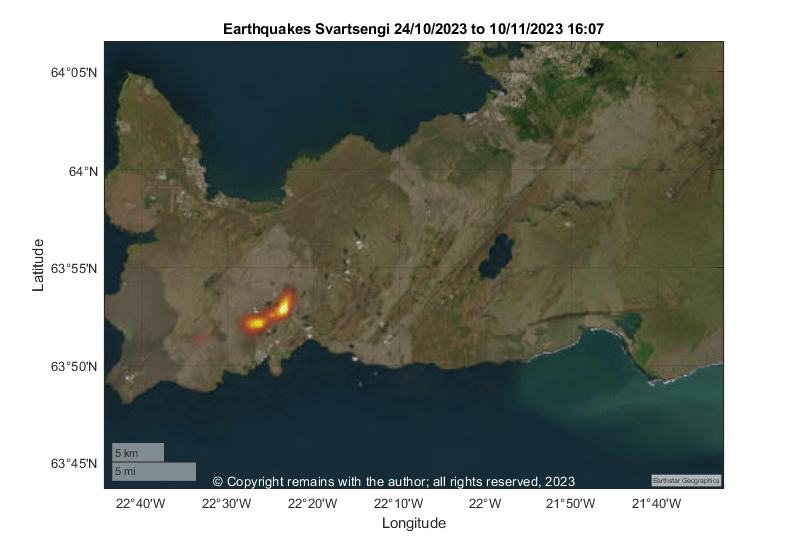
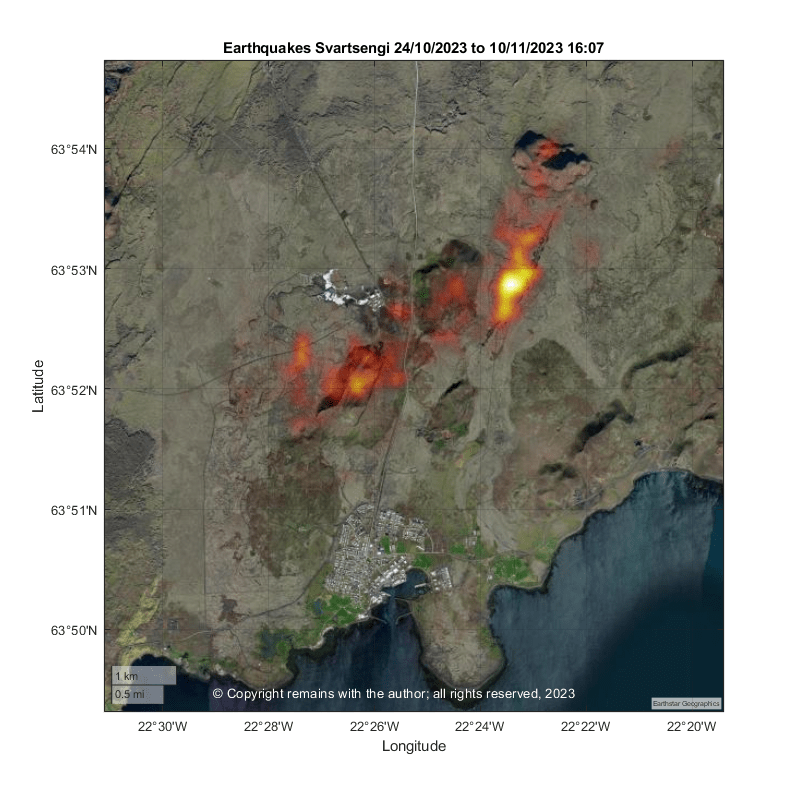
First, we start with the geodensity plot for the period 24th October 2023 to 9th March 2024. Most activity is still occurring on the magma intrusion / graben between Hagafell and Stóra-Skógafell. The earthquake density plots for the entire period also picks up some activity southwest of Grindavík, west of Fagradalsfjall and at Mount Þorbjörn. This shows best on a topographic map with a lighter background.
Next, we look at the geoscatter plot for the same area and period. This shows the activity along the magma intrusion / graben, that west of Fagradalsfjall, and, also, an upkick in activity in the Krýsuvík area. The last may be local faults accommodating the uplift at Svartsengi. Whether or not this lets magma ascend in the Krýsuvík volcanic system, itself, remains to be seen. At the time of writing, the alert level for Krýsuvík is unchanged at green.
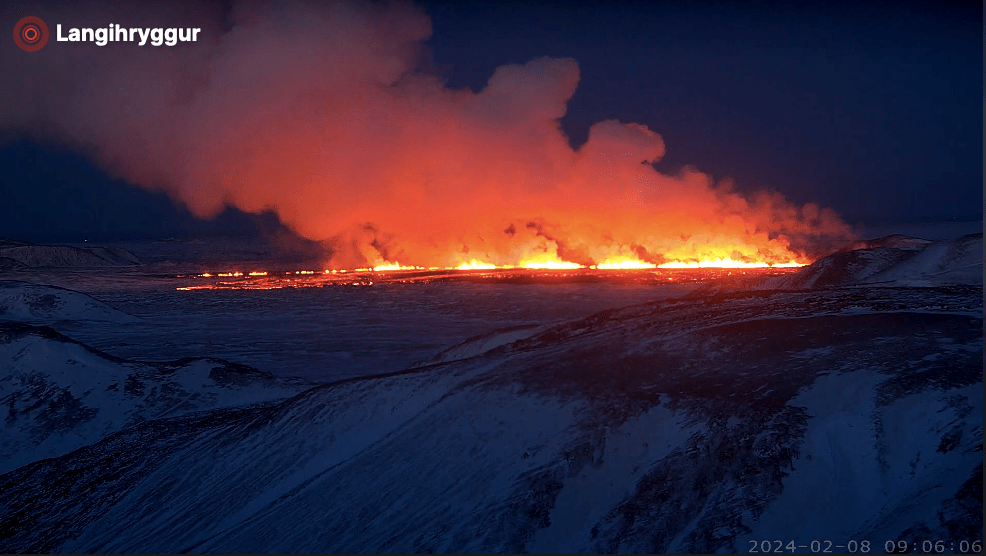
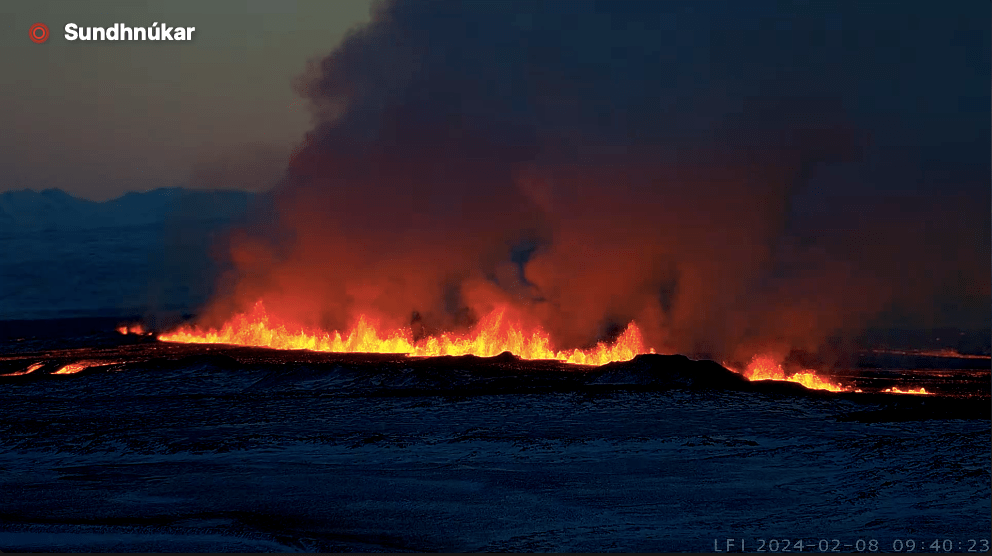
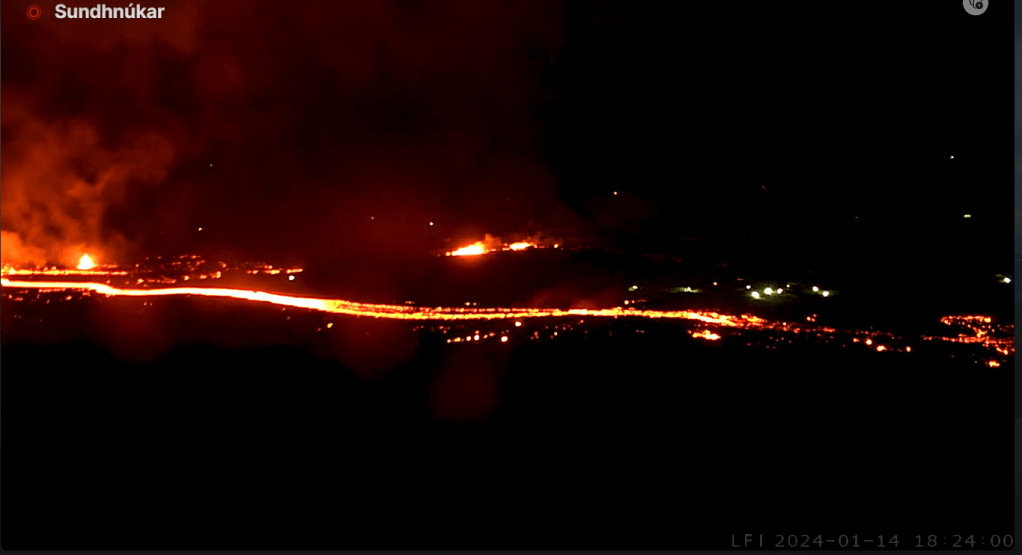
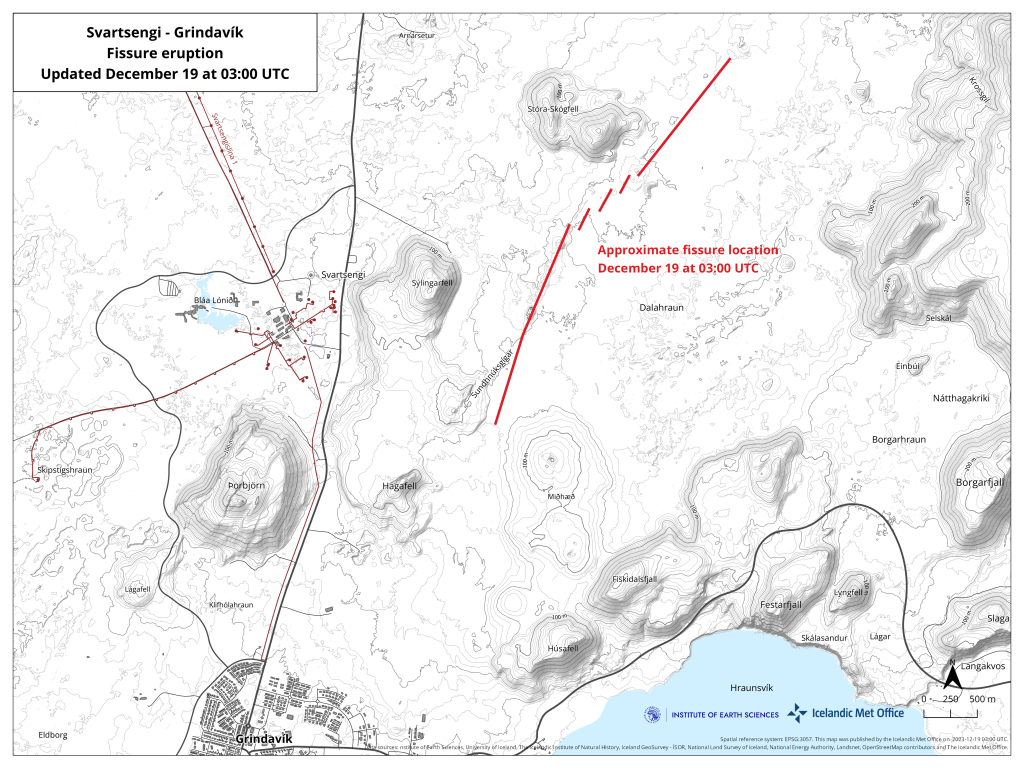
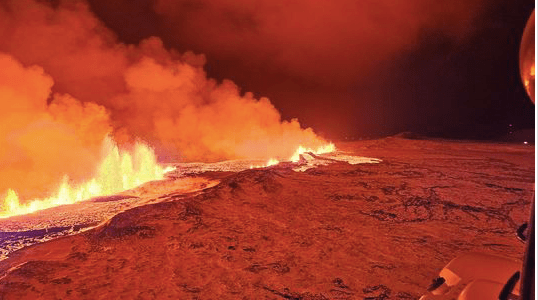
The eruption start early this morning at 6am with a 3km long fissure near to the location of the 18th December 2023 eruption. Lava is flowing westwards.
At the time of writing there is no immediate threat to Grindavík the Blue Lagoon or Svartsengi Power Plant. No-one is thought to have been in Grindavík when the eruption started; the Blue Lagoon was evacuated successfully. It will be some time before lava may reach the protective walls round Grindavík.
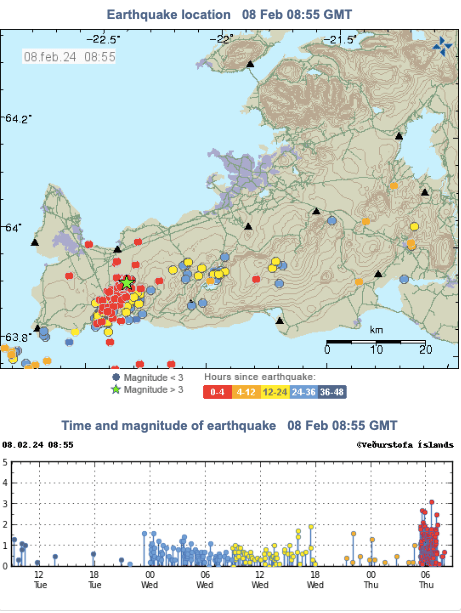
The eruption started with little notice. The precursors were an earthquake swarm which started 30 minutes before at 5:30 am and around ten minutes later pressure changes in bore holes at the power plant were noted.
The eruptive mechanism is similar to the two previous eruptions. Magma flows into the channel and then erupts with jets of lava. Lava fountains are currently reaching 80m height and the plume rises to 3km.
Inflation has been continuous at Svarsengi since the December 18th eruption. It is too soon to see what effect thus eruption has had on local ground deformation.
There are no signs of eruptive activity, however, inflation still continues at Svartsengi.
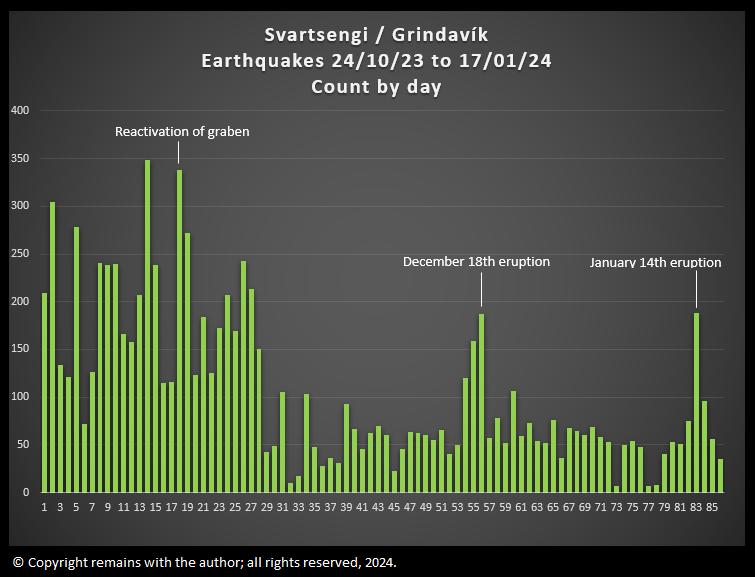
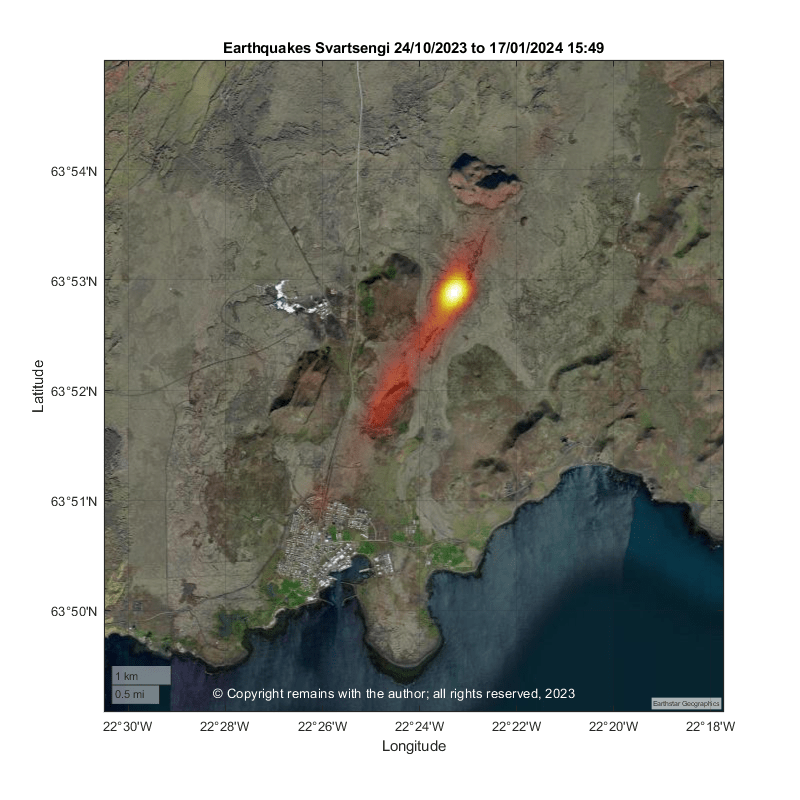
We have updated our earthquake plots to 17th January 15:49. The geodensity plot shows an increase in density south westwards from the hotspot. The geoscatter plots (latitude v longitude) show the development of seismic activity near Fagradalsfjall after the December eruption in addition to activity at Svartsengi / Grindavík.
We recommend that you watch the videos on YouTube rather than here; you can adjust the size and speed more easily there.
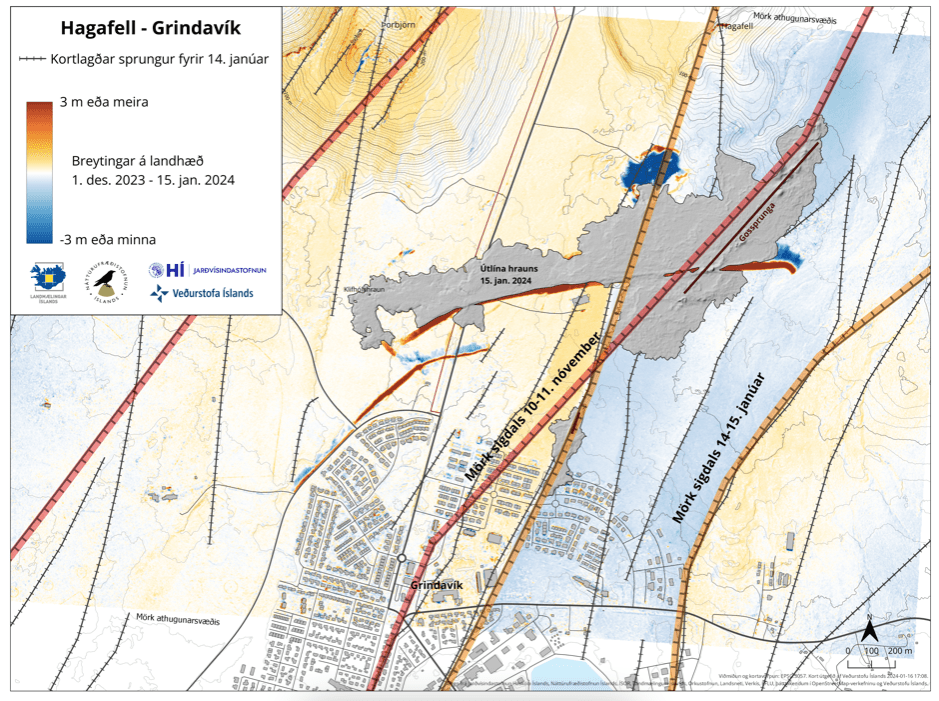
IMO are reporting that a new graben has formed to the east of the graben which formed in November 2023. The new graben is between 800m and 1,000m wide with a depth of up to 30cm, whereas the older graben is 2km with with depths of up to 1.3m. The new graben is widening and deepening. Unfortunately, this increases the risk of new fissures in and around Grindavík.
Because a new graben has formed the magma intrusion which supplied the 14th January 2024 eruption is thought to be further east than that which supplied the 2023 eruptions.
Fig 6: Map published by IMO showing the location of the graben which formed in November 2023 and the new graben which formed in January 2024. The graben are outlined by red lines; the new graben is coloured in blue. The grey areas are the lava flows from the January 2024 eruption. Warm colours denote land which rose and blues denote land which dropped (note some is due to the creation of the defensive walls). Source: https://vedur.is/um-vi/frettir/jardskjalftahrina-nordan-vid-grindavik-hofst-i-nott
Meanwhile, inflation at Svartsengi continues. This is thought to be due to more magma entering the system.
Update, 16th January 2024
From what we can see on the webcams, the eruptive activity (or this phase of the eruption) seems to have ended on the northern fissure at around midnight last night. Activity on the southern fissure ended yesterday.
It is too early for the eruption to be declared over. Inflation continues at Svartsengi and has resumed at the stations which recorded initial inflation. New fissures may open with little to no warning.
Three properties were lost to lava. The defensive walls were effective in diverting most of the lava flow from the town, itself, despite not being completed. We do not know whether or not livestock and pets trapped in the town have been rescued. The full damage to the town has yet to be assessed. However, due to ground deformation with displacement of up to 1.4m spread over existing and new fissures, new surface cracks can appear without warning.
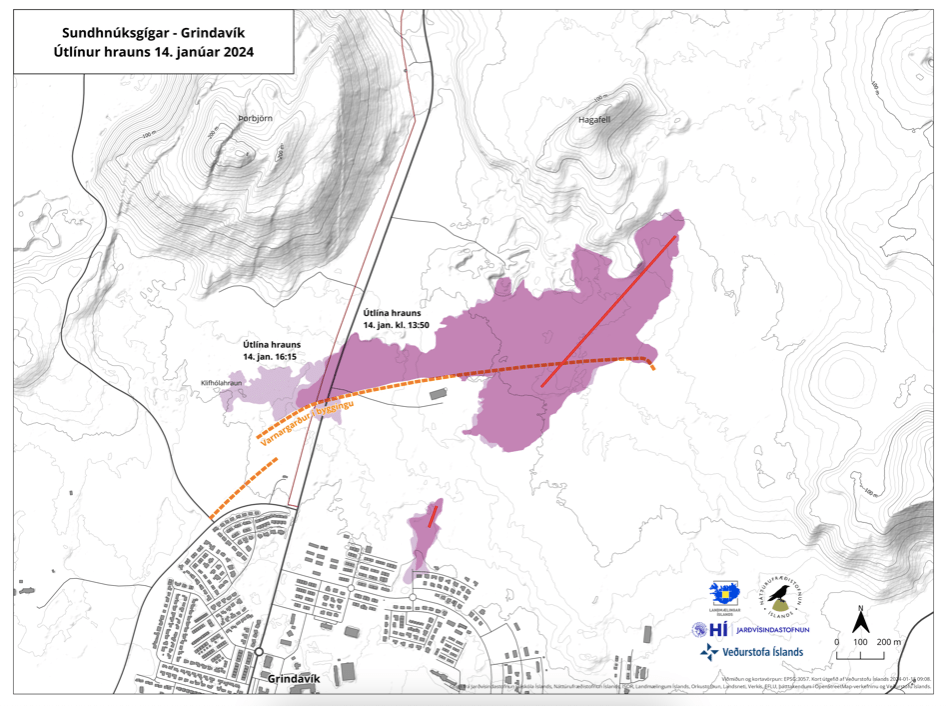
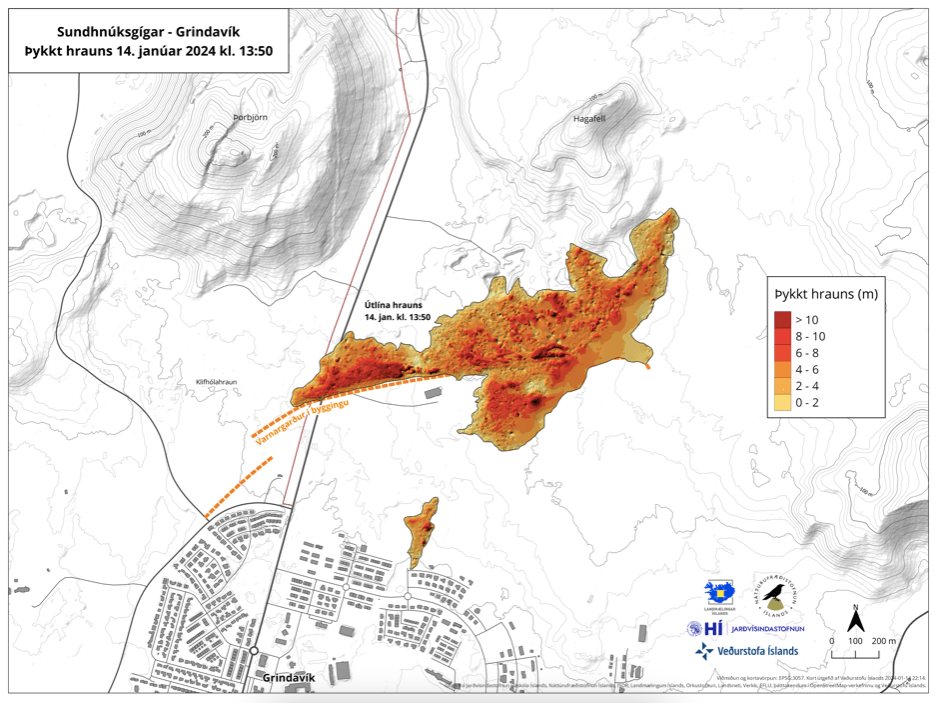
IMO has also published maps showing the extent of the lava flow as of yesterday and thickness of the lava flow. The se also show how the defensive walls diverted lava and lava pooling by the defensive wall.
Fig 4: Map published by IMO showing the extent of the lava flows. The dark purple area is the extent of the lava as at 1:50 pm on January 14; the light purple shape shows the extent as of 4:15 pm. The eruptive fissures are denoted by red lines and the defensive walls are represented by orange dotted lines. Source: https://en.vedur.is/about-imo/news/a-seismic-swarm-started-north-of-grindavik-last-night
Two eruptive fissures have opened north of Grindavík today. The summary below is sourced from IMO’s updates and RUV’s live English blog.
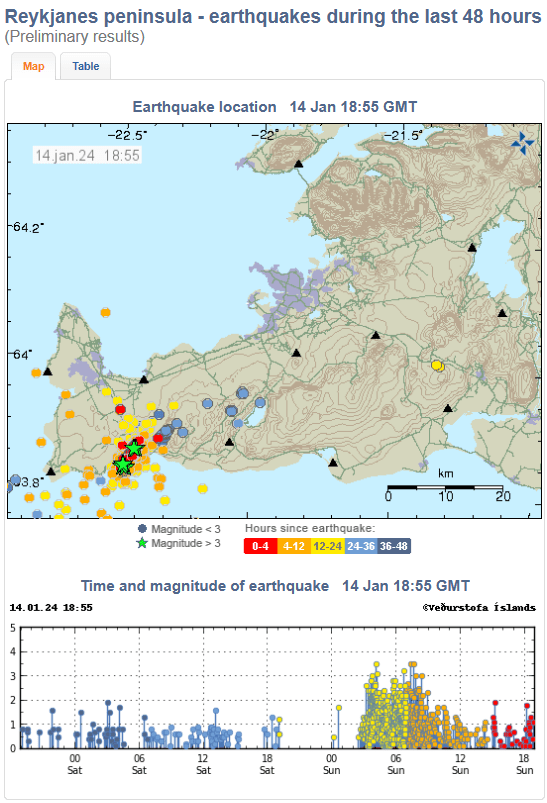
Inflation at Svartsengi had continued uninterrupted since the 18th December 2023 eruption at the Sundhnúksgígar crater row. A new earthquake swarm started before 03:00 UTC today (14th January 2024) at the the Sundhnúksgígar crater row migrating south westwards towards Grindavík. By 05:30am both seismicity and ground deformation indicated that the magma intrusion had propagated under the town.
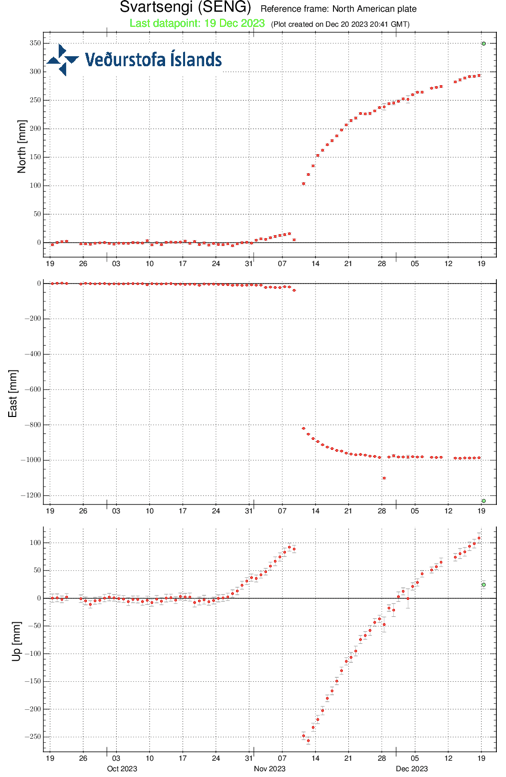
Fig 2: Inflation at Svartsengi. Source: IMO
Fig 3: Earthquake swarm today. Source: IMO
A fissure opened east of Þorbjön and southeast of Hagafell, the southern most part of which was 900m from Grindavík. By 10:44, the fissure was around 1 km in length. A second fissure opened at 12:10 just north of the town. Lava has now entered the town.
Grindavík was evacuated at c.03:00 this morning. However, some sheep and other animals kept in the town were trapped.
The defensive walls built to protect the town from lava were working well, despite not being completed, until the second fissure opened; the fissure’s southern most end was south of the defensive walls.
The authorities are asking that sight seers keep away from the site at the moment. We have given links to some webcams where you can view the eruption live.
IMO have confirmed that the eruption has ended. However, since uplift resumed immediately at Svartsengi after the onset of the eruption and is at a higher rate than that which preceded the eruption, magma is still accumulating under Svartsengi and the risk of further eruptions increases daily. The rate of uplift decreased prior to the eruption; this process is thought likely to be repeated. The most likely site for another eruption is thought to be between Stóra-Skógfell and Hagafell.
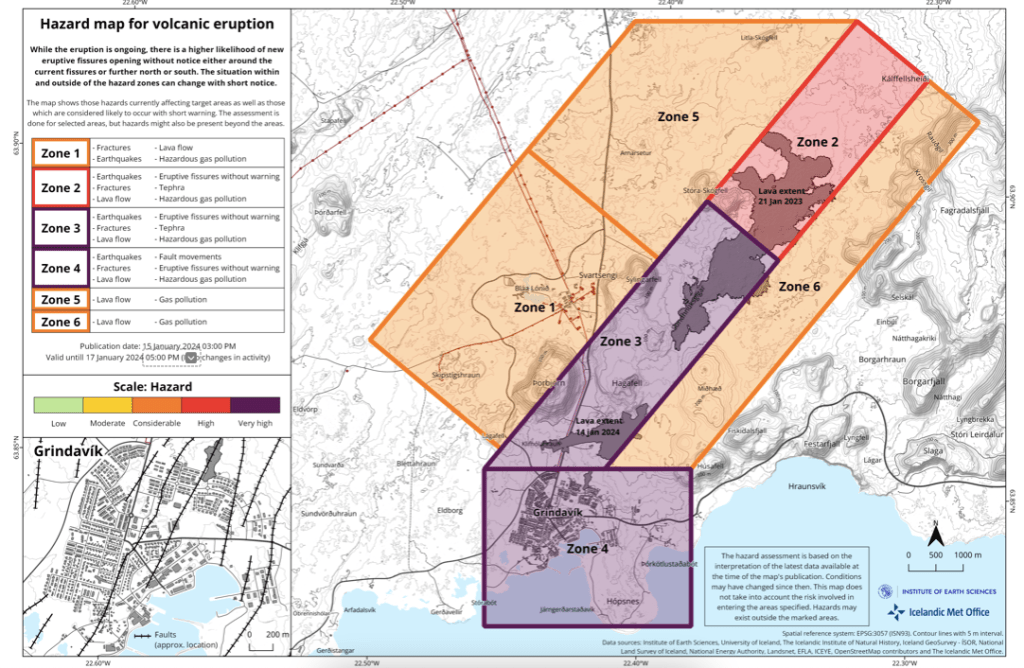
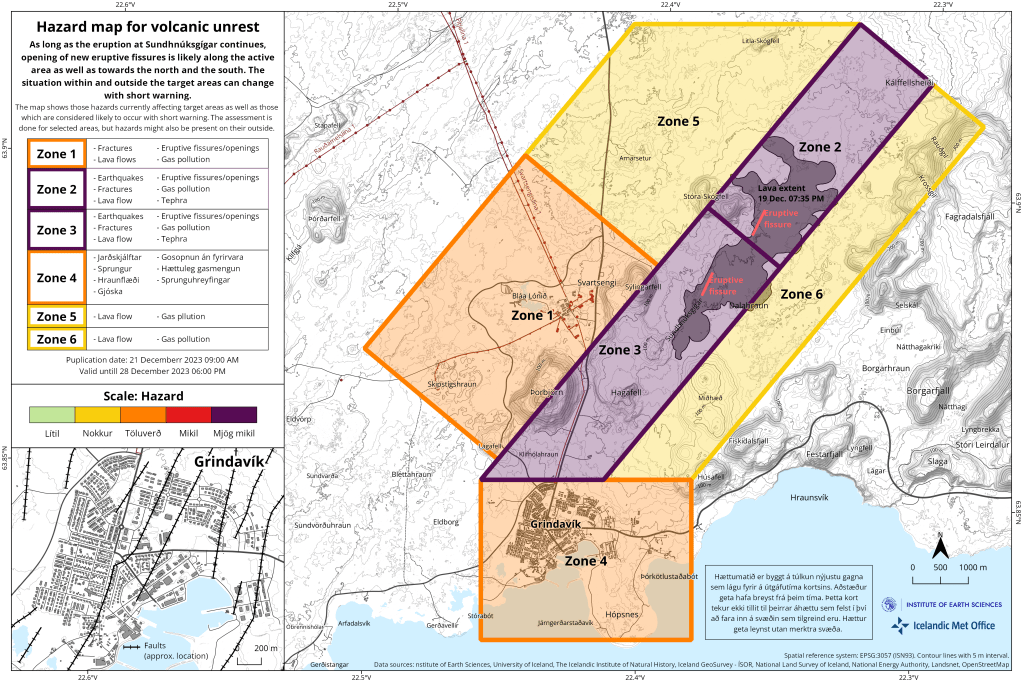
A new hazard assessment has been issued by IMO. It can be found here: https://en.vedur.is/about-imo/news/a-seismic-swarm-started-north-of-grindavik-last-night . The purple zones (very high risk) over the magma intrusion have been lowered to red (high risk); all other zones remain the same. The hazard level for Grindavík remains considerable. Conditions can change rapidly and adverse weather can hinder detection, reducing warning time.
At risk of jinxing it, the eruption appears to be over. Activity decreased late last night / early this morning. Scientists who viewed the site from the air today report that there is no visible activity in the craters and the lava flow appears to have ceased. It is, however, feasible that lava is flowing in closed channels. It would be premature to declare the eruption over. Scientists continue to monitor the area. Source: https://en.vedur.is/about-imo/news/a-seismic-swarm-started-north-of-grindavik-last-night
IMO are reporting that the eruption remains steady today. The authorities are concerned that the eruption started with considerable force after only an hour from the start of the latest episode in the seismic swarm. Magma is most likely sourced from Svartsengi, which has had several periods of inflation since 2020, although the eruption started on the magma intrusion which formed on 10th November 2023. The current level of activity is comparable to recent eruptions at Fagradalsfjall.
A new risk assessment has been carried out. Seismic activity has remained fairly steady, following the initially intense swarm, and ground deformation has not changed significantly to date (or not as much as during the formation of the November magma intrusion). The risk of a new eruptive site forming near Grindavík is thought to have decreased but the risk still remains substantial. Magma can reach the surface quickly, not giving the authorities much time to issue warmings. The most likely sites for new activity remain over the November magma intrusion. A new hazard map has been created.
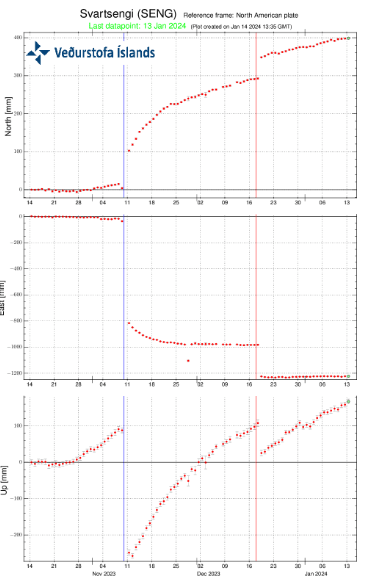
Fig 6: Ground deformation at Svartsengi. Source: IMO
Scientists collected lava samples on 19th December 2023. Their analysis shows a composition of c.6% Mg2O, c.2.29% TiO2 with a K2O/TiO2 ration of 0.23. The lava is thought to be more evolved than the lavas erupted at Fagradalsfjall, having spent more time in the crust. It may have the same source as the recent Fagradalsfjall eruptions. (Source: https://jardvis.hi.is/is/eldgos-vid-sundhnuksgiga-nidurstodur-maelinga-18-desember).
Update 19th December 2023, 16:30 (video issues corrected)
The lava flow has decreased and is now about 25% of the initial output.
The Coast Guard reports that the eruption is now mainly in two places on the fissure and a small vent in the south. The larger sites are each c. 300 metres to 500 metres long. The southernmost site is c. 2 kilometres north of Sundhnúk. There is also a very small site north east of Stóra-Skógsfell.
Magma plumes are also smaller, reaching about 30 meters at their highest point. Lava is currently flowing eastwards towards Fagradalsfjall, with two smaller flows heading westward, both north of Stóra-Skógfell.
The eruption is currently following a similar pattern to recent volcanic eruptions at Fagradalsfjall, where the fissures have started to contract and form single vents.
This evening an intense earthquake swarm started c. 20:40 local time, north of Grindavík, following the path of the recent magma intrusion. This heralded the eruption which started just after 10:00pm. The eruption is located close to Sundhnúkagígar, about four kilometres northeast of Grindavík. At the time of writing, the aviation code is orange.
The local authorities are evacuating Grindavík and Reykjanesbraut (the road which connects Reykjavik to the airport). A civil defence emergency has been declared. This is not a tourist eruption.
The eruption is powerful, with jets reaching hundreds of metres high. The initial fissure was 200m to 300m long, with a lava flow of 100 to 200 cubic metres per second. The fissure has now reached c. 3.5km length. There is a risk that lava may reach Grindavík.
Prior to the eruption, inflation at Svartsengi had reached 10th November 2023 levels prior to the formation of the graben and magma intrusion.
Fig 3: inflation at Svartsengi. Source: IMO.
For updates, please consult the relevant authorities, for example, IMO and Department of Civil Protection and Emergency Management
We will update our earthquake plots as soon as we get a chance.
At the time of writing, the eruption has not materialised. The swarm continues, albeit the magnitude and number of the earthquakes has decreased.
The status of Grindavík has been downgraded from “emergency” to “danger”. The aviation code has been reduced to yellow. If an eruption does ensue from this swarm, the most likely location is between Hagafell and Sýlingarfell.
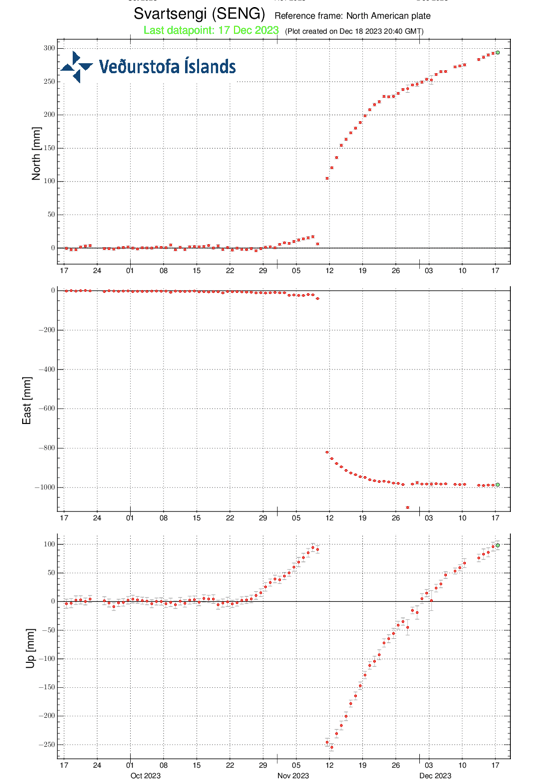
On 21st November 2023, IMO reported significant uplift in the vicinity of Svartsengi. While an eruption may follow here, it is thought that it would be preceded by an increase in seismic activity. There is still a likelihood of an eruption near the magma intrusion. Since then, uplift has continued.
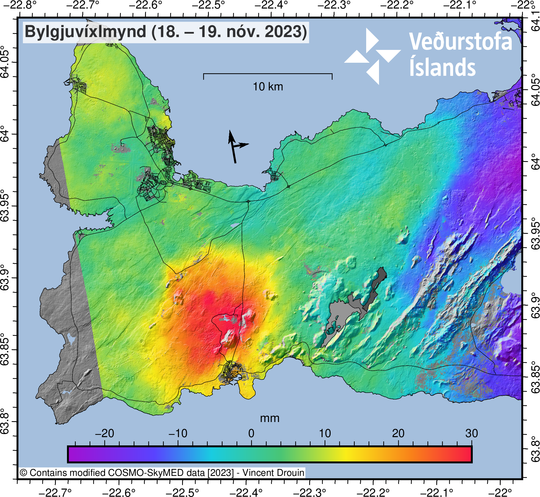
Fig 33: COSMO-Skymed interferogram spanning 24-hours between 18−19 November at 06:41. The broad uplift signal visible in orange/red around Svartsengi is indicative of inflation occurring at a depth of > 5km. Source: IMO
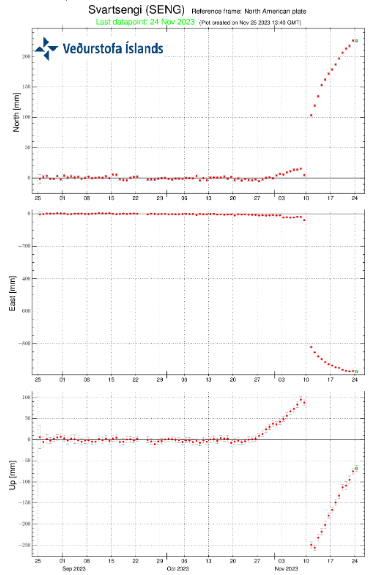
Fig 34: GPS from IMO showing ground deformation at Svartsengi. There was initial uplift at the start of the swarm, followed by large drop when the graben was reactivated / dike formed, which, in turn, is followed by resumed uplift. Source: IMO.
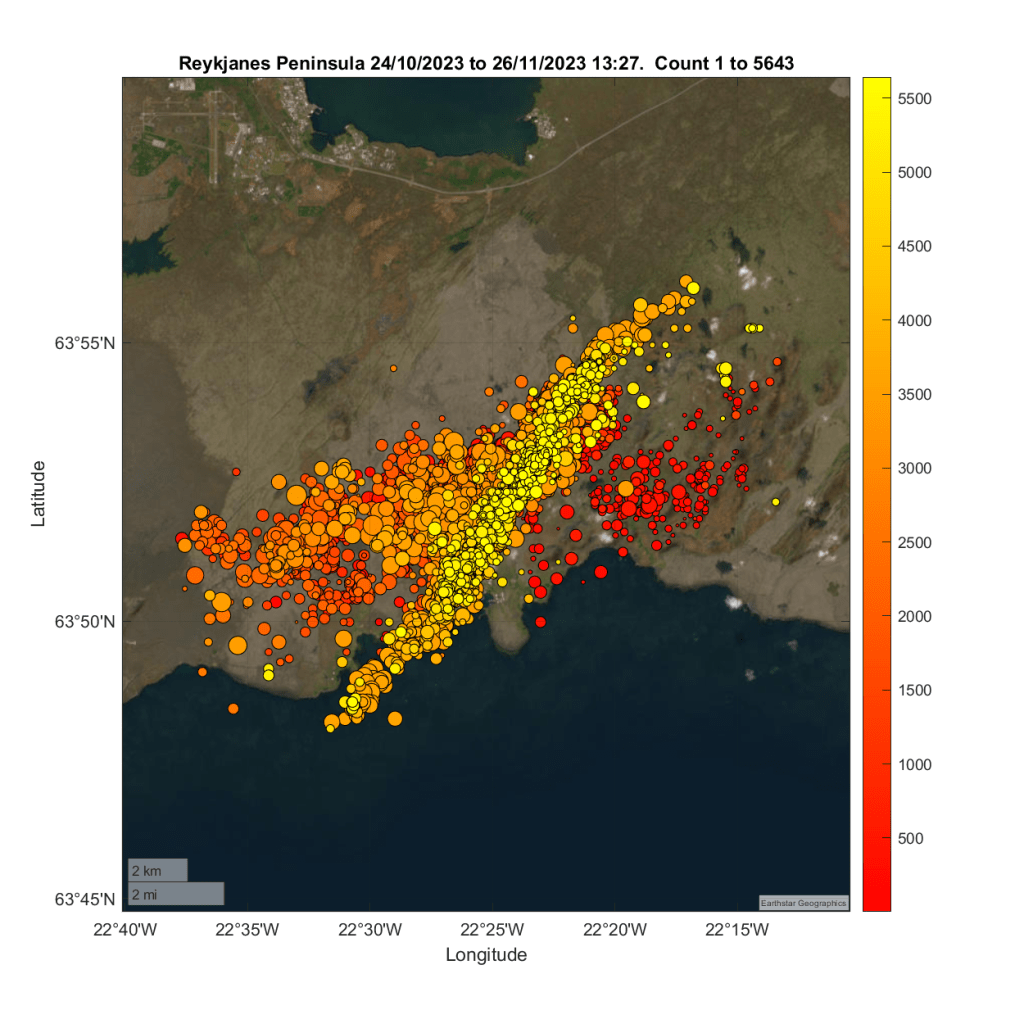
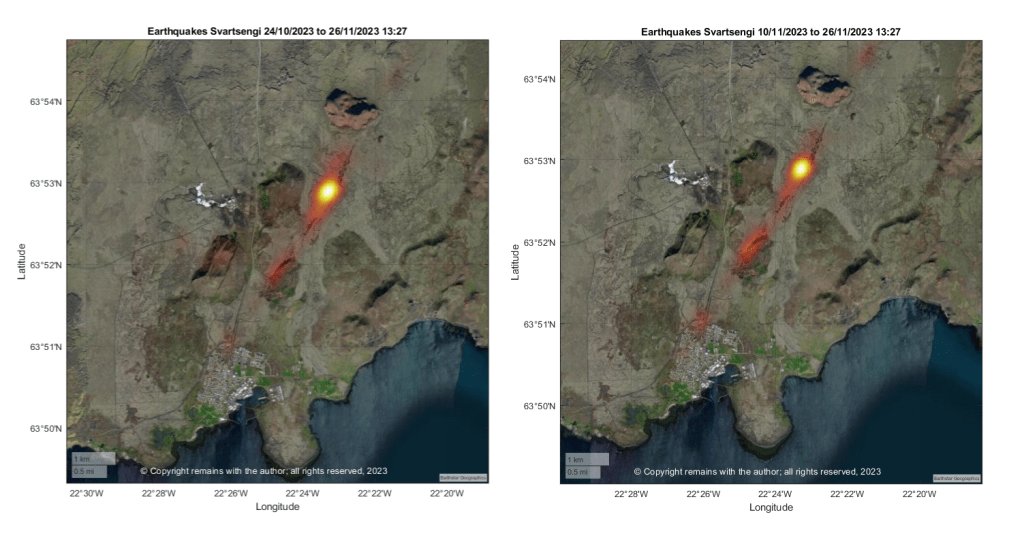
We have updated our earthquake plots from 24th October 2023 to 26th November 2023 13:27. Most activity is occurring along the magma intrusion, although it is focussed more on the area to the east of Sýlingarfell on Sundhnúksgigar.
Our plots show faults responding to magma, with decreasing seismic activity along the possible dyke formation since the reactivation of the graben. This may reflect the fact that magma has reached less brittle layers or most of the seismicity associated with the magma intrusion was in fact due to tearing of the crust in response to the inflation at Svartseni and environs, which, in turn, may or may not have allowed magma to flow into the formation. Time will tell.
Since our earthquake plots were compiled, there has been another small swarm to the east of Sýlingarfell.
We believe that this is the calm before the storm (an eruption) but when will the storm break?
For updates, please consult the relevant authorities, e.g IMO (link below).
The earthquake swarm is continuing as we write, although he magnitude of earthquakes has reduced. As the uncertainty continues, our thoughts are with those required to evacuate Grindavík, those supporting them, the Department of Civil Defence, and the scientists and others monitoring the activity.
According to IMO, ground deformation is continuing at a slower rate. It is thought that if an eruption occurs, it is most likely to be in the region of Hagafell. Yesterday, sulphur dioxide was detected in a borehole at Svartsengi located north of Mt Þorbjörn. The borehole extends eastwards towards the Sundhnúkur crater row, close to the where the magma intrusion is. This is considered evidence of magma north of Hagafell. The possibility of an eruption is still considered high.
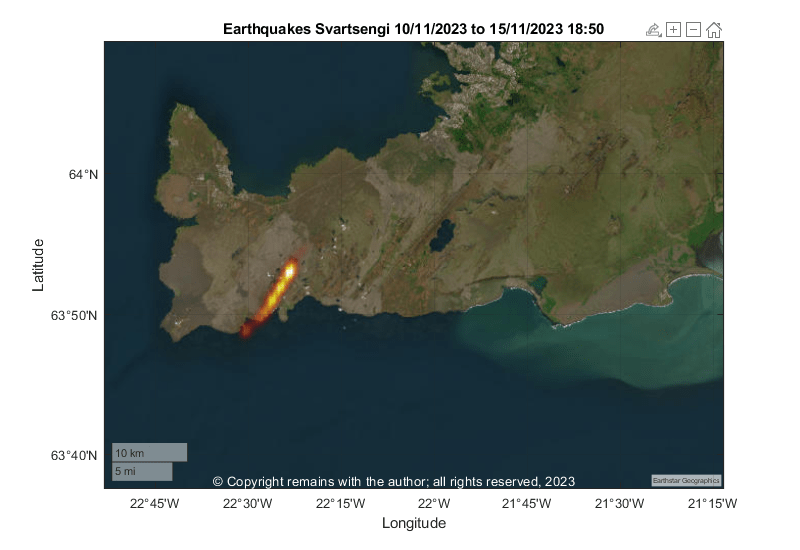
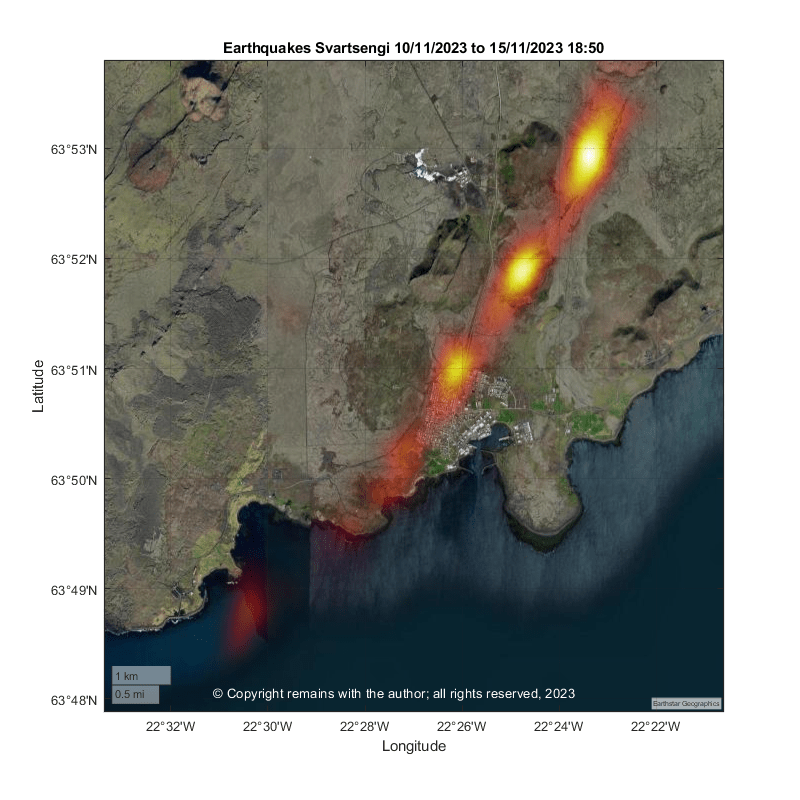
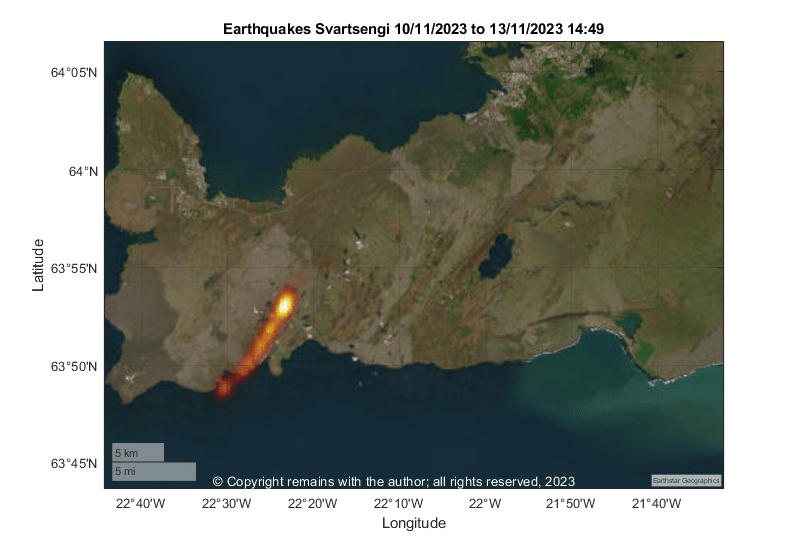
If we ccompare the locations to our geodensity plots (ref. Fig 31 below), the areas of most seismic activity are located at the Sundhnúkur crater row, Hagafell and northwest Grindavík. The geodensity plots are often good predictors of where an eruption will occur. However, with three current seismic hot spots, the situation is not clear at the moment. If an eruption occurs, the precise location(s) will depend on where weak spots allow magma through.
Our updated earthquake plots are below. The data source is as below.
Seismic activity is occurring along the dike and also at Krýsuvík.
The earthquake swarm continues as we write. The intensity has lessened, and the size of the earthquakes decreased. The probability of an eruption is still considered high.
According to IMO, most monitoring is focussing on the dike formation and Grindavík. Ground deformation is consistent with magma flowing into the dike. Part of the magma may be solidifying at the edges of the dike. Magma inflow is thought to be near Sundhnúk. SO2 measurements show fluctuating degassing associated with the dike. Magma may have come within 500m of the surface. The sink hole which opened in Grindavík continues to widen.
We have updated our earthquake plots to 18:50 today.
The most recent earthquakes occur along the dike, and at Krýsuvík. We do not understand the relationship between Fagradalsfjall and activity further west, other we have observed than activity at Krýsuvík usually precedes activity west of it. Frustrating not to be a geologist!
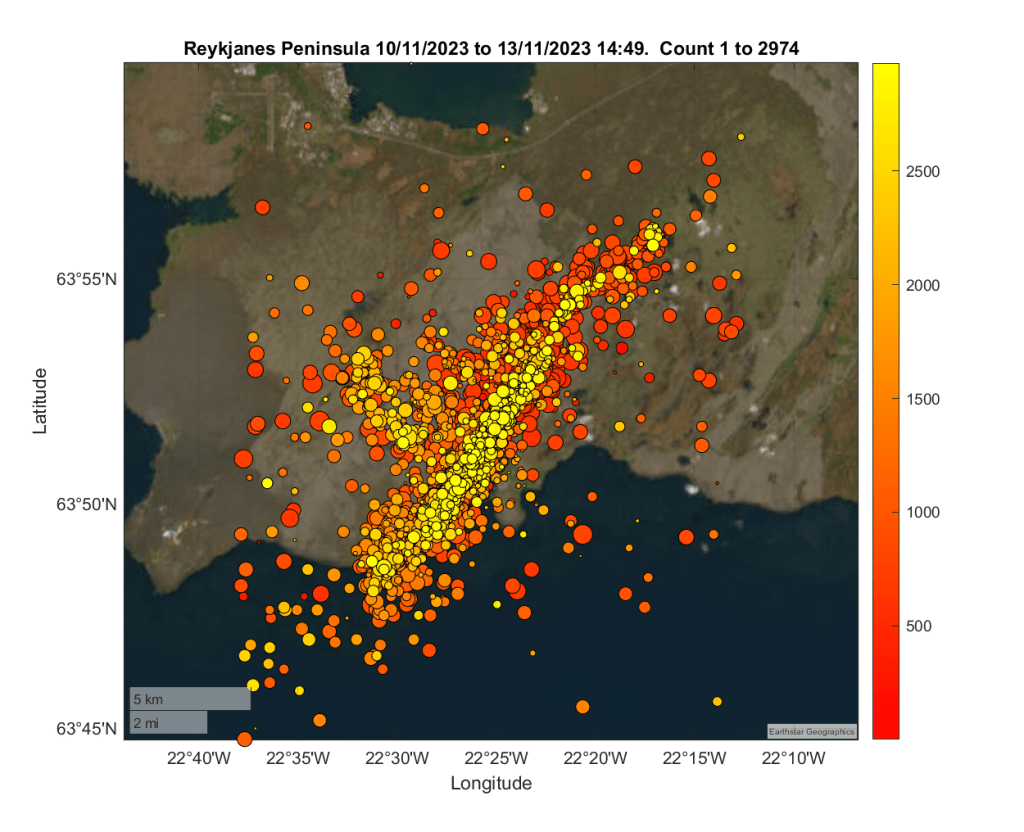
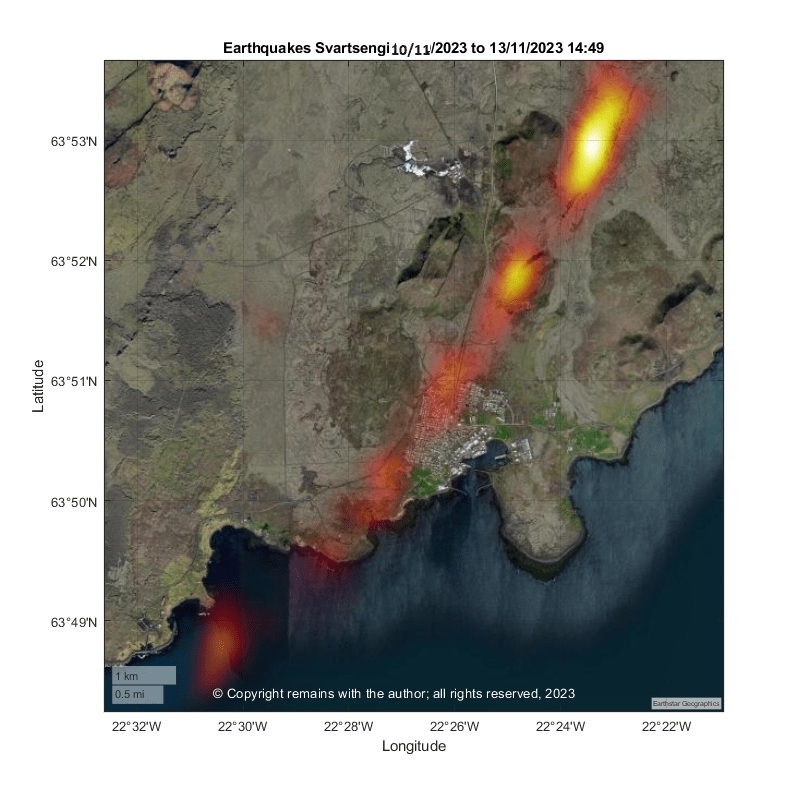
Correction: Fig 20 is for the period 10th November to 13th November (Error was in the image title, not the caption. The plot, itself, is unchanged). Apologies for any inconvenience.
The earthquake swarm continues as we write. The intensity has lessened, and the size of the earthquakes decreased, most probably reflecting the fact that magma has reached less brittle rock layers nearer the surface. Scientists have said the magma inflow has lessened, seismic activity is between depths of 2km and 5km but there is no change in the assessment of the likelihood of an eruption.
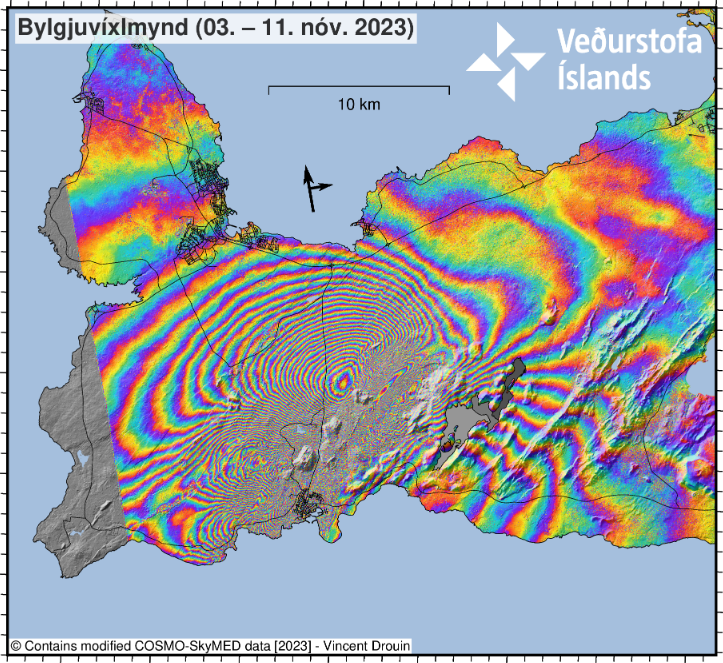
The InSAR image showing the formation of the possible graben running through part of Grindavík has been published on IMO’s site today. The sudden formation of the graben on Friday night led to the evacuation of Grindavík. Local news sources have images of the damage done to roads and property.
Fig 15: InSAR image showing ground displacement caused by seismic activity between 3rd November 2023 and 11th November 2023. Source: IMO
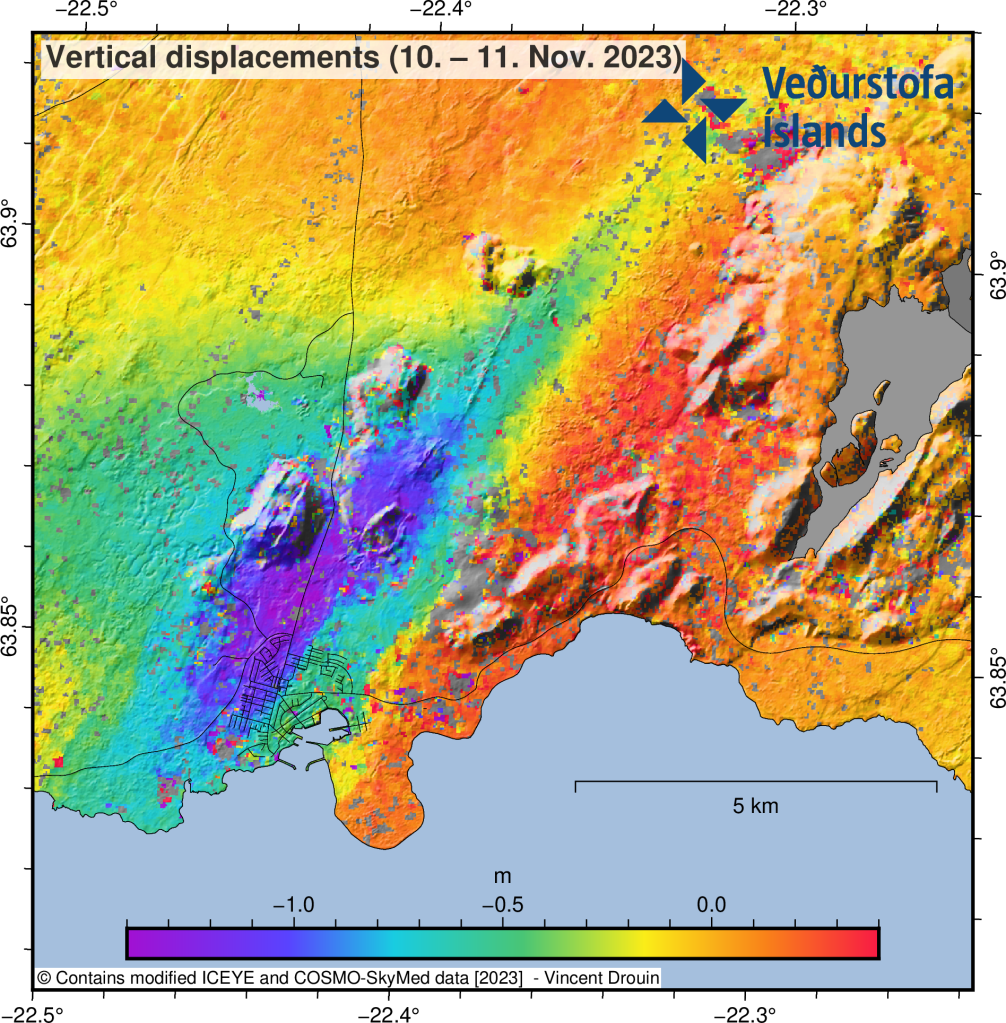
Fig 16: Estimate of the vertical displacements caused by the dike during its initial propagation from Friday afternoon to Saturday morning. The displacements were estimated by combining ICEYE and COSMO-SkyMed pixel offset tracking results. Source: IMO.
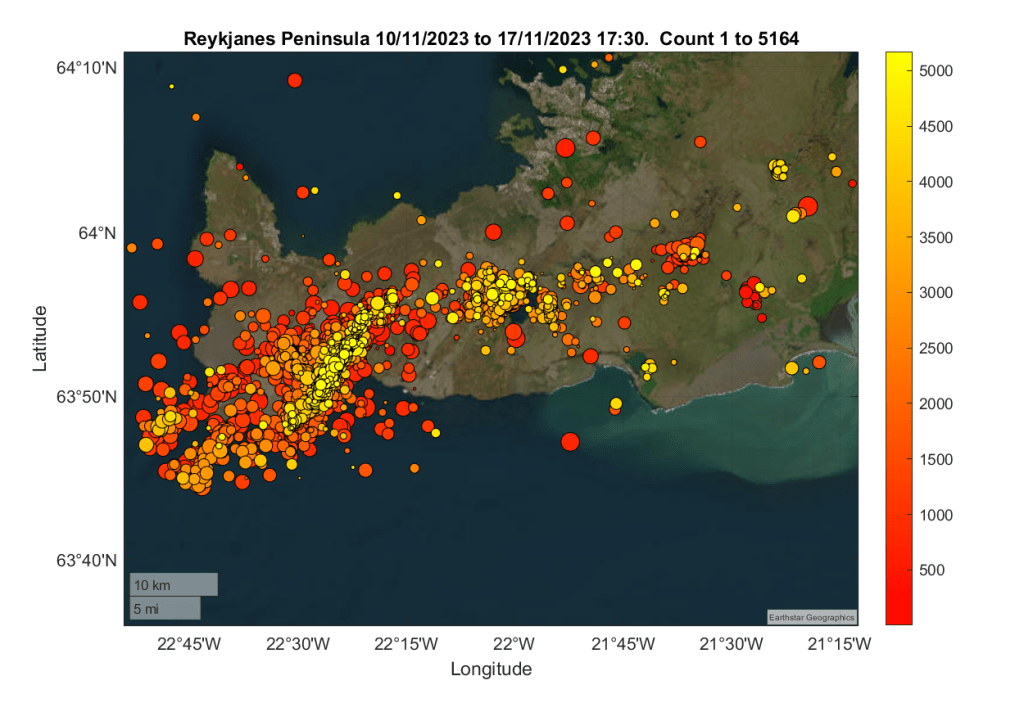
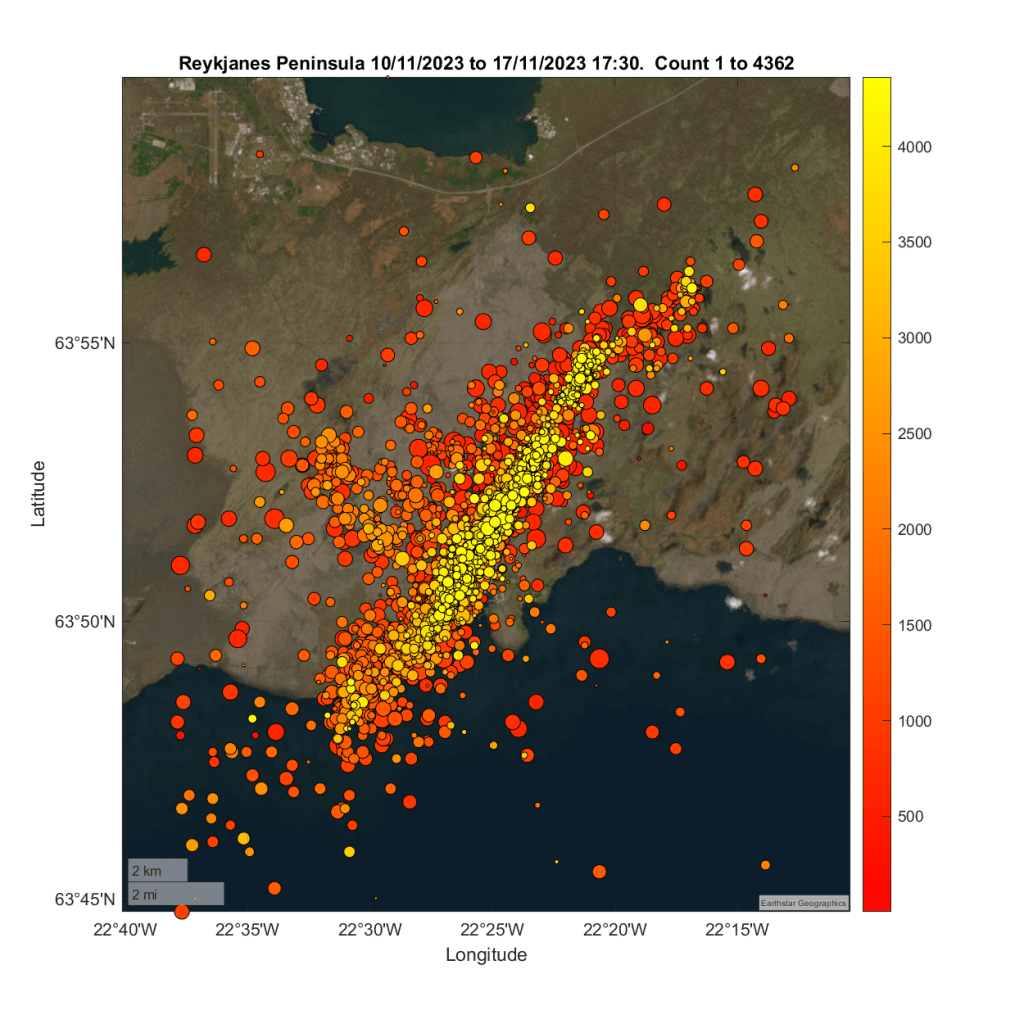
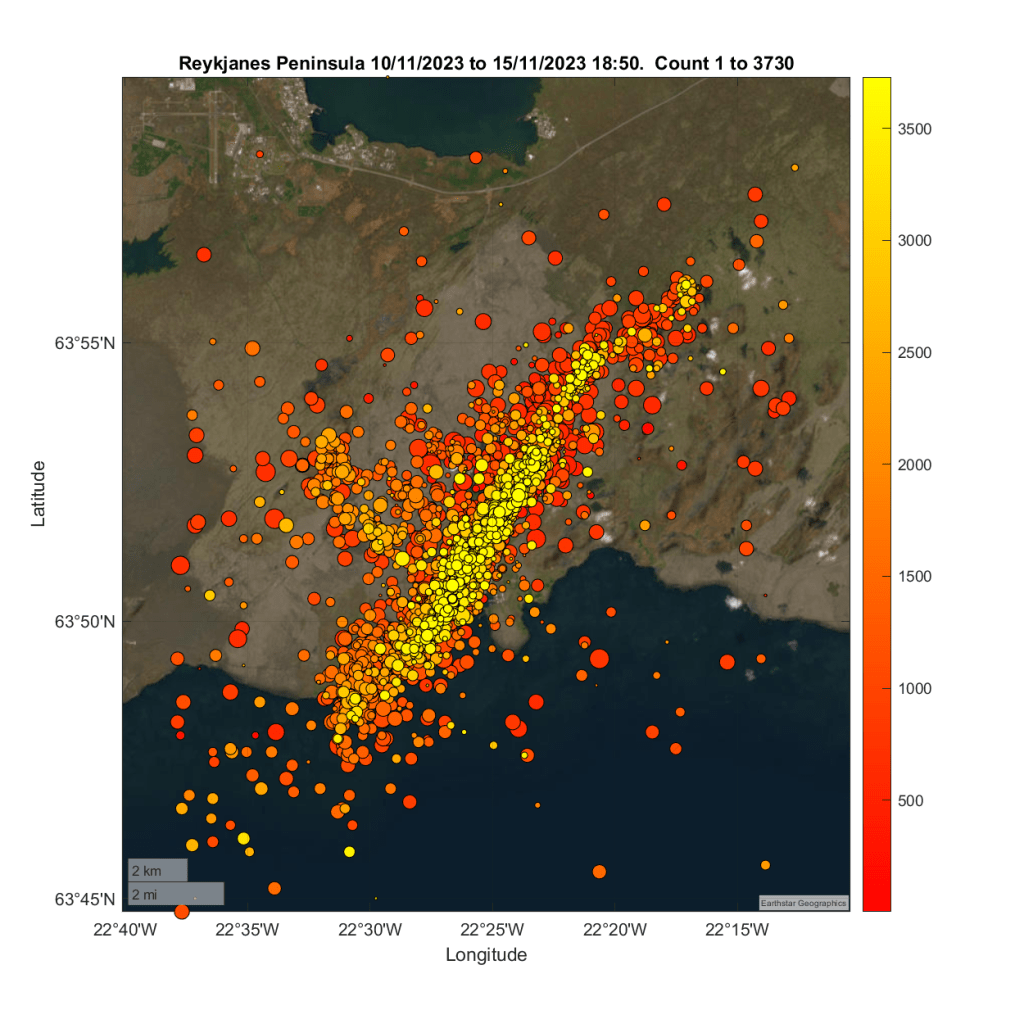
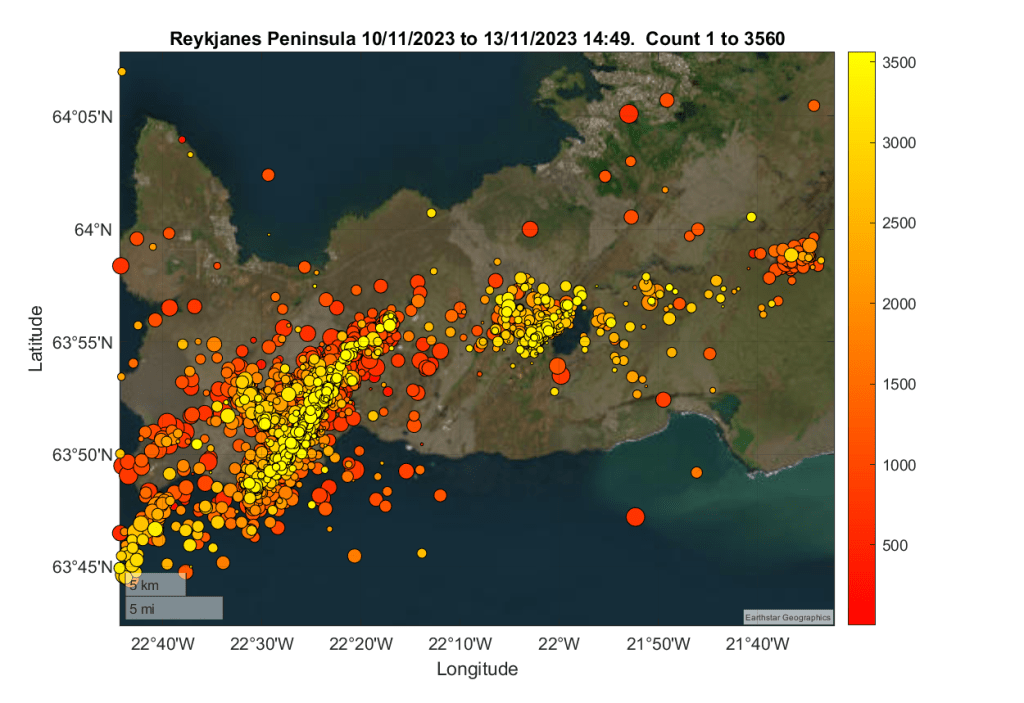
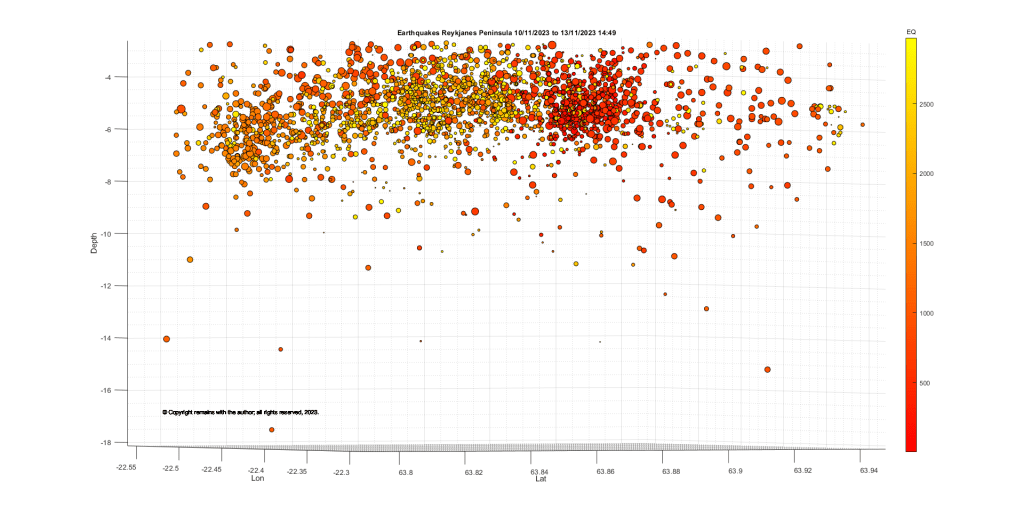
We have updated our earthquake plots for the swarm from 10th November 2023 to 13th November 2023 14:49. We used the earthquakes published on Whole Country (vedur.is) for the Reykjanes Peninsula with a quality of over 90%., a total of 3,560 earthquakes. We may have picked up some ghosts and other errors (confirmed earthquakes have a quality of 99%) but we believe that this will give a rough idea of what is going on.
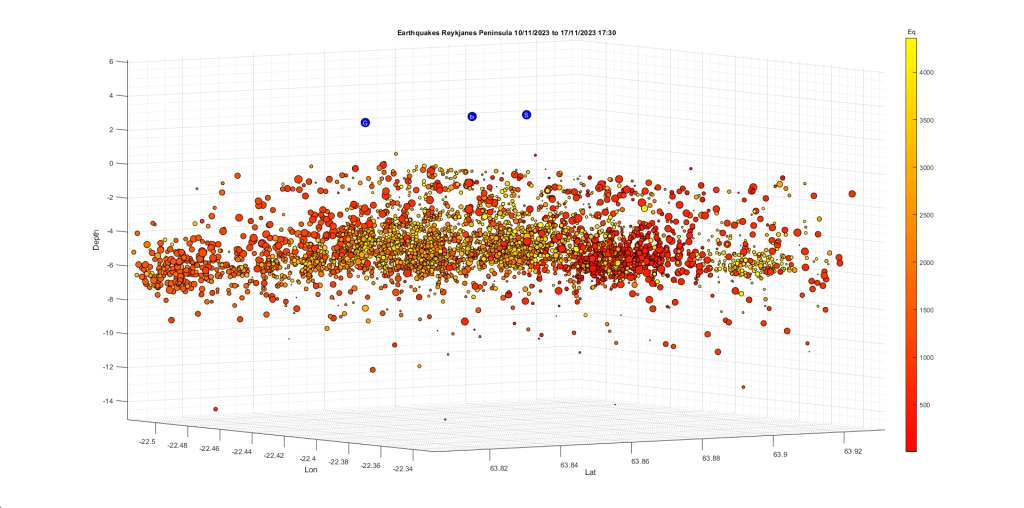
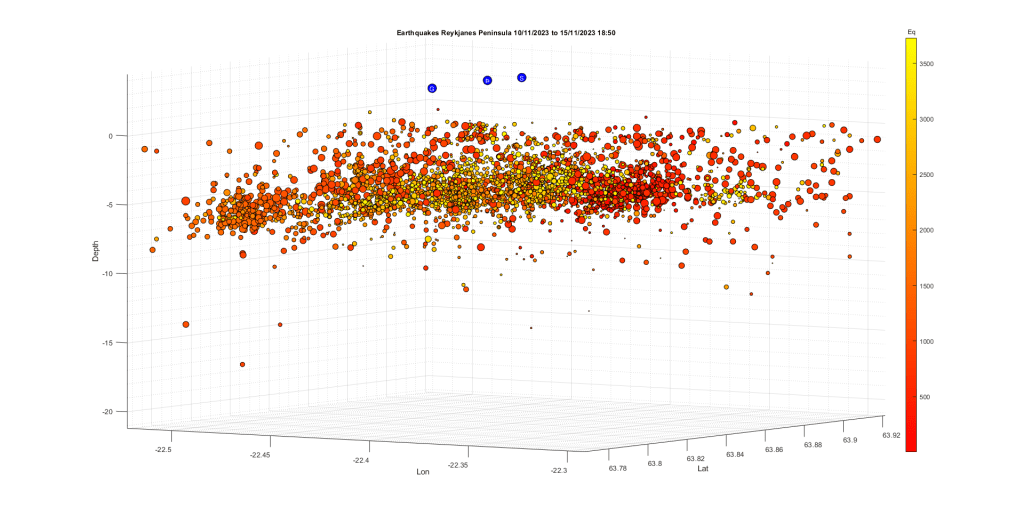
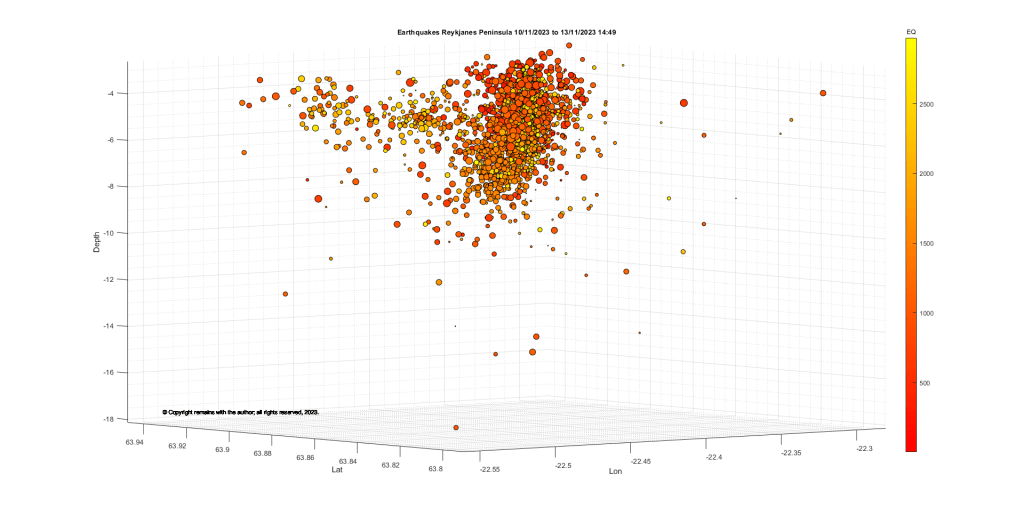
Our 3D scatter plots for the above seismic activity covered too big an area to look at the formation. We extracted earthquakes between 63.746°N, 22.211°W and 63.996°N, 22.631°W, a total of 2,974 earthquakes. For the 3D scatter plots only we removed a small earthquake with a depth of more than 40 km from the data set as it distorted the scale of the plots too much.
IMO reported this evening that there is a significant likelihood of a volcanic eruption in the coming days.
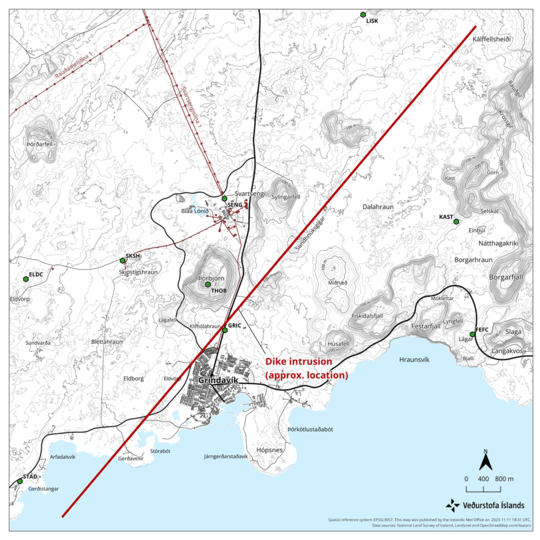
Modelling based on ground deformation and seismicity by scientists at IMO and the University of Iceland shows that there is a 15km long magma intrusion located northwest of Grindavík. The intrusion stretches from Kálffellsheiði, northeast of Grindavík, to offshore southwest of Grindavík.
Magma has ascended to 800m below the surface. Where and when an eruption will occur cannot be predicted now – other than to say that it would most likely be in the vicinity of the intrusion, if it occurs.
Fig 12 Map showing the location of the dike intrusion based on combined satellite radar imagery, GPS measurements, and geophysical modelling. Source: IMO
Since our original post below, events have moved on. The town of Grindavík was evacuated overnight when it became apparent that a dike could be forming under the town. The Svartsengi Power Plant will be operated remotely.
The swarm has continued relentlessly since yesterday.
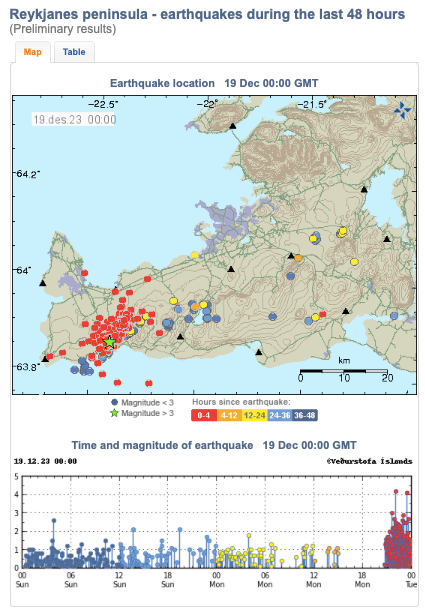
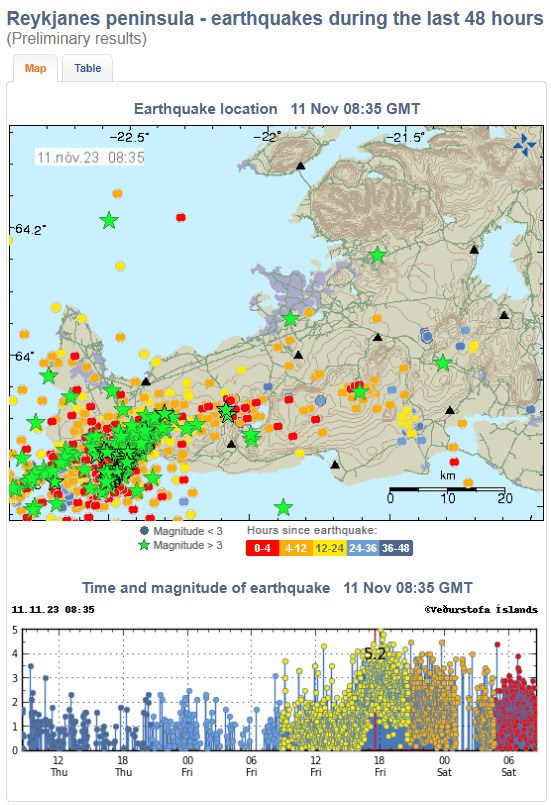
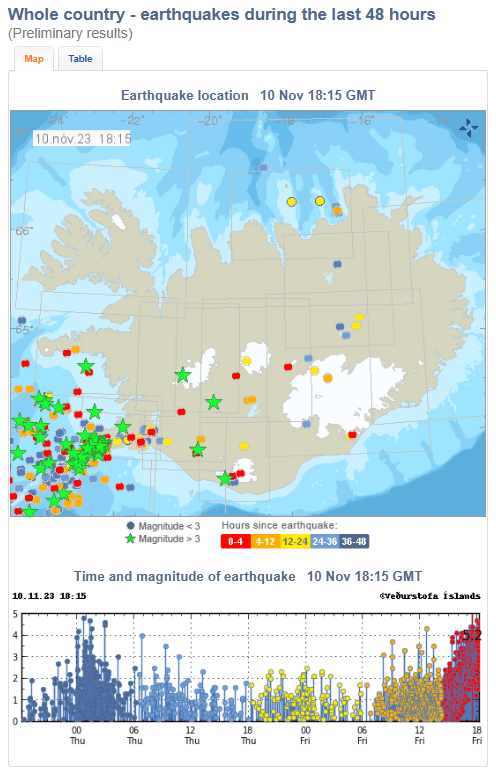
Fig 8: Earthquakes on the Reykjanes Peninsula. Note the activity is concentrated near Mount Þorbjörn; most of the outliers are ghost in the auto system. Source: IMO.
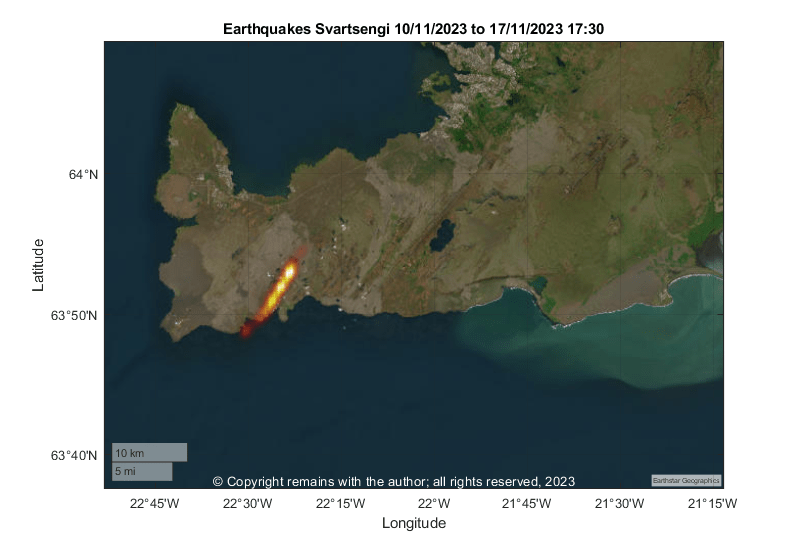
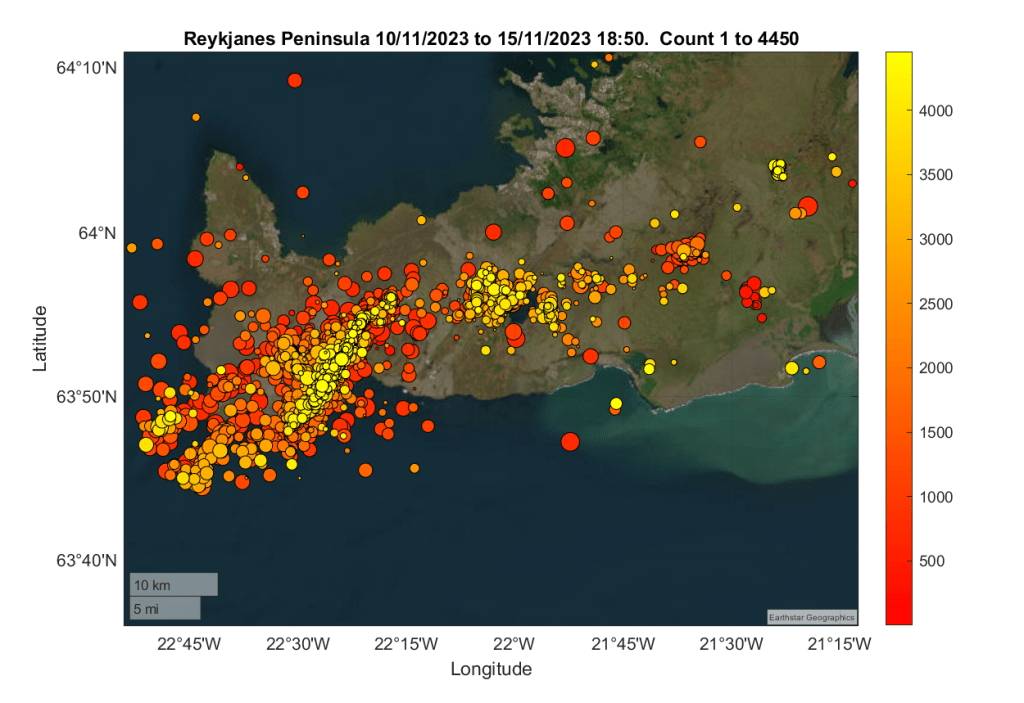
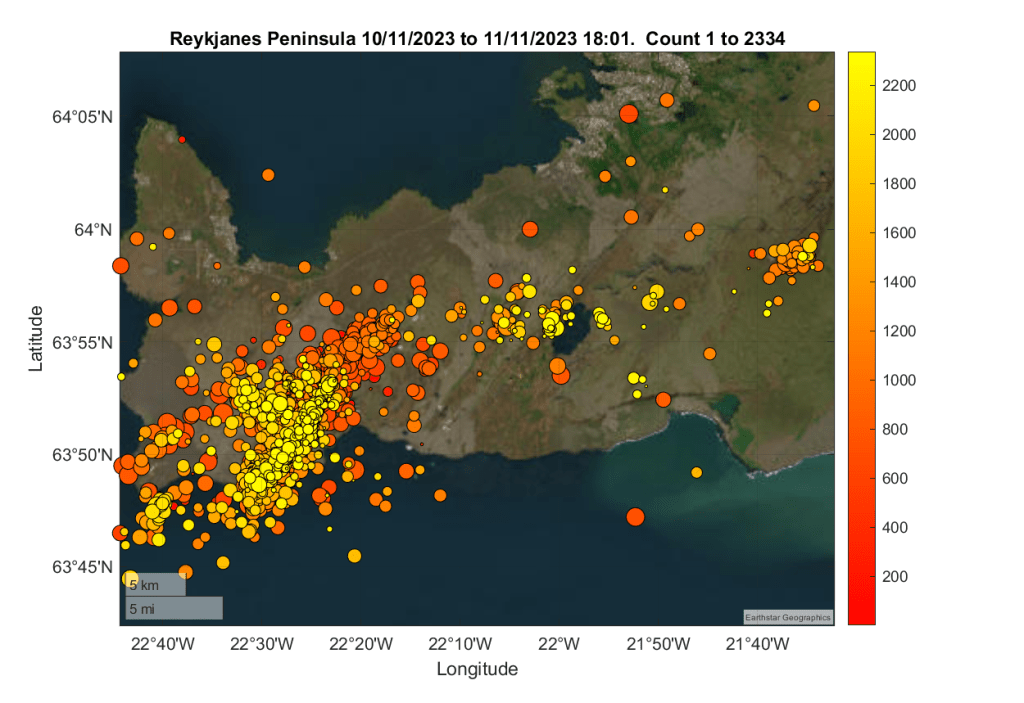
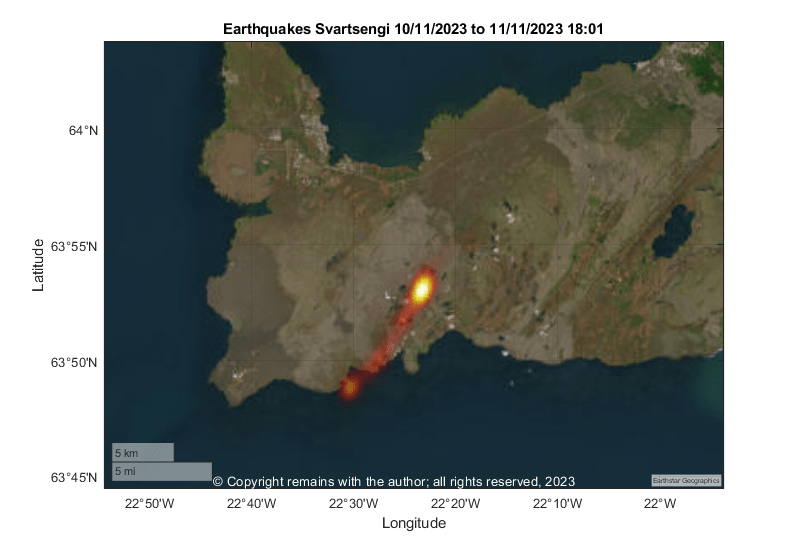
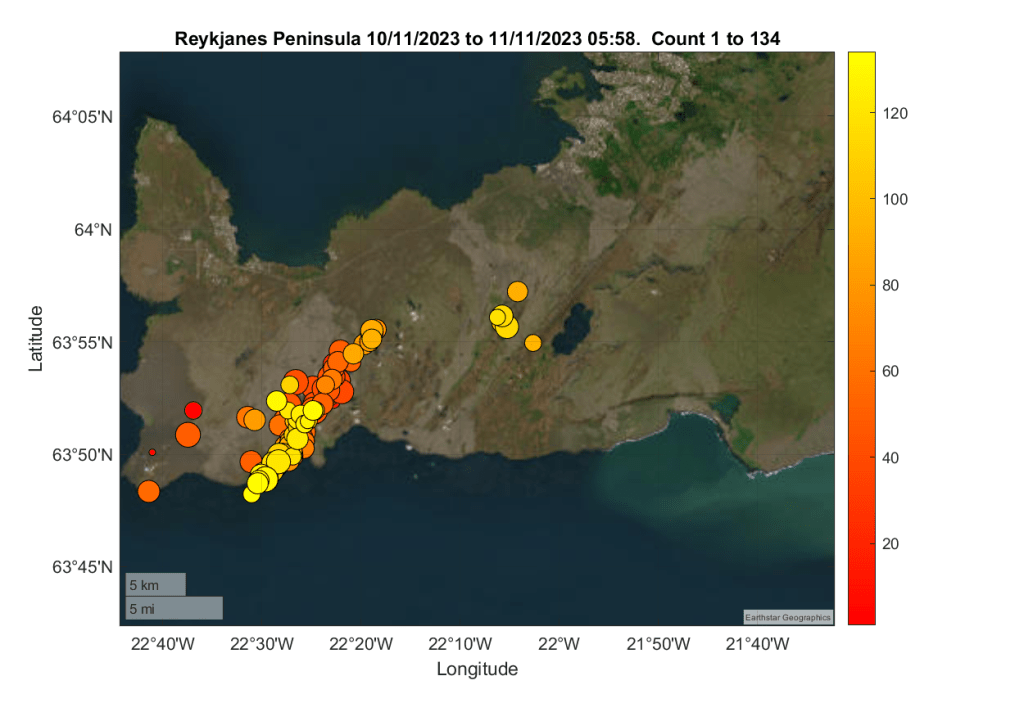
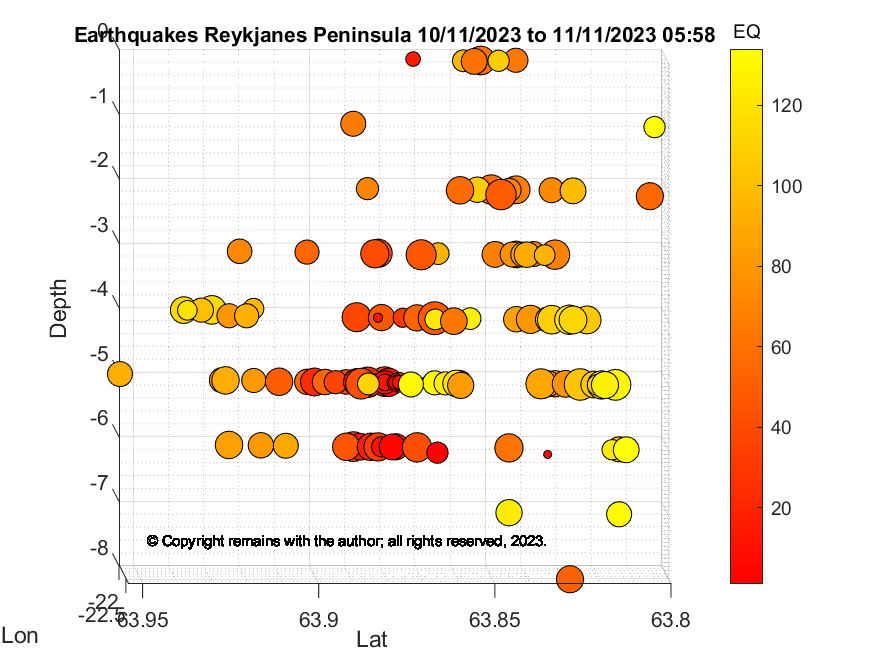
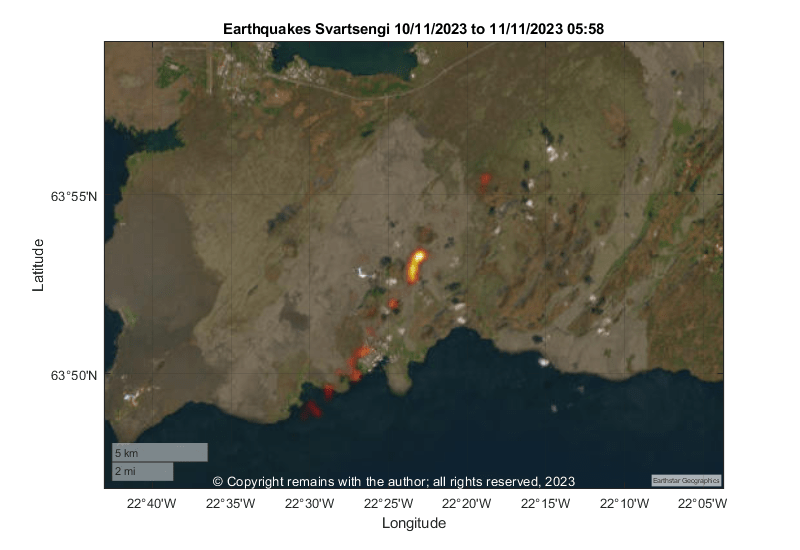
We have plotted the activity from 10th November 2023 to 11th November 2023 05:58 using the confirmed earthquakes reported on Skjálfta-Lísa (vedur.is), a total of 134 earthquakes. Our plots show the possible dike formation.
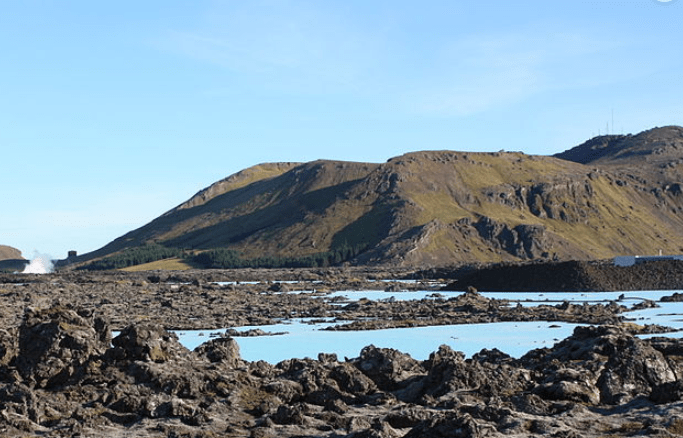
Fig 1: Image cropped from one by Arian Zwegers of the Blue Lagoon with Mt Þorbjörn. Published under CC BY 2.0
A large earthquake swarm started north of Grindavík, Iceland, on 24th October 2023 in the vicinity of the Svartsengi Geothermal Plant and Mount Þorbjörn. This is the fifth time such a swarm has occurred during the volcano-tectonic episode which started on the Reykjanes Peninsula in December 2019, including the three eruptions of Fagradalsfjall. Earlier today (10th November 2023), the swarm intensified. The aviation code for the Reykjanes – Svartsengi system has been raised to orange.
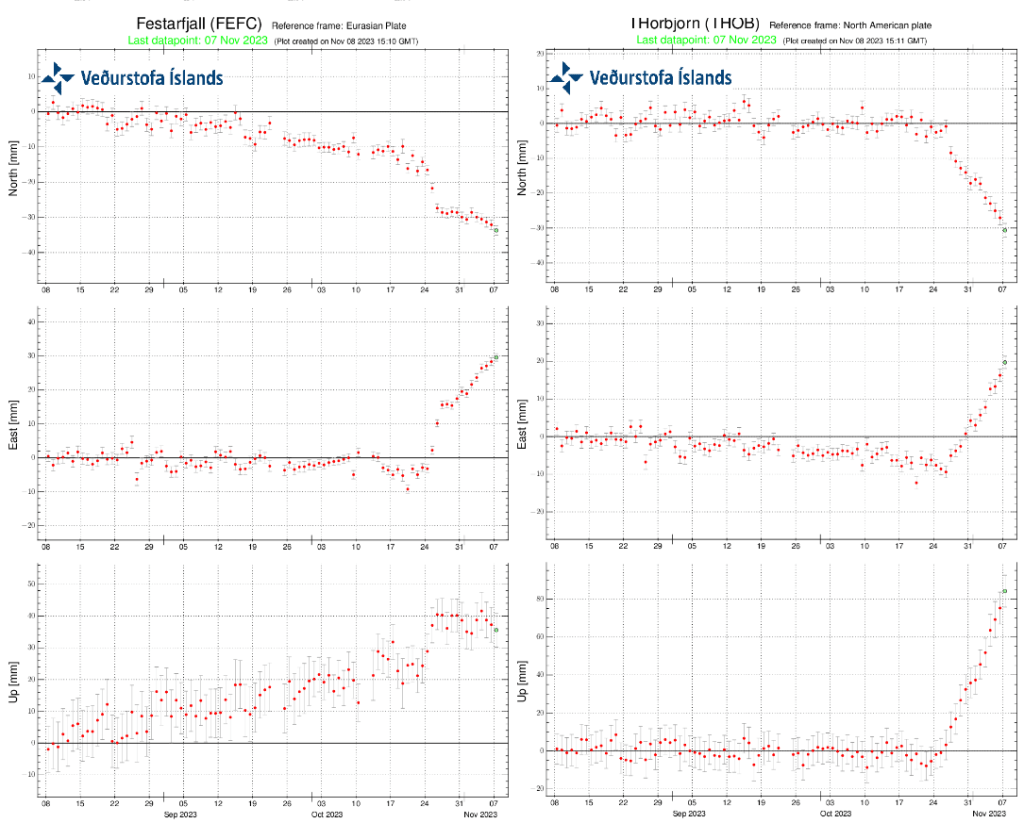
Because this activity started near Fagradalsfjall, it was initially thought that the swarm was caused by magma movement associated with Fagradalsfjall and the earthquakes to the west were triggered earthquakes (faults moving to accommodate the magma). This was born out by initial ground deformation showing at station FEFC, southwest of Fagradalsfjall. However, this has been followed by consistent uplift at the stations near Mt Þorbjörn, raising concerns that there is magmatic activity there. It is believed that magma is accumulating in a sill at a depth of 5km. Since then, there have been seven earthquakes with a magnitude greater than 4.0M in the area (as of 9th November 2023).
Fig 3: Time series for GPS stations FEFC and Thorbjörn to 9th November 2023. Source: IMO.
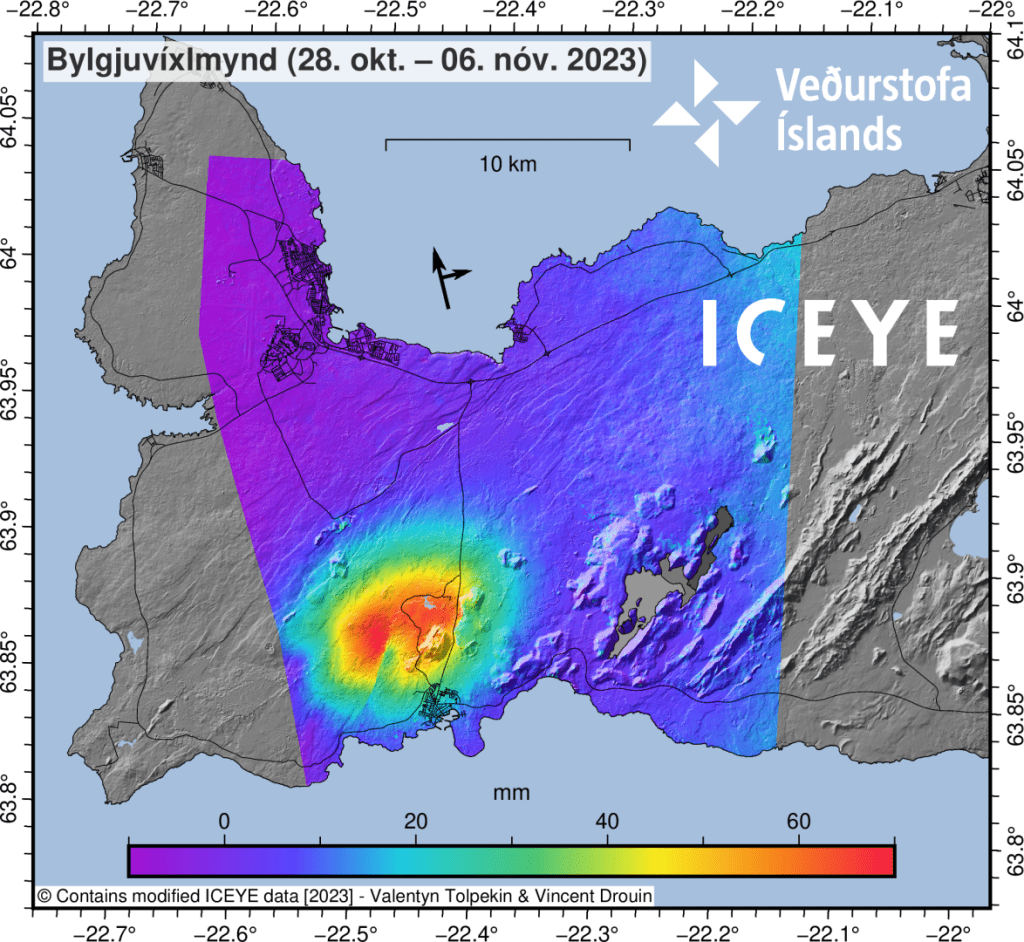
Fig 4: Interferogram (InSAR) for the period 28th of October – 6th of November showing around 7cm ground deformation. The green indent SW of Mt. Þorbjörn is an offset in the deformation signal caused by fault movements by earthquakes. Source: IMO
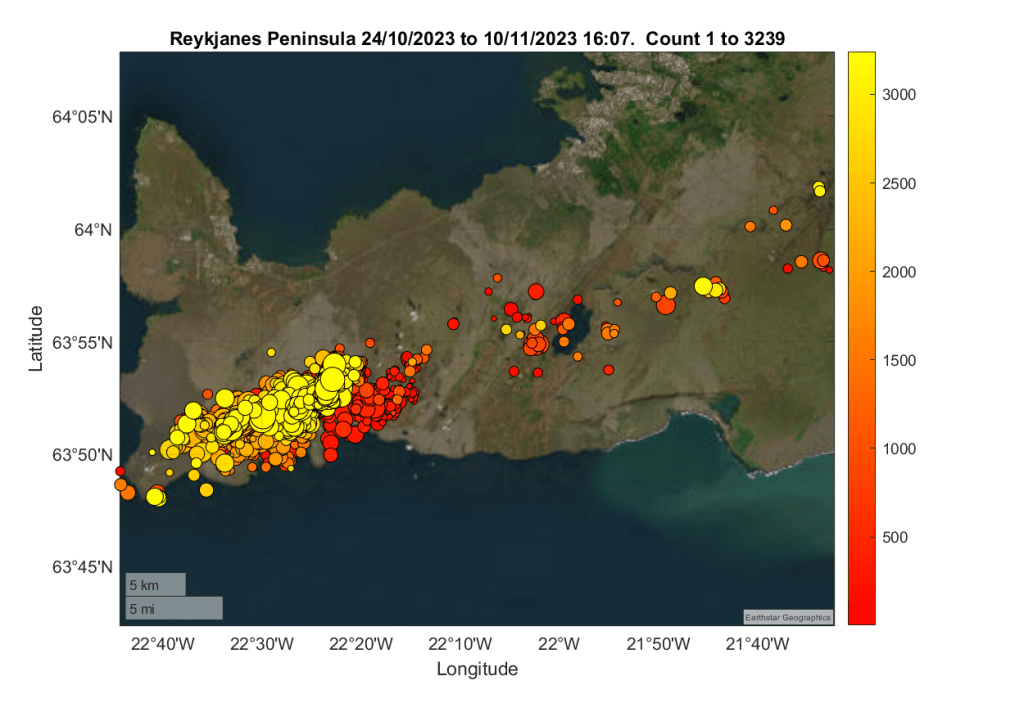
We have plotted the earthquakes reported on Skjálfta-Lísa (vedur.is) for the Reykjanes Peninsula for the period 24th October 2023 to 10th November 2023 (16:07) to see what is going on. 3,239 earthquakes have been recorded, although many more have occurred.
The geoscatter plot shows the initial seismic activity southwest of Fagradalsfjall, followed by its migration westward.
Time will tell whether an eruption ensues. But as a precautionary measure the Blue Lagoon is now closed to visitors and the residents of Grindavík have been advised of evacuation plans.
Our plot do not include the larger recent earthquakes, including the 5M. When we get more data, we will update our plots.
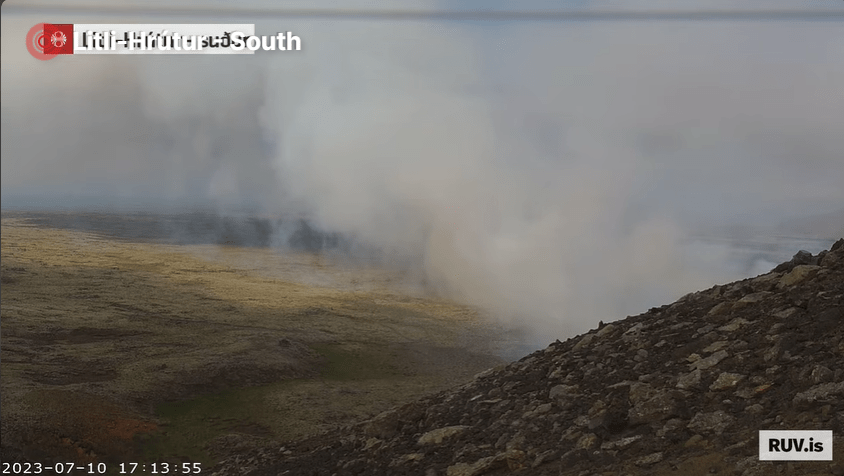
The eruption site is closed to the public right now due to the danger from volcanic gasses and smoke from moss fires; some visitors have been affected. Also, some visitors have been taking insane risks (e.g., attempting to climb the crater wall). High winds yesterday also caused issues.
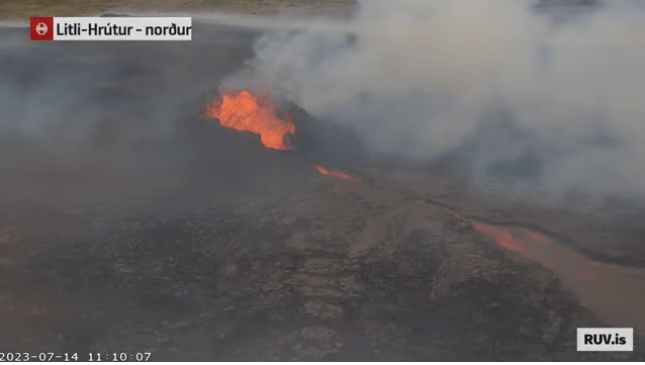
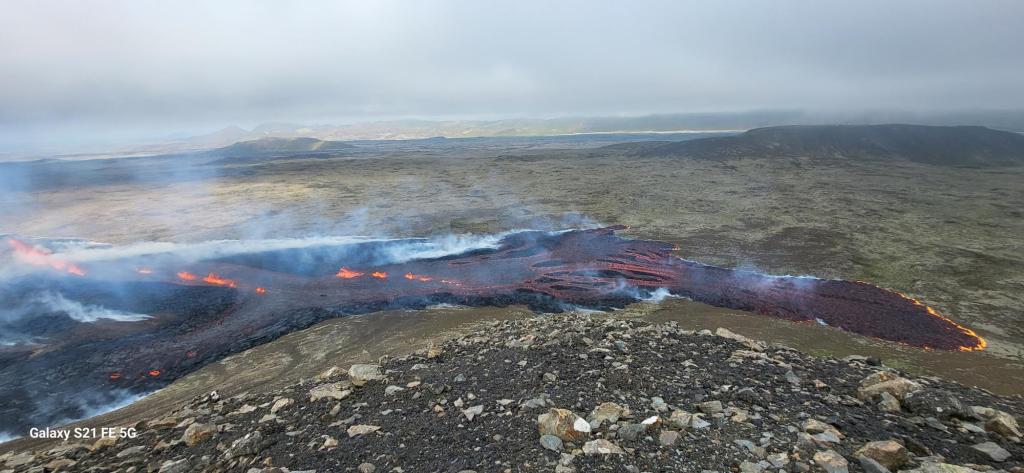
As we know the eruption started on 10th July 2023 at 16:40 with the opening of four fissures with a combined length of c.800m in a north easterly direction from Litli Hrútur towards Keilir. The eruption peaked at c.21:00, diminishing to form a single crater c. 400m northeast of Litli Hrútur.
Lava is flowing south with an average flow rate of 13m3/s (similar to the 2021 eruption) for the period 11 July to 13 July. As of 13 July 13:38, the lava volume is c. 3.4 million cubic metres covering an area of 0.4km2. Calculations were performed by NLSI from Pleiades satellite images.
The lava composed of vesicular glass, microphenocrysts and microlites of plagioclase, olivine, clinopyroxene and spinel, similar to the 2022 lava. Lava is estimated to have a temperature of c.1190°C. The chemical composition is similar to that of the 2021 and 2022 eruptions: MgO wt.% = 8.5, and, K2O/Ti2O = 0.26.
The gas composition is similar to that of the 2022 eruption, with a high concentration of CO2. The CO2 may have accumulated prior to the eruption. SO2 gas emissions range from 5.4-11.5 ktonnes / day and CO2 is 7.1 – 15 5 ktonnes / day.
If lava continues to flow southwards, it may reach the 2022 lavas in Meradalir.
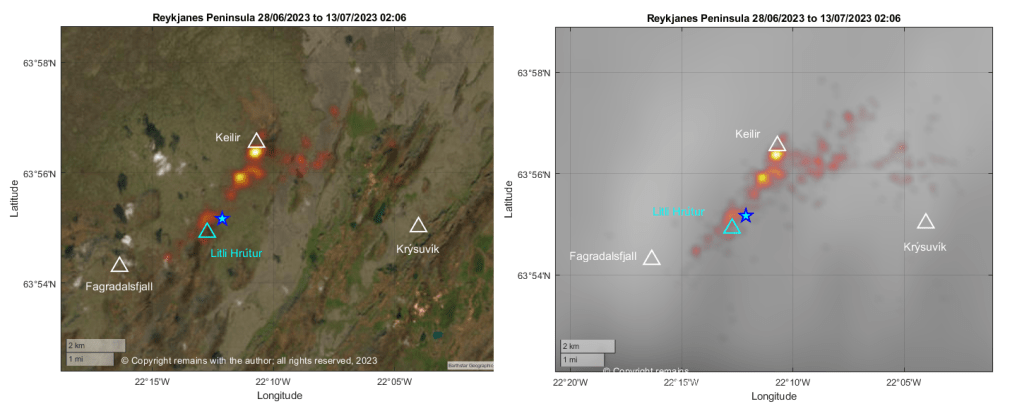
We have updated our earthquake plots to 13th July 2023 02:06, focussing more on the area between Fagradalsfjall, Keilir and Krýsuvík.
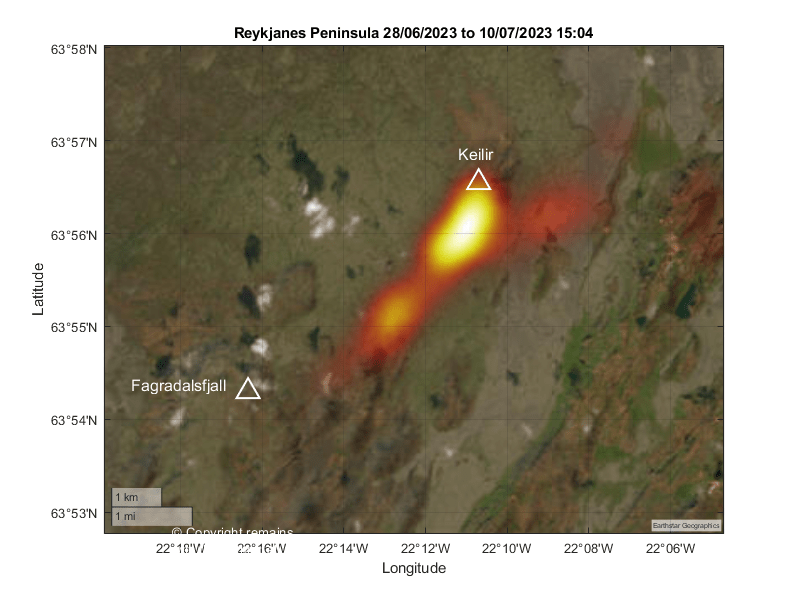
The earthquake density plot is still showing most activity southwest of Keilir and close to the eruption site, which we determined from eyeballing the location of the crater. The area southeast of Keilir is also showing more activity. Whether the activity close to Keilir is triggered quakes, the result of faults moving to accommodate the magma intrusion, or magma-related (or, indeed, both) remains to be seen.
The Icelandic Met Office has confirmed the onset of an eruption on the eastern and northeastern flanks of Litli Hrútur, Iceland. The eruption started around 16:40 today with the opening of three small fissures on a 200m fault. Lava is collecting in a depression then flowing southwards, with gas and steam emissions going northwestwards.
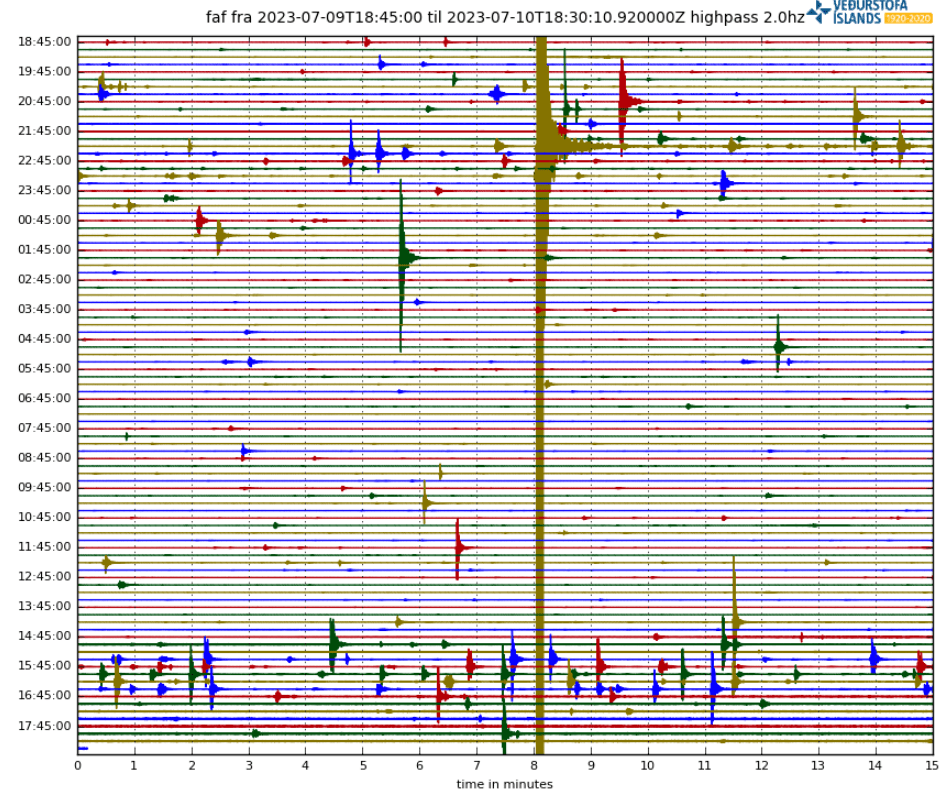
IMO reported noticing a disturbance on the earthquake station at Fagradaslfjall last night and again at 14:00 today similar to those preceding the 2021 and 2022 eruptions.
Fig 3: Helicorder plot for Fagradalsfjall today. Source: IMO
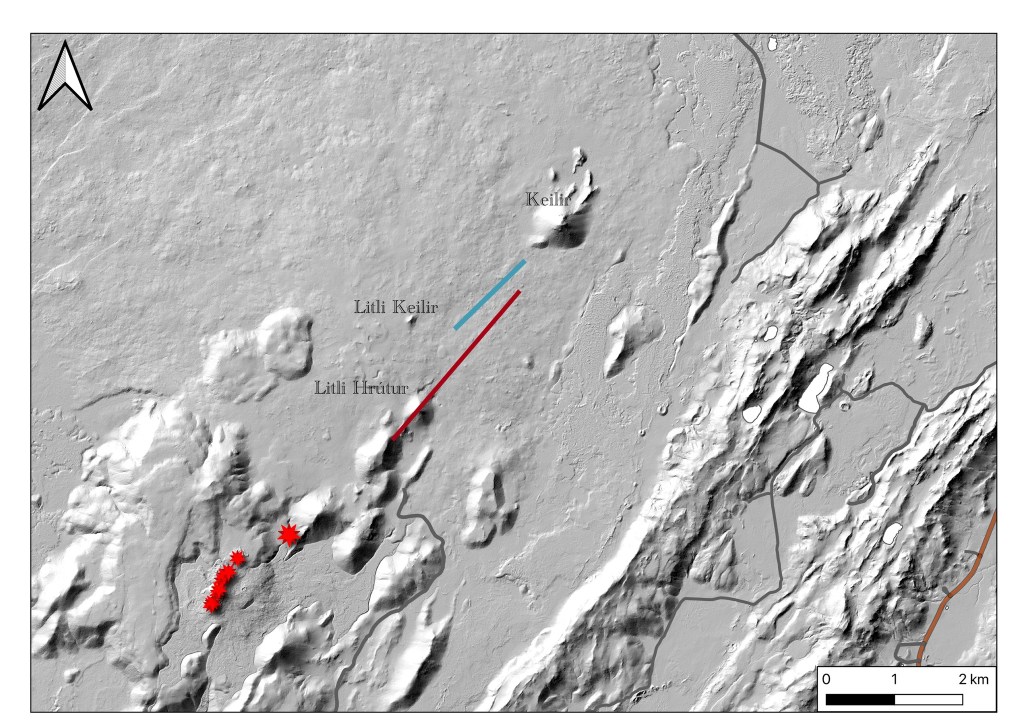
The eruption site appears to be a little east of the southern end of the calculated position of the dyke intrusion.
Fig 4: Calculated position of the dyke instrusion (red line) from IMO. Red stars show the position of earlier eruptions (2021 and 2022). The blue line is the location of surface deformation from ICEYE wave interference images taken 7-8 July. Location of surface fracture and insert model determined by Michelle M. Parks and Vincent Droin, Icelandic Meteorological Office. Photo: Ásta Rut Hjartardóttir, University of Iceland
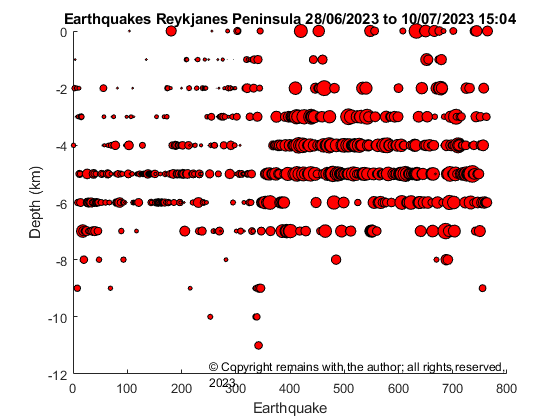
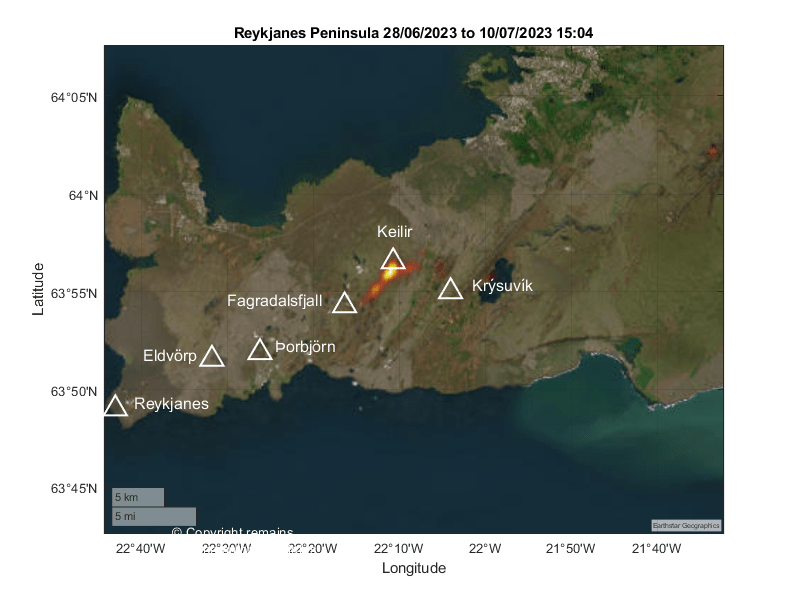
We have updated our earthquake plots from 28th June 2023 to 10th July 2023 15:04 for the Reykjanes Peninsula. We used the 764 confirmed earthquakes published by IMO on https://skjalftalisa.vedur.is/#/page/map. The total number of earthquakes in the swarm was c.12,000 as of 9th July 2023.