The earthquake swarm is continuing on São Jorge as we write, albeit it at a much lower intensity. The swarm is located on the Manadas Fissure system. INVOLCAN has sent a team to assist the local scientists (CIVISA and IVAR). CIVISA advised on 6 April 2022 that volcano-tectonic earthquakes had been detected suggesting magma movement at depth.
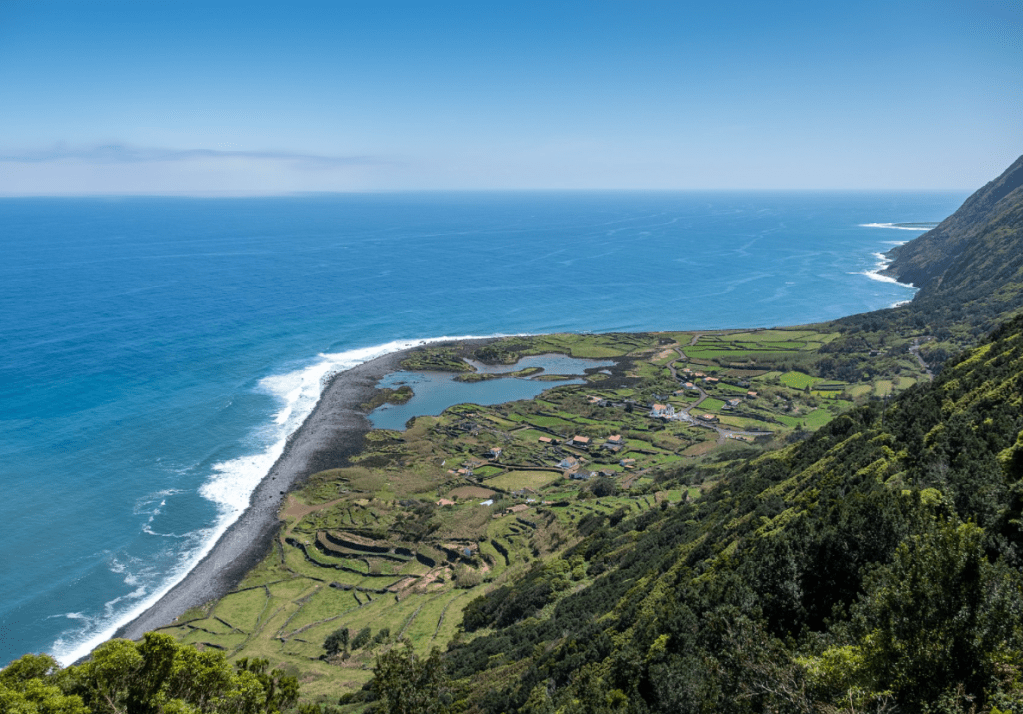
Fig 1: Image of Fajã dos Cubres, São Jorge, Azores, cropped from one by Jules Verne Times Two. Published under CC BY-SA 4.0 (Source: São Jorge Island – Wikipedia).
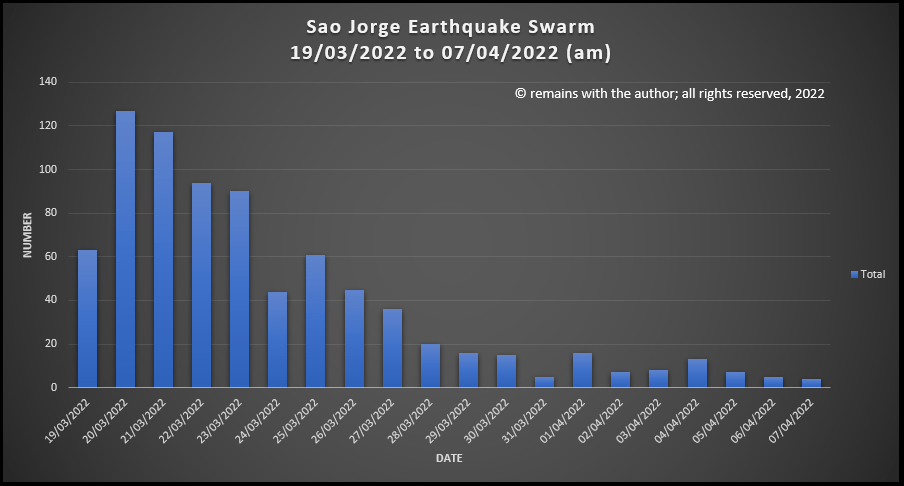
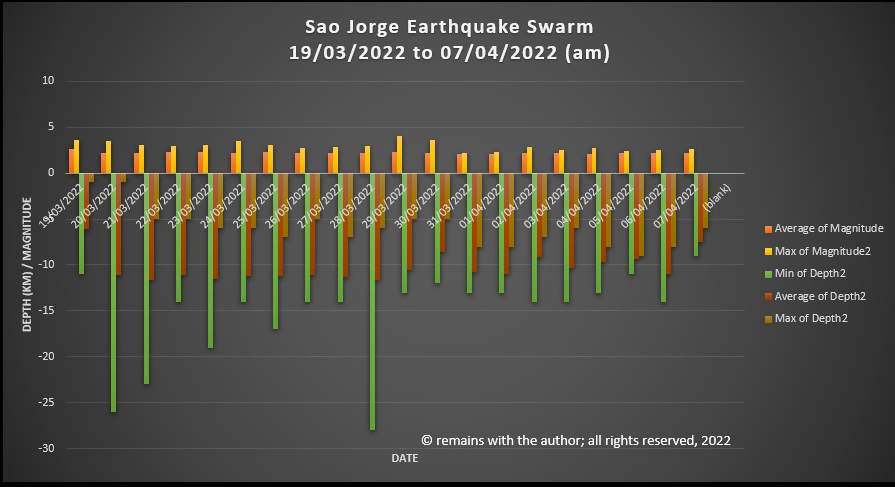
While we wait to see what transpires, here are some statistics.
Number of earthquakes ≥2.0 reported on IPMA’s site: 793
Maximum number: 127 on 20 March 2022
Minimum number: 5 on 31/03/2022 and 06/04/2022 (7/04/2022 is not a complete day)
Maximum magnitude: 4.0 (29/03/2022, 21:56:16, 38.686°N, 28.215°W, 10km)
Maximum depth: 26km on 20 March 2022 and 28km on 28 March 2022.
At the end of 2021 a large earthquake swarm started to the west of the Ok shield volcano in Iceland. At the time of writing the swarm is ongoing. The Icelandic Meteorological Office (IMO) reported on their Icelandic site on 1st February 2022 that there is no evidence of magma intrusion.
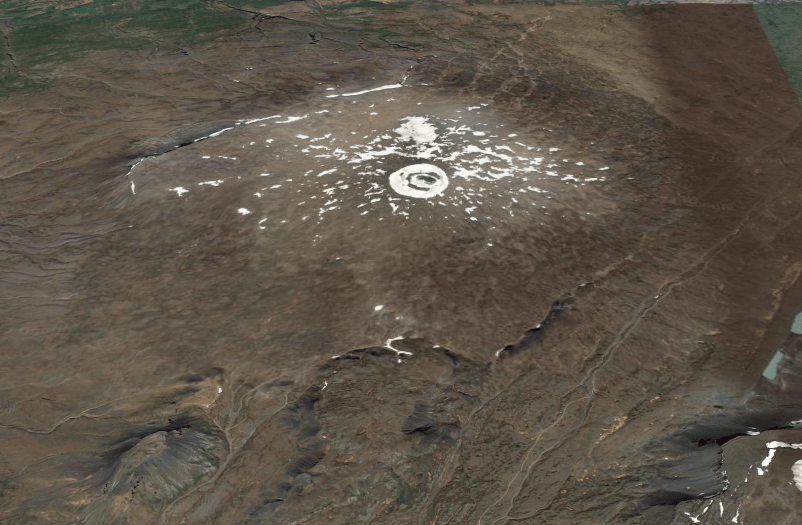
Fig 1: Ok volcano looking northwards, with a small tuya in the foreground. Image from Google Earth. The remnant of the Okjökull glacier is visible with a small lake in its centre at the summit of the volcano. The current swarm is to the west of the volcano.
The swarm is occurring west of Ok in Borgarfjörður in a low temperature region outside the main volcanic and rift area. The earthquakes are thought to be rifting caused by horizontal tension in the crust, here of the North American Plate. The swarm is the largest to date in the region and is continuing at the time of writing. So off we trotted to plot the earthquakes.
What’s in the Area?
We looked at the area 64.2°N, 19.2°W to 65.3°N, 21.8°W which contains the Langjökull ice cap, two Holocene volcanic systems and several Pleistocene volcanic systems.
The Langjökull ice cap is the second largest ice cap in Iceland located at the northern end of the Western Volcanic Zone (WVZ). The WVZ is a slow spreading rift that forms the western boundary of the south Iceland microplate. Sinton et al.’s study in 2005 showed that there is no evidence for the decline in the WVZ in the Holocene; the shield eruptions are long duration with low effusion rates fed by magma from the mantle. c. 40 eruptive units have been located in the WVZ; we are focussing on those in the Langjökull area in the northern part of the zone.
Holocene Volcanoes
Volcano
Latitude
Longitude
Last Known Eruption
Dominant Rock Type
Prestahnúkur
64.583
-20.666
3350 BCE
Basalt / Picro-Basalt
Langjökull
64.85
-19.7
950 CE
Basalt / Picro-Basalt
Prestahnúkur is west of the Geitlandsjökull glacier in the south west part of Langjökull. It is a 90 km ling 15 km wide fissure system with a rhyolitic peak, on a Pleistocene basaltic plateau. The central volcano is a hyaloclastite massif; it has shield forming olivine tholeiite basaltic effusive eruptions, with some rhyolite. The fissures extend southwest-north east, reaching under the Þórisjökull and Geitlandsjökull glaciers. There is a parallel sub swarm of tuyas 4–6 km west of the main swarm. The last significant eruption of the central volcano was in the Pleistocene and on the fissures c.900 CE. The Holocene eruptions occurred on rift zones to the north and south west of the volcano.
Langjökull comprises the Hveravellir central volcano and a 100 km long and 20 km wide fissure system. A 600m thick ice cap partly covers the system. The central volcano is another hyaloclastic massif with a silicic component. It has had six recorded Holocene eruptions: 2 VEI 2, Hallmundahraun 950 CE and Kjalhraun 5850 BCE; and, 4 VEI 0, Lambahraun 2050 BCE, Krákshraun 2550 BCE, Strytuhraun 3550 BCE and Leggjarbrjótur 8600 BCE. The Hallmundahraun lava flow covers 240 km2 . Kjalhraun is a shield which erupted 11km3 lava 7,800 years ago. The dominant magmas are olivine tholeiite basalt.
Skjaldbreiður is a shield volcano that lies in the southern part of the Langjökull system. It erupted 13km3 of basaltic lava in the early Holocene. The lava flows formed the basin of Þingvallavatn and Þingvellir, where Iceland’s parliament, the Alþing, was founded in 930.
Pleistocene Volcanoes
Volcano
Latitude
Longitude
Primary Volcano Type
Geysir
64.32
-20.3
Stratovolcano
Hlöðufell
64.93
-20.53
Tuya
Þórisjökull
64.53
-20.7
Subglacial
Ok
64.62
-20.88
Shield
Eiríksjökull
64.77
-20.4
Tuya
Hrútfell
64.73
-19.72
Tuya
Bláfell
64.492
-19.87
Tuya
Hreppar
64.42
-19.5
Fissure vent(s)
The Geysir geothermal area lies in the Haukadalur basin near the southern end of the Langjökull system. Earthquake activity in June 2000 temporarily activated the normally somnolent Grand Geysir
Eiríksjökull is Iceland’s largest tuya.
Ok erupted during interglacials in the Pleistocene. It used to have a summit glacier, the Okjökull, whose disappearance has been attributed to climate change. Local volcanologists have reminded us that the ash from the 2010 Eyjafjalljökull eruption would have contributed to ice loss. “Not Ok” was a documentary about the lost glacier. Ok overlies some of the tuyas of the sub swarm to the west of Prestahnúkur.
Hreppar is two NE-SW trending ridges which extend from the rhyolitic Kerlingarfjöll volcano located SW of the Hofsjökull ice cap.
Recent Seismic Activity
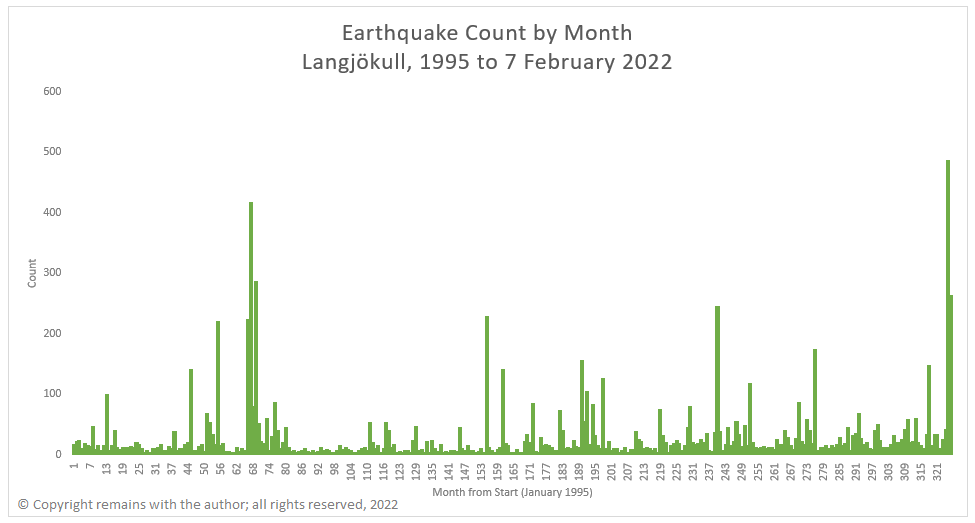
As we have extended our database of Icelandic earthquakes back to 1995, we have plotted the earthquakes for the period from 1995 to 7th February 2022 for the area 64.2°N 19.2°W to 65.3°N 21.8°W.
There is a relatively low level of background activity compared to the other volcanic regions of Iceland. However, the following months each saw more than 200 earthquakes: 55 (July 1999) near Þórisjökull and Prestahnúkur , 66 (June 2000) near Geysir, 67 (July 2000) near Geysir, 69 (September 2000) near Geysir, 155 (November 2007) near Hveravellir and Geysir, 240 (December 2014) near Geysir, 325 (January 2022) near Ok and 326 (February 2022) near Ok. Note: that February 2022 is only one week.
We noted six warms to the west of Ok, including the current swarm. They appear to be aligned along a rift / fissure. The current swarm near Ok is one of the largest in the database to date.
It’s not clear from the plots, themselves, whether or not there is any magma movement associated with the current swarm or, indeed, any of the other activity identified. The size of the current swarm indicates that something may be going on near Ok. Only time will tell if volcanic activity will ensue. In the mean time, the plots do shed some light on the activity along rifts associated with plate seperation.
Icelandic Meteorological Office: www.vedur.is for raw earthquake data
Kristján Sæmundsson (Iceland GeoSurvey) (2019). Prestahnúkur. In: Oladottir, B., Larsen, G. & Guðmundsson, M. T. Catalogue of Icelandic Volcanoes. IMO, UI and CPD-NCIP. Retrieved from http://icelandicvolcanoes.is/?volcano=PRE
Guðrún Larsen and Magnús T. Guðmundsson (Institute of Earth Sciences – Nordvulk, University of Iceland) (2016): Langjökull, Hveravellir. n: Oladottir, B., Larsen, G. & Guðmundsson, M. T. Catalogue of Icelandic Volcanoes. IMO, UI and CPD-NCIP. Retrieved from http://icelandicvolcanoes.is/?volcano=LAN
John Sinton, Karl Grönvold, Kristján Sæmundsson, “Postglacial eruptive history of the Western Volcanic Zone, Iceland”, Geochemistry, Geophysics, Geosystems, AGU, Volume 6, Issue 12, December 2005, https://doi.org/10.1029/2005GC001021
For the Pleistocene volcanoes we consulted Wikipedia and the Smithsonian Institution – Global Volcanism (www.volcano.si.edu/)
Seismic activity at Fagradalsfjall, Iceland, has remained low. The recent swarm is now considered over. The aviation code has been lowered to yellow as a result.
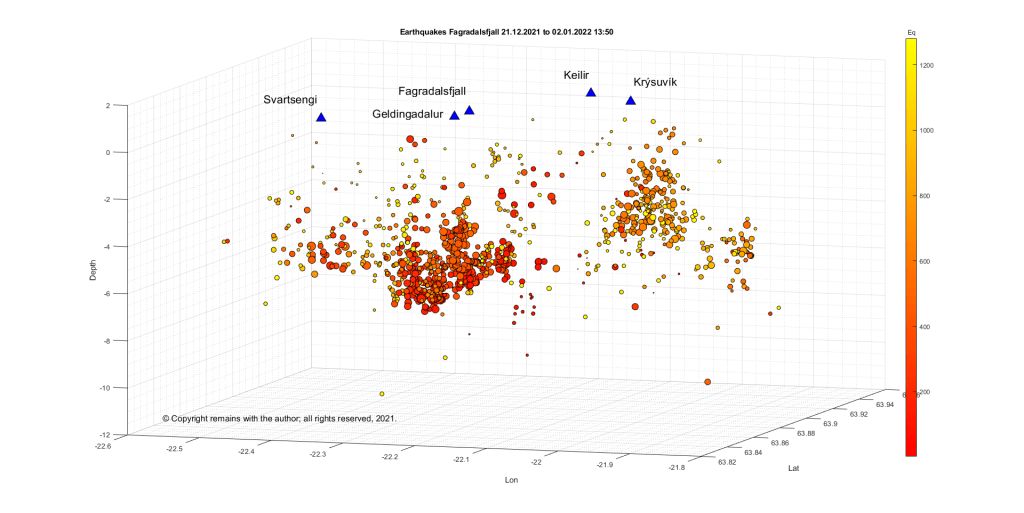
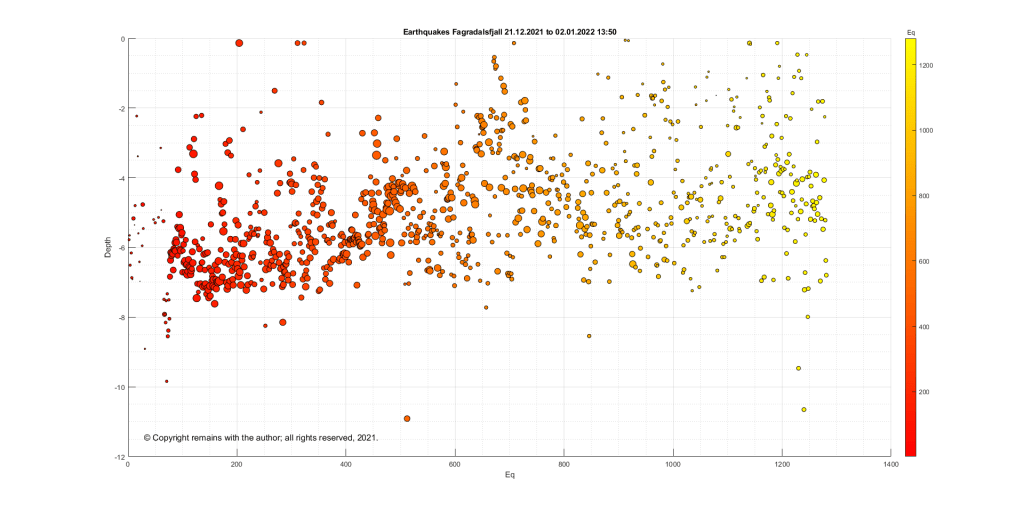
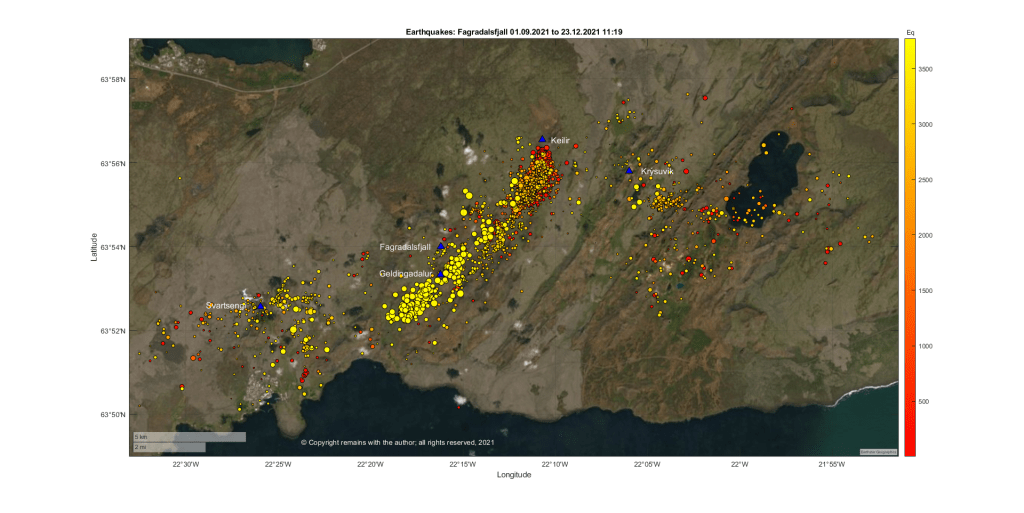
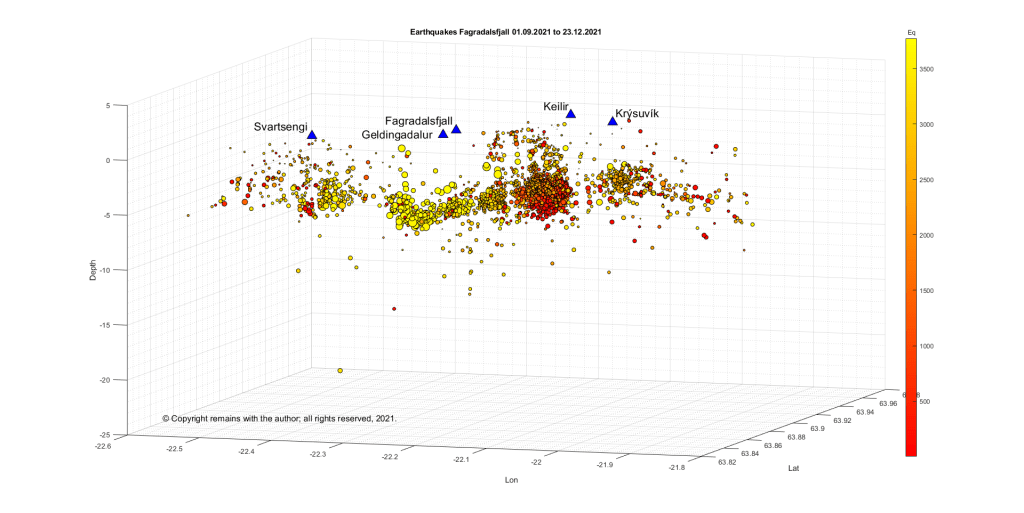
We have updated the earthquake plots for Fagradalsfjall, Iceland, for the swarm which started on 21 December 2021.
The swarm had an intense initial period while magma moved along a lateral dike, followed by a less intense period, accompanied by magma ascent. The Icelandic Met Office, IMO, say that the swarm is following the same pattern as that which preceded the eruption in March 2021.
Magma is ascending under Fagradalsfjall, itself. The outlying earthquakes, e.g., at Svartsengi and Krýsuvík, are what Iceland calls triggered earthquakes. Triggered earthquakes are tectonic in nature, arising as local faults respond to magma movement.
Following a drop in seismicity over the past couple of days, visitors are now advised to avoid the area.
A similar drop in seismicity was observed immediately before the March 2021 eruption.
If the volcano does erupt again, this would be considered a new eruption in the same place; the earlier eruption was declared over three months after the cessation of activity on 19 September 2021.
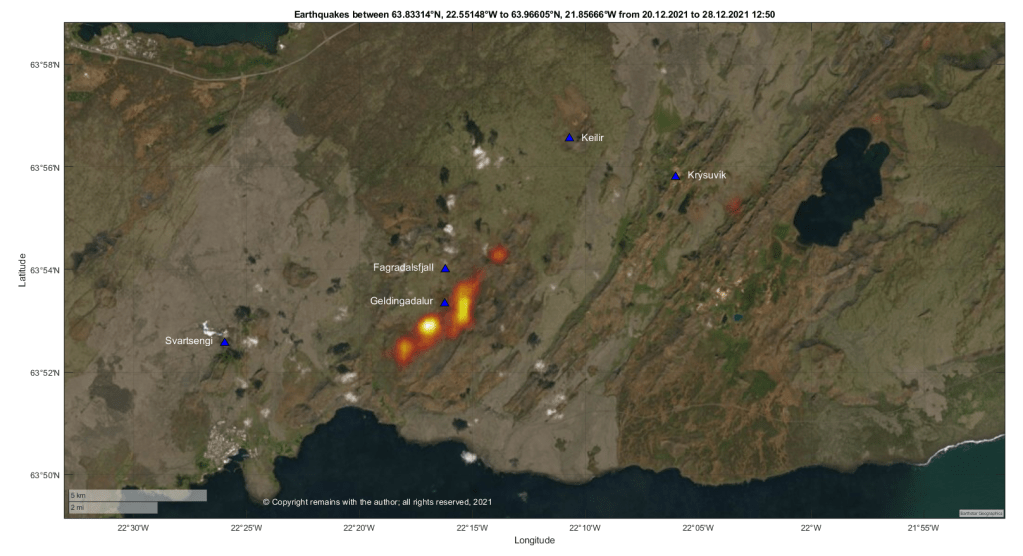
Update 28/12/2021
The earthquake swarm at Fagradalsfjall, Iceland, is continuing. While the swarm has slowed down a bit, 19,000 earthquakes have been recorded by the automatic SIL system since the swarm started. 14 earthquakes over 4.0 magnitude have occurred. An alert for the risk of rockfall and landslides in the area has been raised; visitors are advised to stay away from the area.
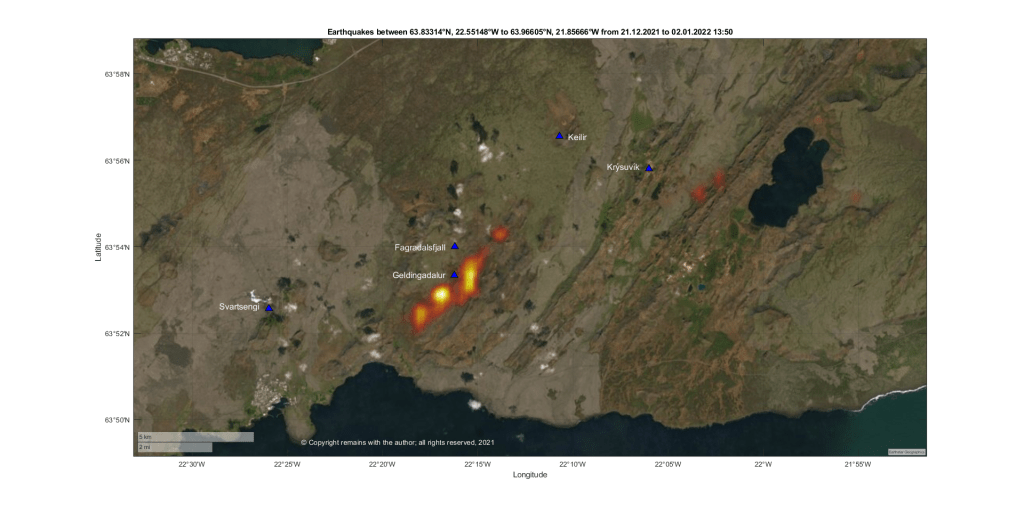
We have plotted the confirmed earthquakes from 20 December 2021 to 28 December 12:50. This shows the dike propagation south west of Geldingadalur, with additional activity near Kýsuvík and Svartsengi.
Only time will tell where and when lava will emerge. In the meantime, if you are lucky enough to be in the area, be aware of the risk of rock fall and landslip.
A large earthquake swarm started at Fagradalsfjall late on 21 December 2021, 2-4 km NE of Geldingadalir, thought to be caused by a lateral dike intrusion. Due to the increased seismic activity, the aviation code was raised to Orange yesterday, 22 December 2021.
Fig 1: Icelandic Met Office, IMO’s map of the swarm. Source: IMO
The eruption at Fagradalsfjall had stalled on 18 September 2021, with no new lava flows to the time of writing. Ground deformation indicated that magma was still flowing into the crust.
Fig 2: Ground deformation at Krýsuvík. The red line denotes the start of the March 2021 eruption. Source: IMO
We have downloaded and plotted the earthquakes from 1 September 2021 to 23 September 2021 (source for raw data: IMO ). This includes the swarm which started near Mount Kelir in late September 2021, which may or may not have heralded the current reactivation of the dike.
The alert level has been lowered to Yellow. To date no eruption has followed the jökulhlaup or increased seismicity. As Grímsvötn may erupt with little warning, the situation remains closely monitored.
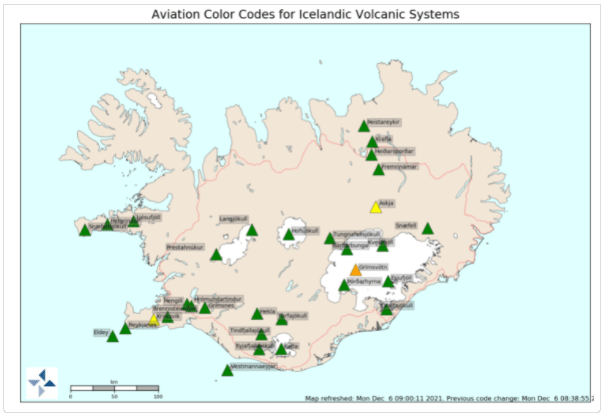
The alert level for Grímsvötn has been raised to orange following the draining of the caldera lake over the past few days, the resulting jökulhlaup, and increased seismicity today.
Fig 2: Aviation codes for Icelandic Volcanoes. Grímsvötn is orange. Source: IMO
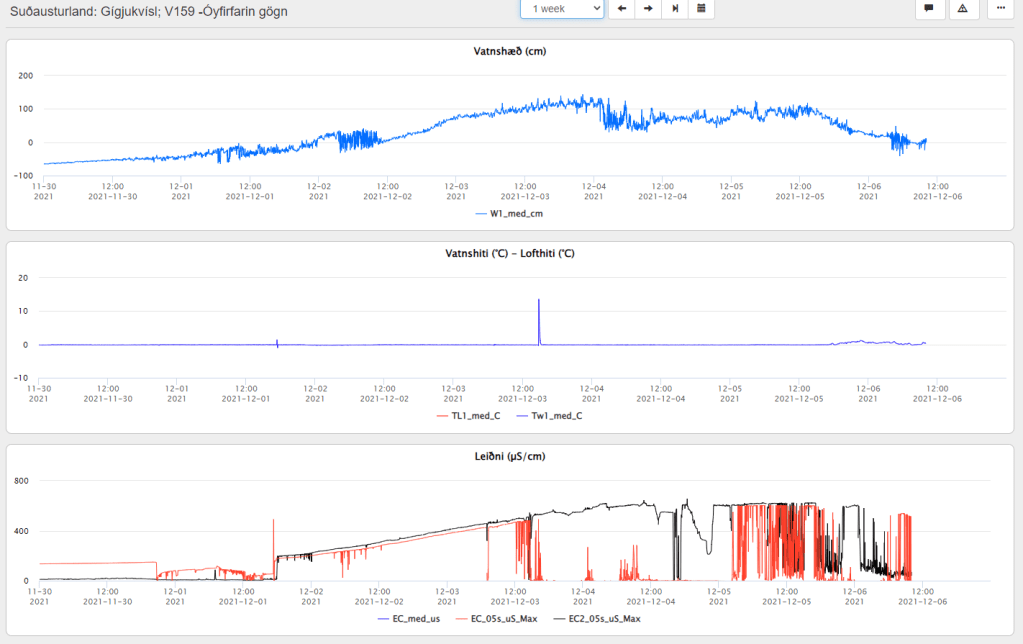
The ice-cap has subsided by c. 77 metres. The water drained via the Gígjukvísl river; the discharge in Gígjukvísl river yesterday around noon was 2800 m3/s, reducing later in the day.
Fig 3: Measurements of the jökulhlaup as it impacted the Gígjukvísl river. Source: Línurit (vedur.is)
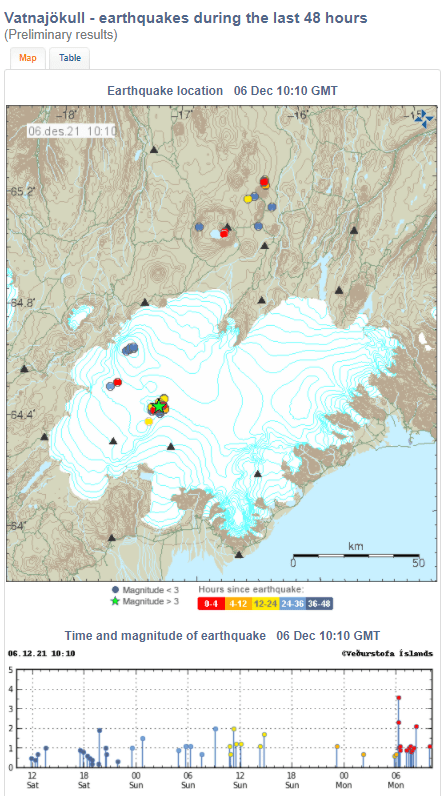
At the time of writing, there have been 25 earthquakes in the last 48 hours in the vicinity of Grímsfjall. A magnitude 2.3 occurred at 06:15, followed shortly afterwards at 06:16 by a magnitude 3.6. There have been a few aftershocks. No volcanic tremor has been detected.
Fig 4: Map of earthquakes at Vatnajökull. Grímsfjall is roughly where the green star is; the green star is the location of the 3.6M earthquake. Source: Vatnajökull (vedur.is)
Volcanic eruptions have occurred after draining of the caldera lake in the past, attributed to the sudden decrease in pressure destabilising the system; IMO cite the 2004, 1934 and 1922 eruptions.
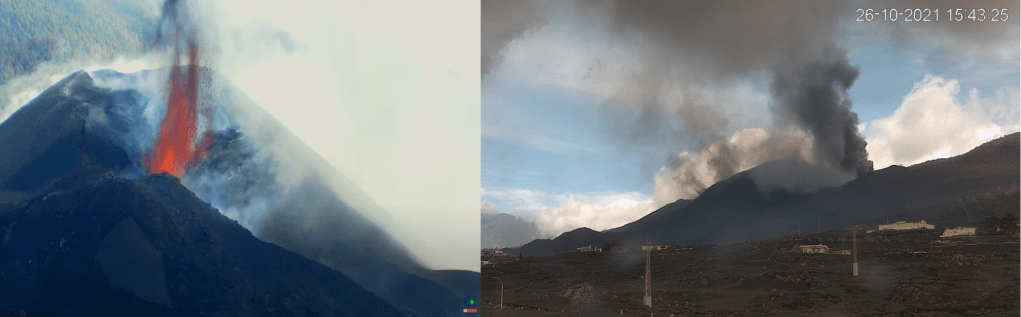
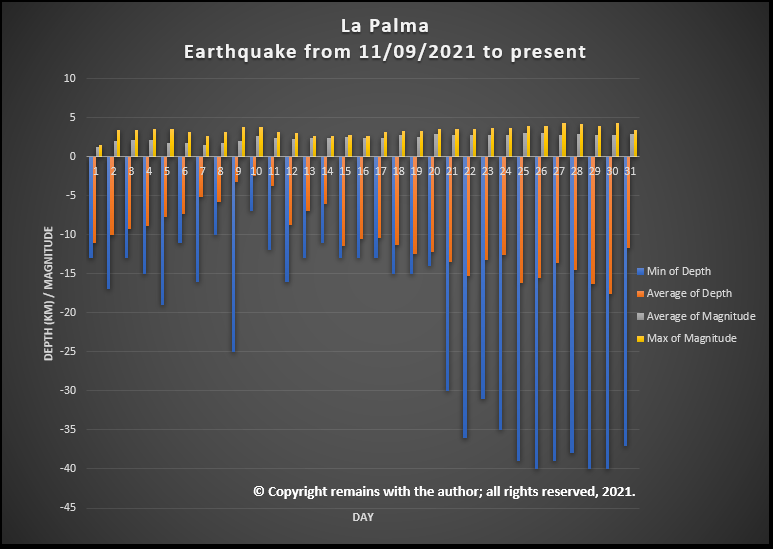
It has been a week since we updated our last earthquake plots for La Palma so time to take another look. The eruption has continued in the meantime, with seismicity and seismic signals increasing. Earthquake activity continues mainly within the two levels 7 -16km and 30 to 42km identified in our previous plots.
Several partial collapses of the main cone have occurred. The latest was yesterday, releasing a large amount of the lava to the west, which went over existing lava flows.
The latest statistics reported on 26th October 2021 are:
908.2 hectares of land have been affected by lava.
2,162 buildings haven been destroyed by lava, with a further 124 suffering damage.
66.2km of roads have been lost, with a further 3.4km damaged.
6,800 hectares of land have been covered by ashfall (reported 22nd October 2021).
Cost of lost banana plantations c.100m Euros, 150 hectares are under lava and others are in the exclusion zones; other crops, vineyards and livestock farming are also impacted.
SO2 emissions 40,800 tons per day. CO2 emissions up.
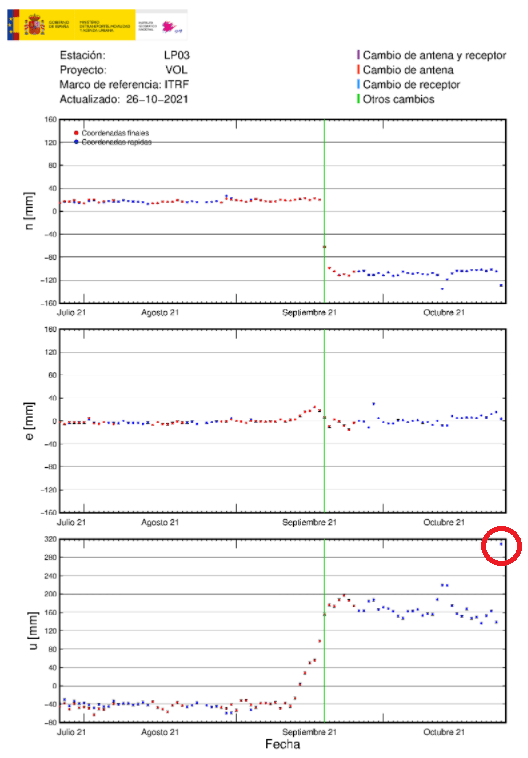
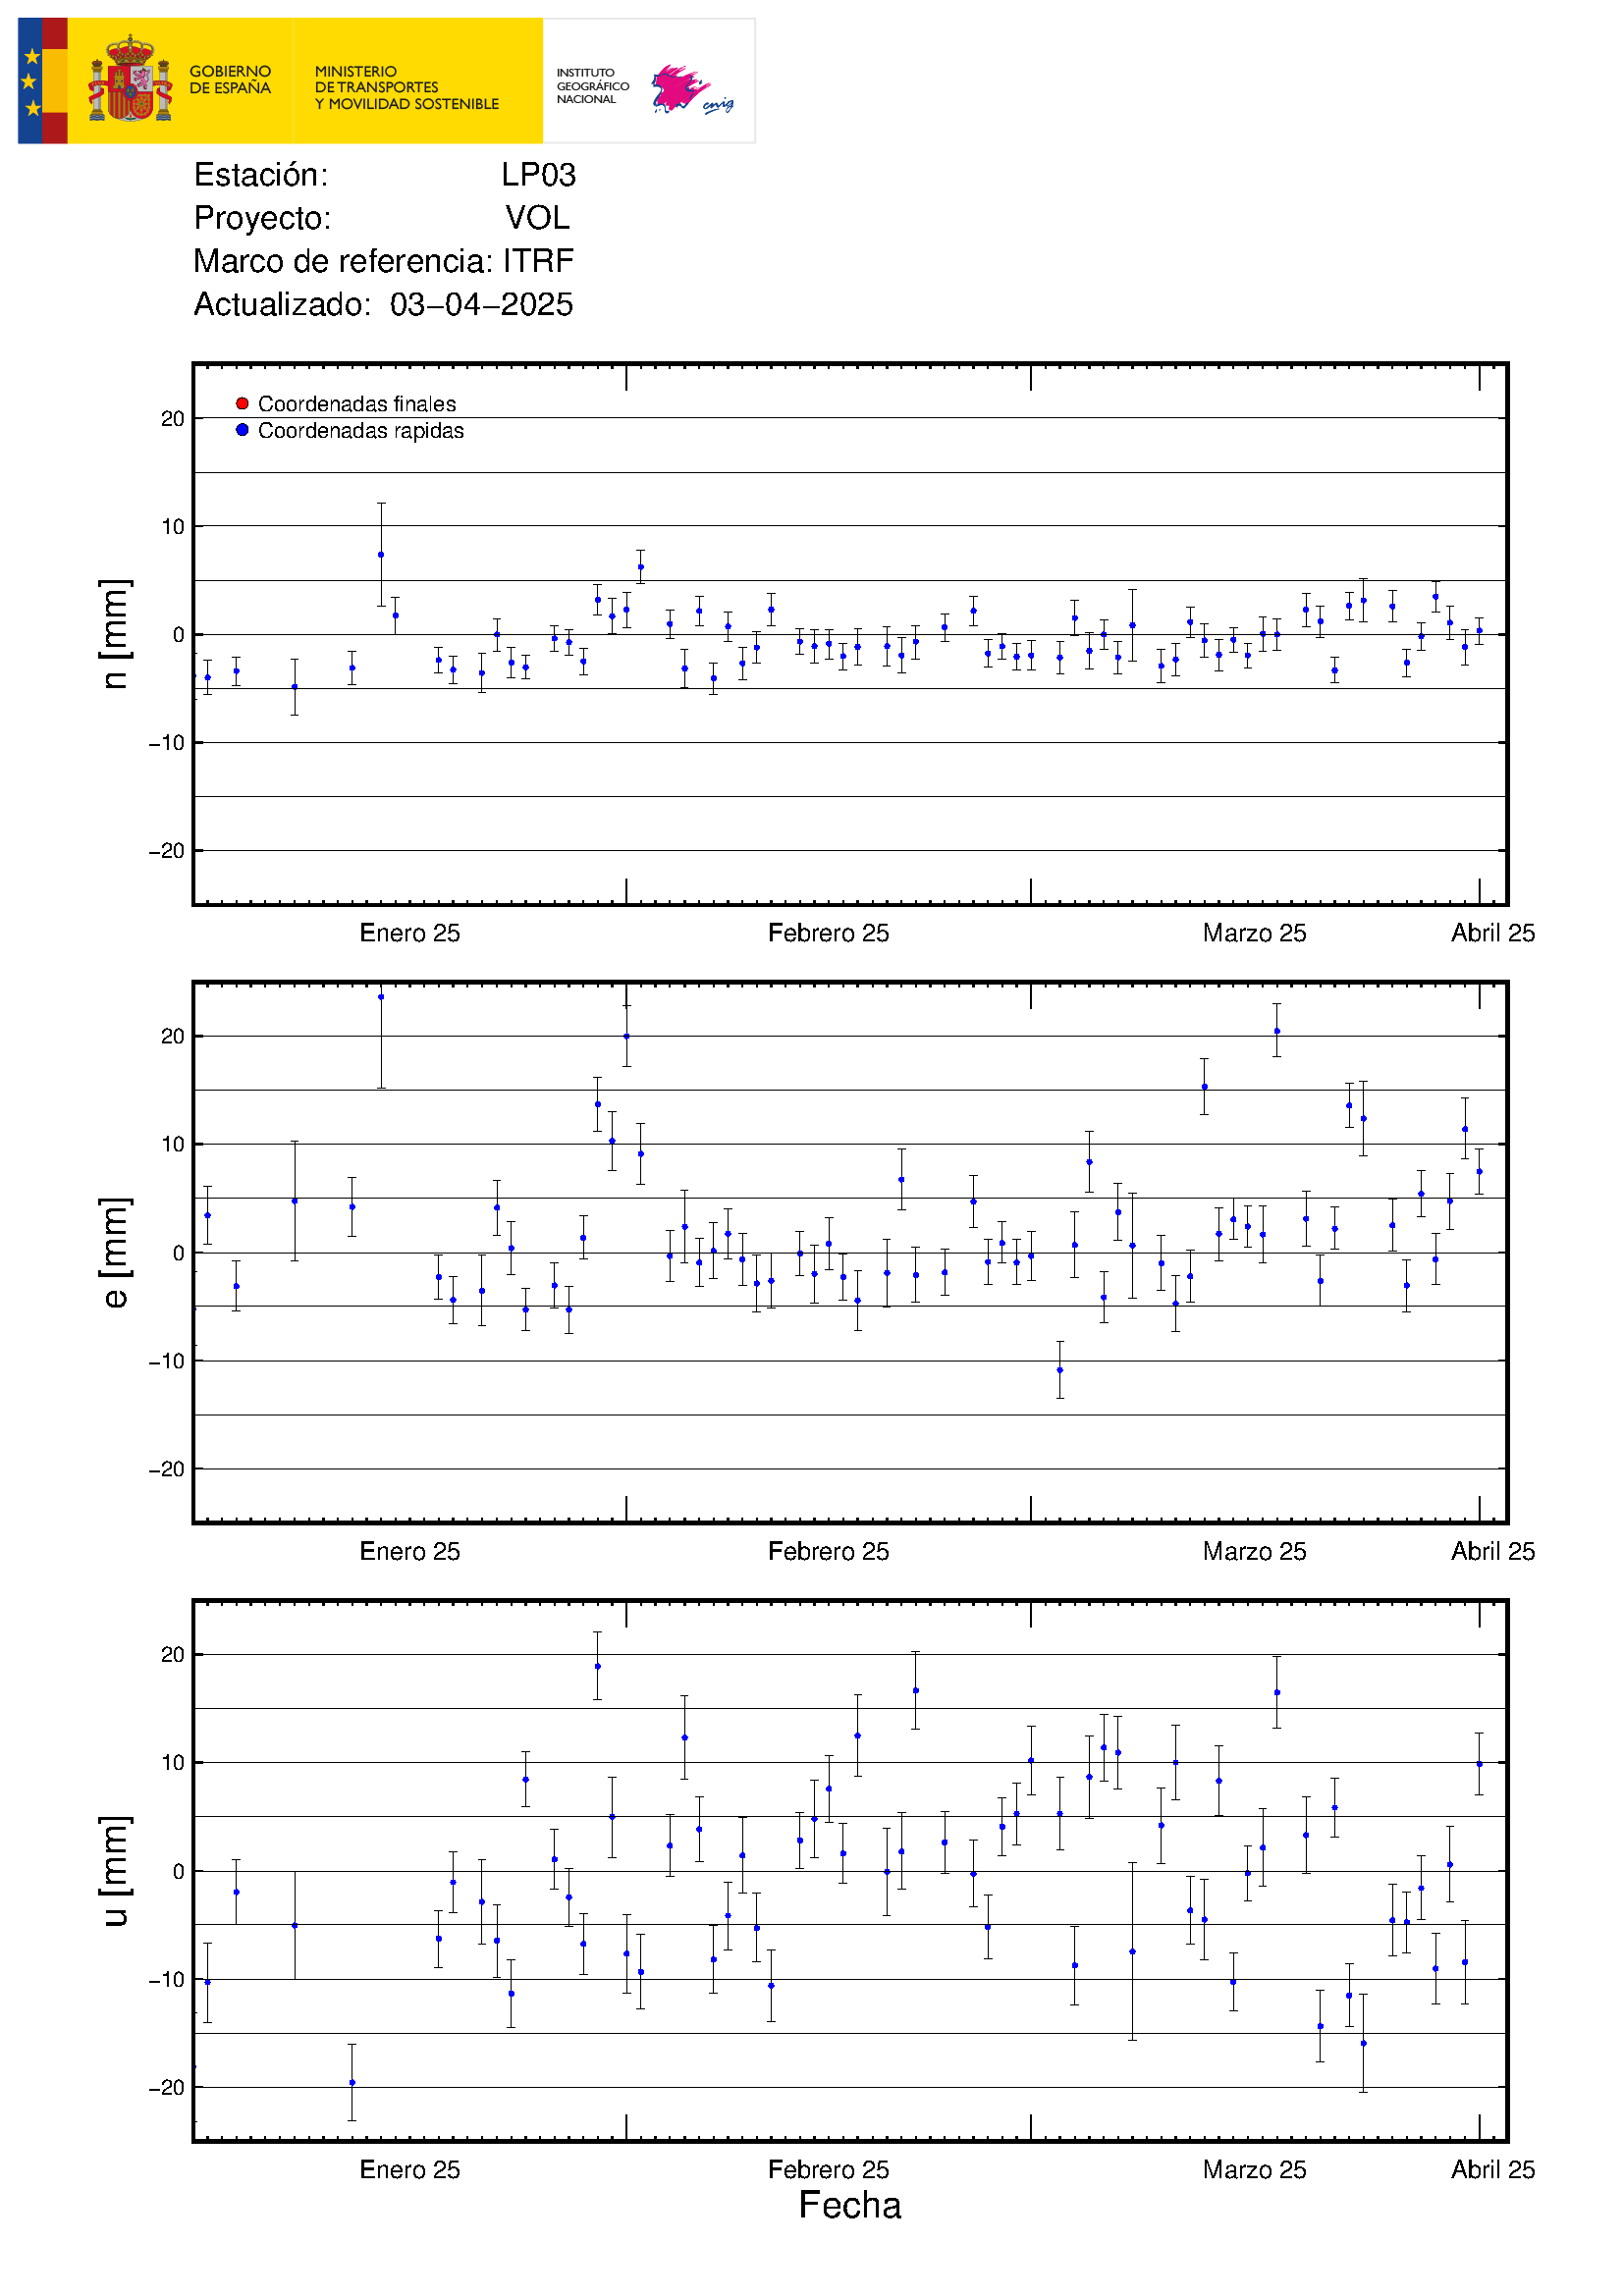
In the last 24 hours ground uplift of 10cm has been recorded at the station on the south of the volcano near the eruption site, which the volcanologists monitoring the eruption think may signal an increase in lava flow or the opening of a new vent.
Fig 2: Ground deformation at the station nearest the eruption site. We have circled the latest data point to make it easier to spot. Green line marks the onset of the eruption (added by IGN). Source: IGN
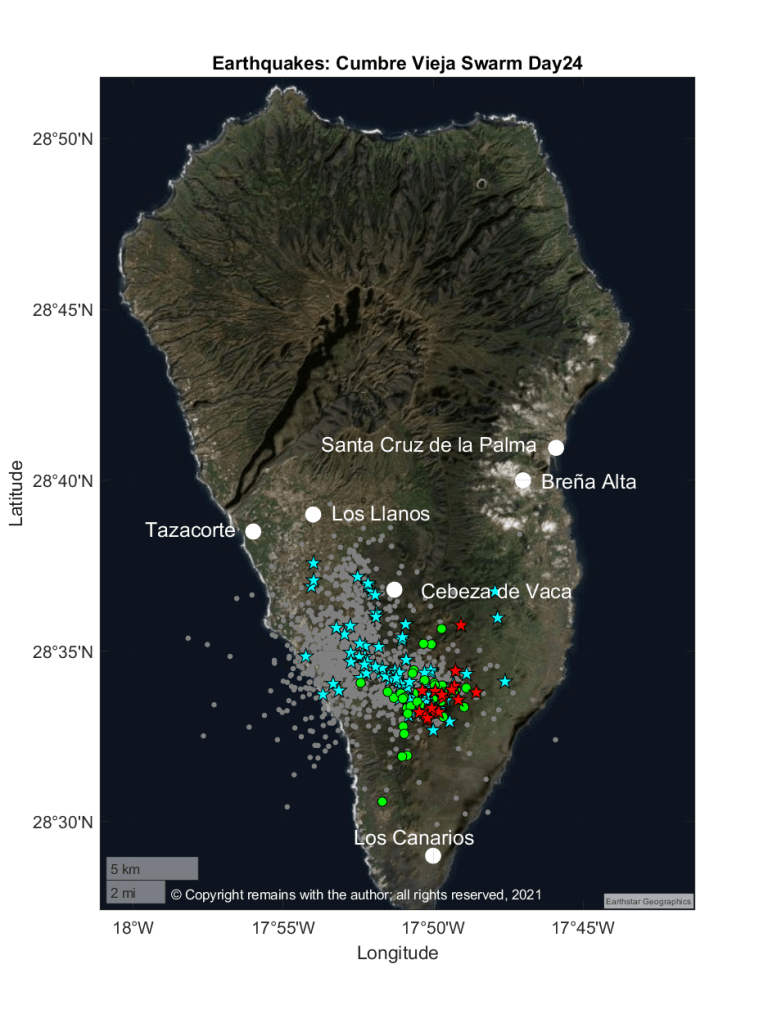
We have made geoscatter and scatter plots of the swarm from day 21, the onset of the deeper earthquakes. We have also made plots of the earthquakes over 3.0M, as these tend to get lost in the in the middle level swarm (7-16km).
There are now a few earthquakes between the two swarms but little in the way of reported earthquakes heading for the surface; the latter may mean that lava is flowing freely through the existing conduit, or that a new conduit may be in the offing. The hike in ground deformation reported above near the eruption site may indicate that whatever ensues, it is likely to be near the current eruption site – speculation on our part.
The eruption is now in its sixth week, lasting longer than recent previous eruptions, with no sign of waning. Has the initial eruption of magma created the right conditions for new magma to erupt from a greater depth, e.g. by creating a pathway for it and/or removing some of the constraining pressure? Only time, and a lot of research by the experts, will tell.
The eruption at Fagradalsfjall has halted. No lava has been erupted in the period 18 September to 18 October 2021 (or to the time of writing). The seismic swarm at Kelir has lessened. Gas emissions have decreased. The aviation code has therefore been lowered.
The eruption will not be declared over for some time. It is not possible to tell if this is a temporary lull or the eruption has ended; the eruption may resume at the same location in Fagradalsfjall or at a new fissure. As the authorities have pointed out, this can only be determined in retrospect.
The volcanic hazards are currently: gas, high temperatures both in the area and the lava field, earthquakes and rockfalls.
It’s been a few days since we looked at the latest earthquake swarm at Kelir, which is on-going. Here are the updated plots.
We are no longer updating this post; future updates will be included in new posts.
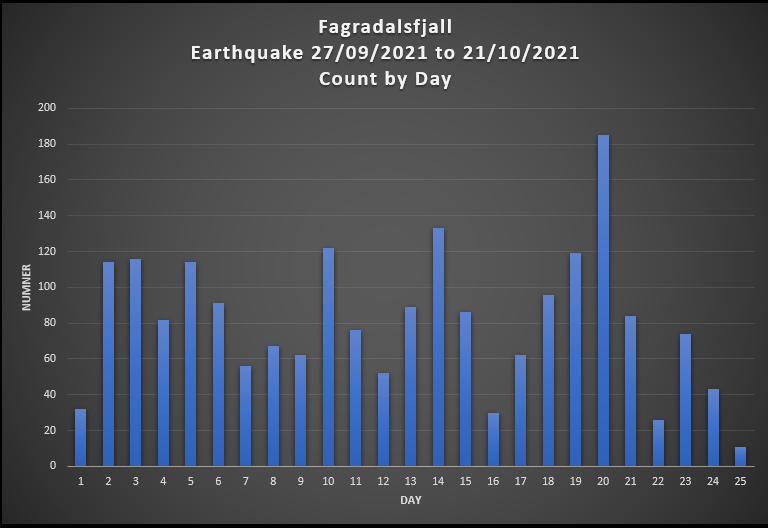
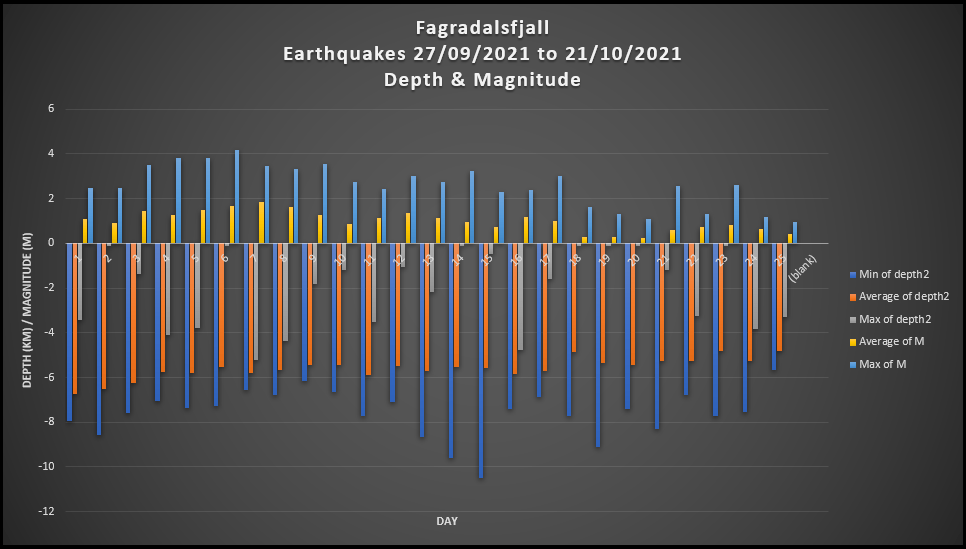
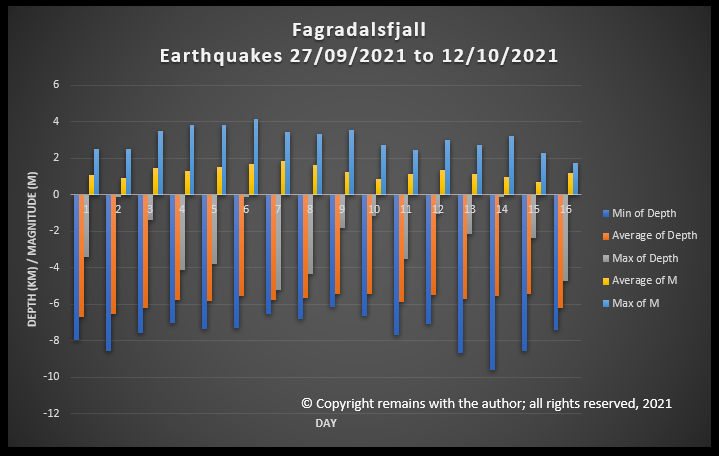
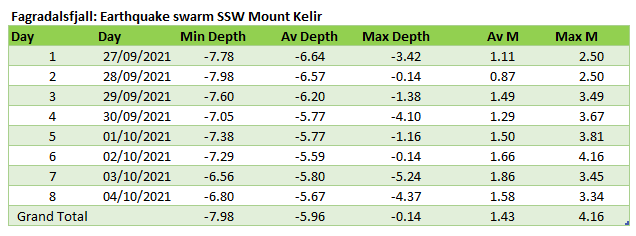
Update 2 12.10.2021: Plots of the Earthquake Swarm SSW of Mount Kelir, 27/09/2021 to Date
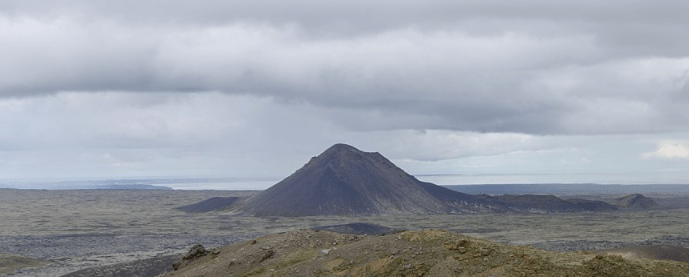
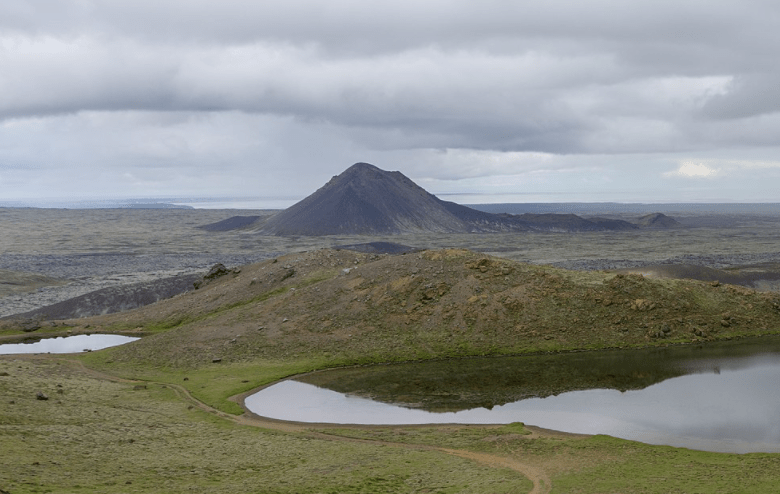
Fig 16: Mount Kelir, cropped from an image by Michal Klajban, published under CC BY-SA 4.0. Source: Wikimedia Commons
Mount Kelir is at the northern end of the earthquake swarm which started on 22 February 2021. In that swarm, earthquakes started near Mount Kelir and migrated towards and beyond Fagradalsfjall prior to the eruption at Geldingadalir on 19 March 2021.
The current swarm which started on 27 September 2021 near Mount Kelir is ongoing at the time of writing. Over 10,000 earthquakes have been recorded, of which IMO have confirmed c. 1,245. It is thought that an eruption may ensue near Mount Kelir.
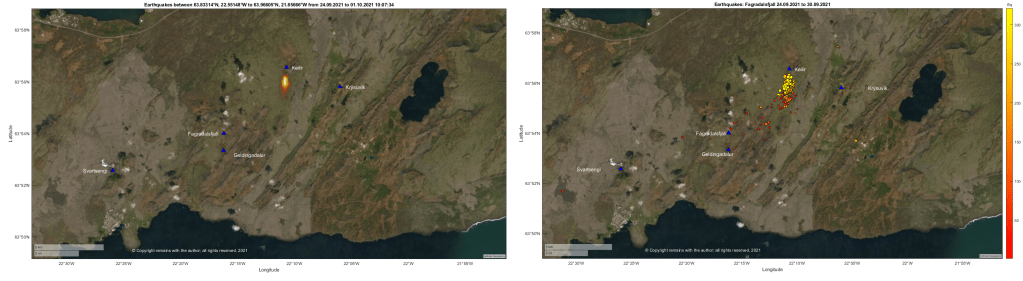
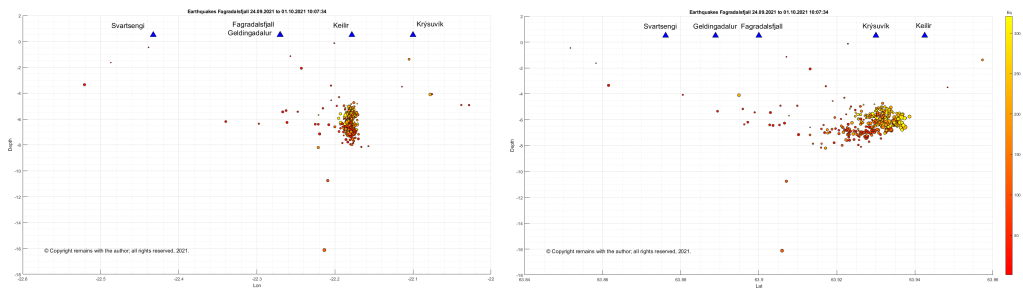
We have plotted the earthquakes and made a video of the geoscatter and scatter plots.
Whether or not a new eruptive site emerges, magma migrates to the existing site at Fagradalsfjall, or, it all quietens down, only time will tell. At the moment the swarm is migrating SSW.
Source for raw earthquake data: Icelandic Met Office: IMO
12.10.2021 1: Update on La Palma Seismicity
Good Morning!
Let’s take look at status of the eruption and seismicity at La Palma.
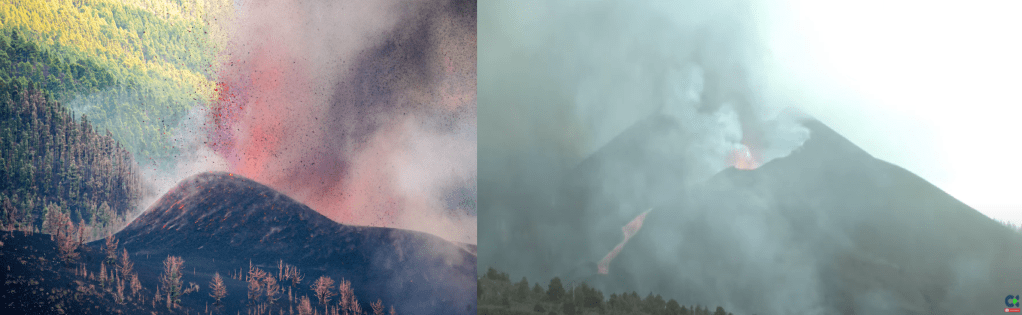
The eruption is still going strong. The cone has grown substantially, despite partial collapses.
Fig 11: Cone growth. On the left, the new cone on 20 September, 2021, cropped from an image by Eduardo Robaina, published under CC BY-SA 3.0; on the right, screen shot earlier today from RTVC
The following was reported earlier today:
The lava reached the cement works, Callejón de la Gata, today. Local residents were confined to their homes due to the risk of toxic fumes from burning chemicals.
A large volume of lava was emitted after the wall of the lava lake [cone?] was destroyed.
The northern arm of the lava flow is now 300 metres from the sea and expected to make a new lava delta near the beach of Perdido.
591.1 hectares have been affected by lava. This includes 132 hectares of crops , of which 70 hectares were banana crops; 33 hectares vineyards; and, 8 hectares avocado crops.
The maximum width of the lava flow is 1,520 metres.
1,281 buildings have been impacted, of which 1,186 have been destroyed.
The lava delta is now 34 hectares.
Seismicity remains high. To date, over 35,000 earthquakes have been recorded. The most recent earthquakes remain below 10km, with depths reaching more than 20km.
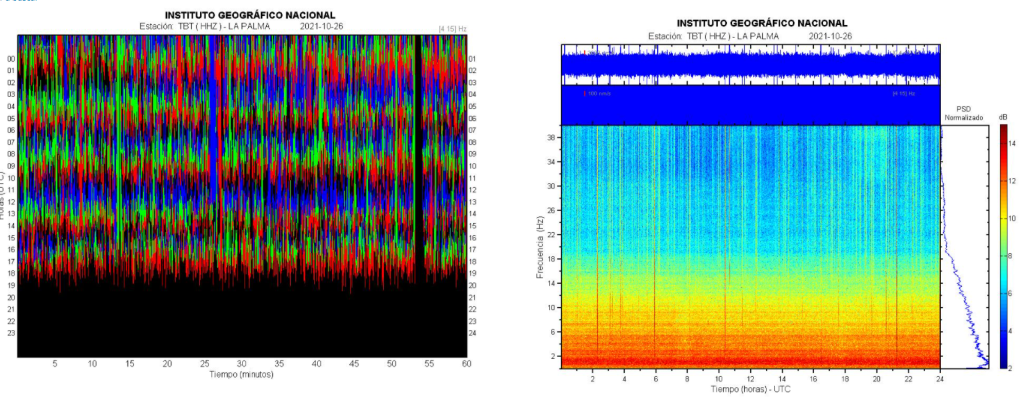
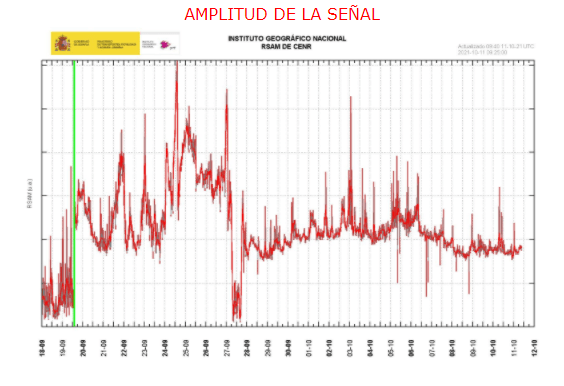
The high level of seismicity is thought to indicate rising magma because there have been spasmodic tremors and a strong volcanic tremor at 18 Hz; the latter may be from depressurisation of magma at a depth of c. 10km. In the absence of increased ground deformation, it is not known when or how magma may reach the surface. If it reaches the surface, it may follow the current conduit or emerge at new fissures.
Fig 12: Amplitude of seismic signal, source: IGN. Green line denotes onset of the eruption.
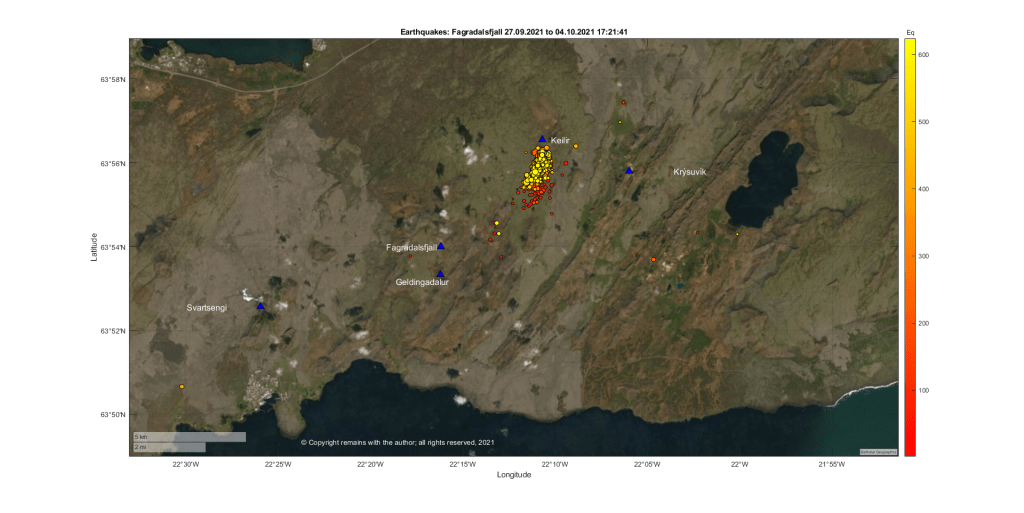
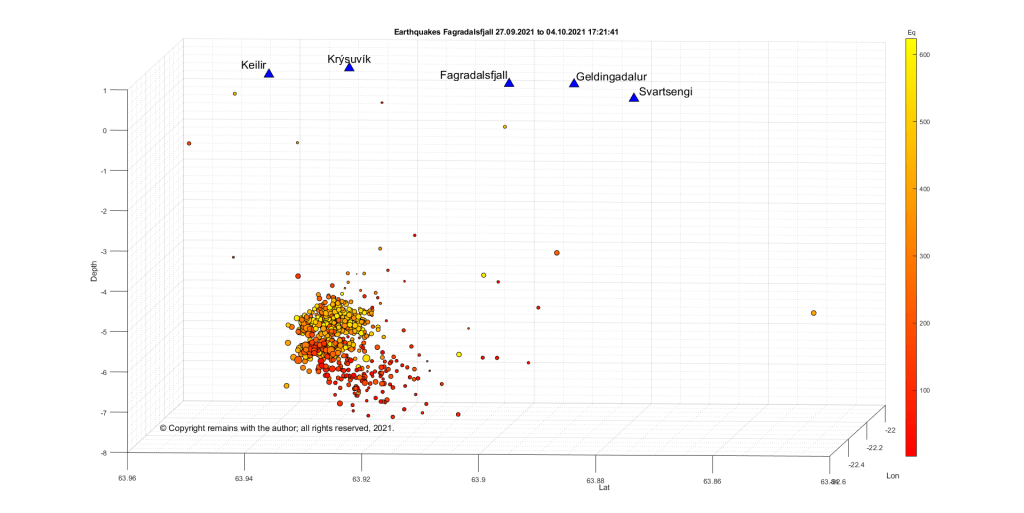
04.10.2021: Update Fagradalsfjall Seismic Swarm near Kelir
The swarm near Mount Kelir is ongoing. IMO report that 6.200 earthquakes have occurred in the swarm, although c.624 have been confirmed at the time of writing (Sources: IMO_Earthquakes and Skjálfta-Lísa (vedur.is)).
We have analysed and plotted the swarm. It would appear that the swarm is ascending but still in the crust. The largest earthquake with a magnitude of 4.16 had a depth of 5.669 km.
Good Morning! Today we provide an update on Fagradalsfjall, Cumbre Vieja (with video of earthquake swarms) and Askja.
Fagradalsfjall, Iceland
Fig 1: Mount Kelir, cropped from an image by Michal Klajban, published under CC BY-SA 4.0. Source: Wikimedia Commons
Fagradalsfjall celebrated the six-month anniversary of the start of the eruption, which occurred on 19 March 2021, by taking a break. Low level activity has been observed since 18 September 2021.
An earthquake swarm stared on 27 September 2021 south of Mount Kelir. This is located near the northern end of the earthquake swarms earlier this year which preceded the eruption at Geldingadalir.
We have plotted the swarm to see what is going on.
While it is not clear what the cause of the swarm is (new magma or the crust adjusting to changes in tension), people are advised to avoid the area for the time being. If an eruption does occur near Kelir, it is expected to be similar to that at Fagradalsfjall. The aviation code is still orange.
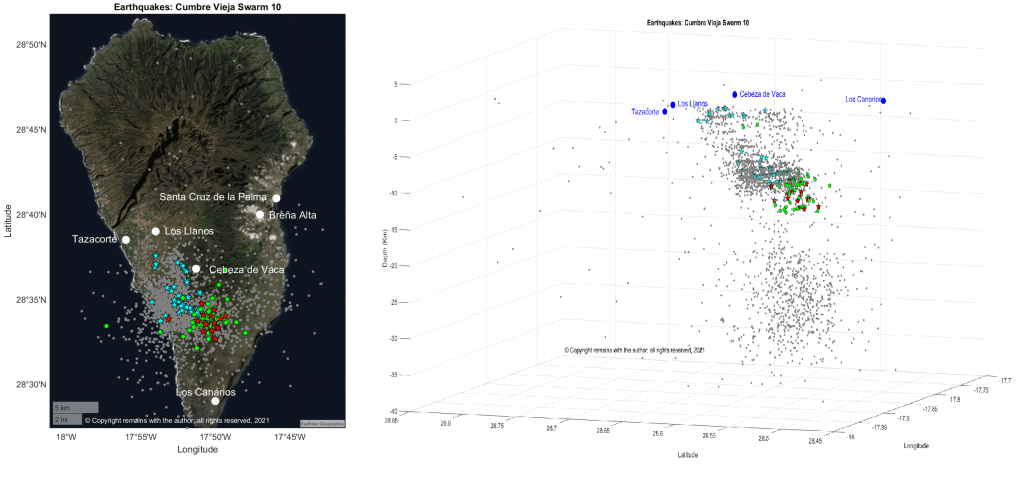
Cumbre Vieja, Canary Islands
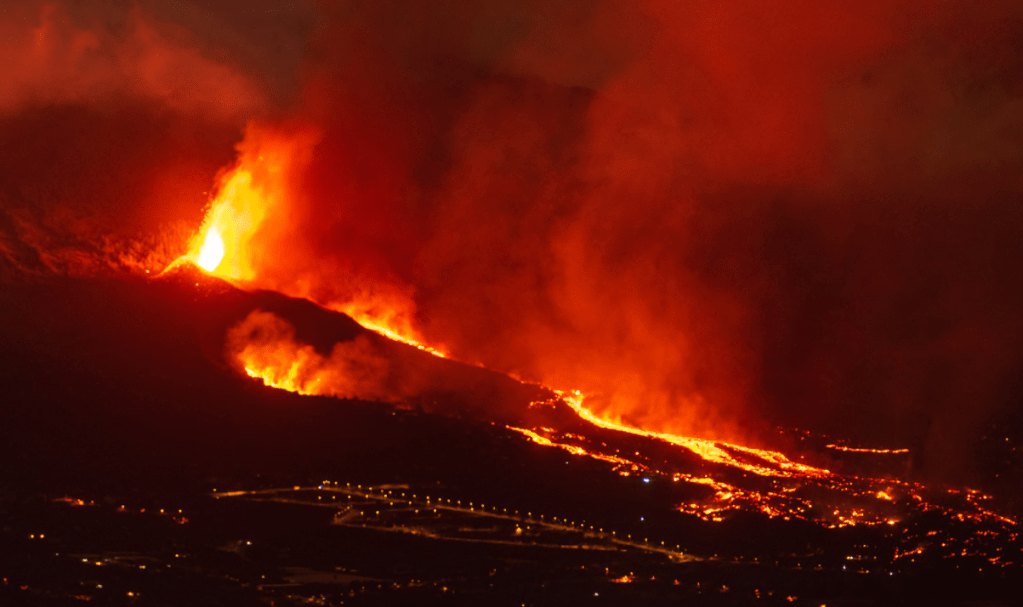
Fig 3: Cumbre Vieja eruption on 20/09/2021, cropped from an image by Eduardo Robaina, published under CC BY-SA 3.0. Source:Wikimedia Commons
The eruption is still going strong. The vents have produced ash columns, jetting lava and effusive lava flows.
Lava reached the sea, following the opening of a new vent earlier this week, which emitted more effusive lava. The lava travelled at 300 m/hr, crossing the coastal road and cascading over 100m high cliffs at Los Guirres. The lava is forming a delta, which has reached an impressive size 21 hectares.
There are now four eruptive vents: a new effusive vent opened 400m north of the main vent on Thursday; and, two more opened on Friday 15 metres apart and 600m north west of the main cone. Lava from Thursday’s new vent also made it to the sea via a flow parallel to the original one. A fumarolic field has developed on the north side of the main vent.
Over 80 million cubic metres of lava have been erupted. Sadly, this has damaged 1,005 buildings, of which 870 have been destroyed. 30.2km of road has been impacted, of which 27.7km have been destroyed. Ash now covers 3,172.9 hectares of land.
SO2 levels are higher but not considered a risk for the population at the moment.
Earthquakes are occurring near the area start of the swarm which preceded the eruption. They are deeper than the earlier swarm leading to concern that lava may be fed from a deeper reservoir. We have plotted the current swarm and previous swarms from 2017 to date.
Time to check out the current status of the volcanoes we have been following, especially as the situation has changed for some.
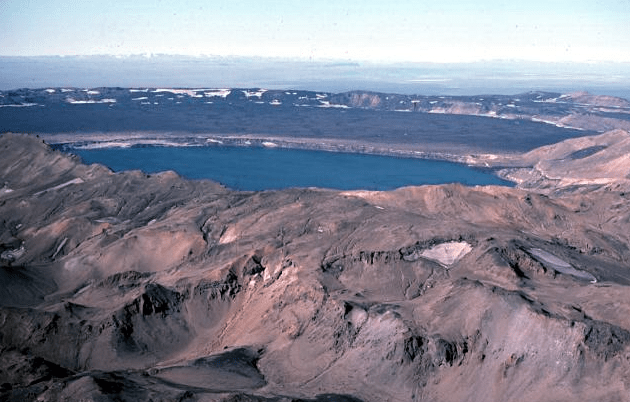
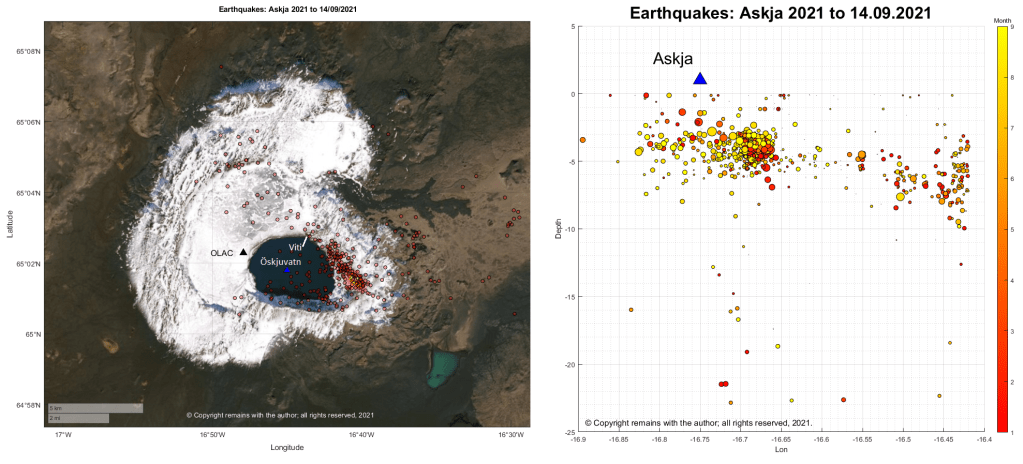
Askja
Fig 1: Image of Askja caldera by M Ryan, USGS, public domain.
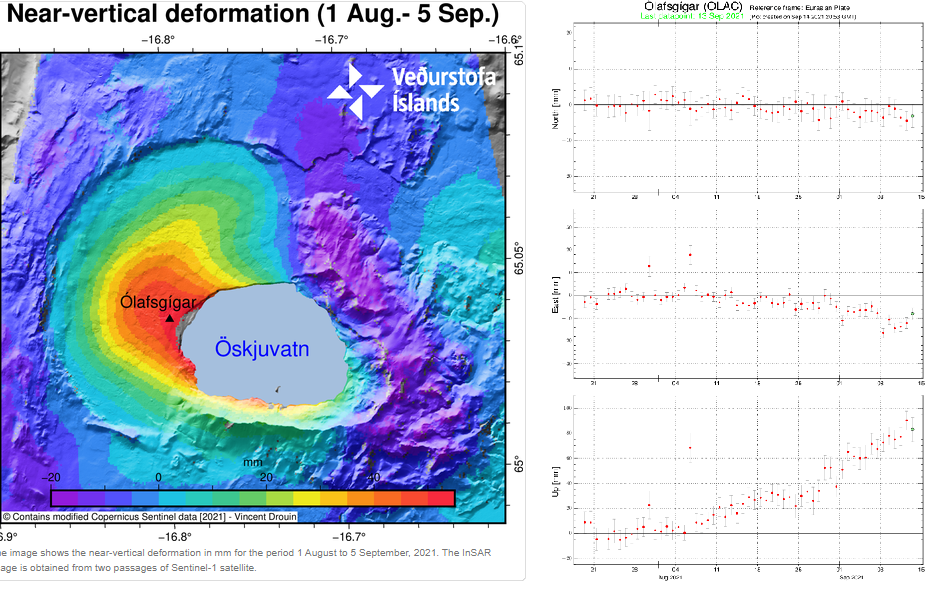
Inflation, thought to be caused by a magma intrusion at a depth of 2km-3 km, started in early August. GPS data and satellite images detected uplift of 5cm per month; the uplift centred on the western edge of the Öskjuvatn caldera.
The aviation code was raised to yellow on 9 September 2021, following near vertical uplift of 7cm.
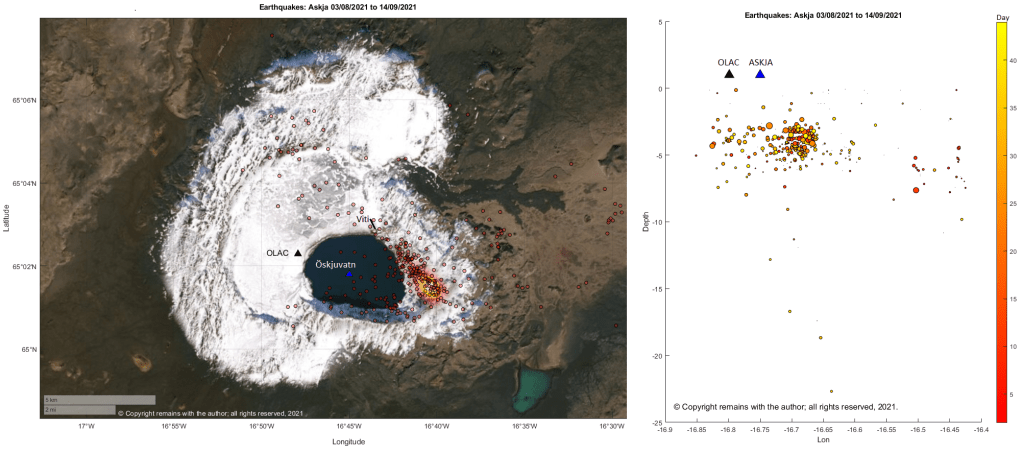
The epicentres of current earthquake swarm are mostly to the east of the Öskjuvatn caldera following a near linear route, starting at, or near, the area of maximum earthquake density for the period 1995 to 09.09.2021, and heading for the Viti explosion crater; seismic activity is on the opposite side from the area of maximum uplift.
Seismicity for 2021 looks pretty similar; the current swarm follows the pattern of earlier seismicity.
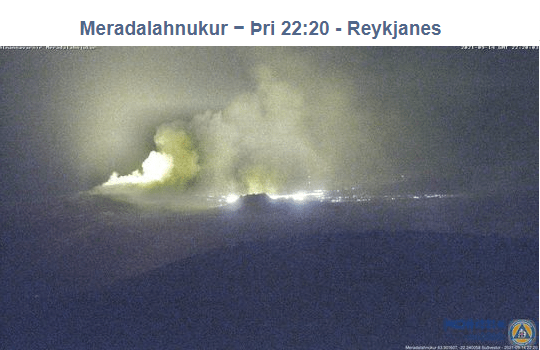
Fig 4a: Crater at Fagradalsfjall erupting on 14 September 2021.
The crater at fissure 5 has grown considerably since we last posted about it; it now dominates the surround hills. The eruption paused on 2nd September 2021, taking a well-earned break; steam and gas emissions continued. The eruption resumed a couple of days ago. The aviation code remains orange.
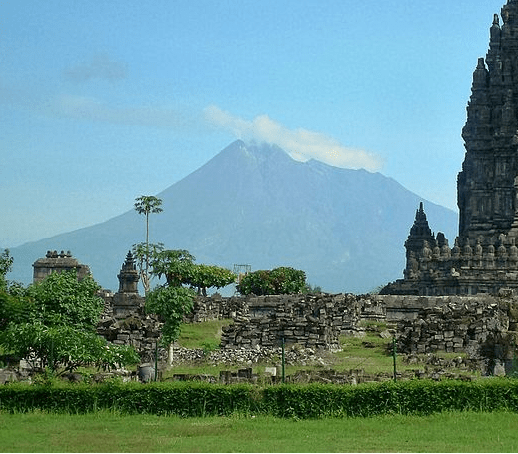
Fig 5: Merapi 2011 with Prambanan in the foreground, cropped from an image of Prambanan by Arabsalam, published under CC BY-SA 4.0. Source: Prambanan Java243. Prambanan is an 8th Century Hindu temple compound located approximately 17 kilometres (11 mi) northeast of the city of Yogyakarta and designated a UNECSO World Heritage Site.
Both lava domes situated below the south west caldera rim continue to grow, producing numerous pyroclastic flows and avalanches.
The alert level remains at thee and there is a 3km – 5km exclusion zone.
Grímsvötn
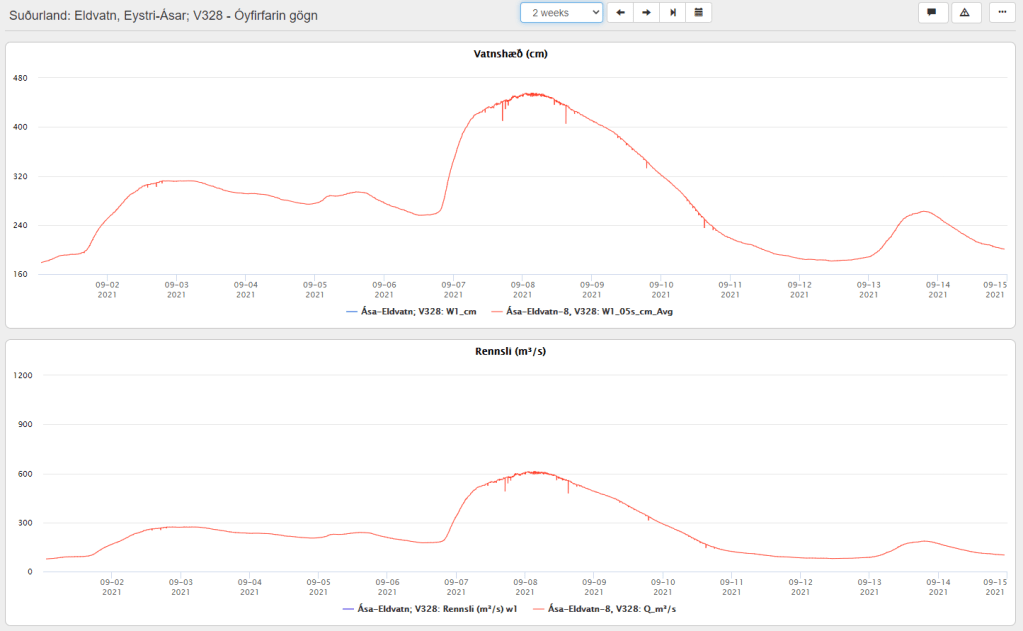
A jökulhlaup started on 1 September 2021 from the western Skaftlá caldera; the peak flow rate reached 520 m3/s on 2 September 2021. Warnings were issued of the hazard from H2S from water draining from the caldera lake. The ice-shelf had subsided 1m by 5 September 2021.
On 6 September 2021, the peak flow rate increased to 610 m3/s, thought to be due to a second release of water from the caldera lake – this time on the eastern side.
The aviation code remains at yellow.
Fig 6: Top image shows the water levels reached at Eldvatn and the lower one, flow rate. Source: IMO
La Soufrière St. Vincent
The last ash emissions were on 22 April 2021. Seismicity has since remained low. Gas and steam plumes have been observed rising from the crater.
The alert level remains at orange.
Mount Pelée
Volcano-tectonic earthquakes are still occurring in the edifice at depths between 0.2km to 1.2km. The area of discoloured, downgraded, burned and dead vegetation remains on the south west flanks.
At the end of July 2021 underwater gas emissions started between St Pierre and the Prêcheur. This will be investigated to ascertain how it links with the volcano.
The aviation code remains at yellow.
Mount Nyiragongo
The volcano is still active. A [gravitational] collapse in the crater caused and ash plume; ash reached Goma. Incandescence was seen on 26th July 2021 and a gas and ash plume emerged on 4th August 2021.


_julesvernex2.jpg)
#/media/File:Keilir_distance.jpg)