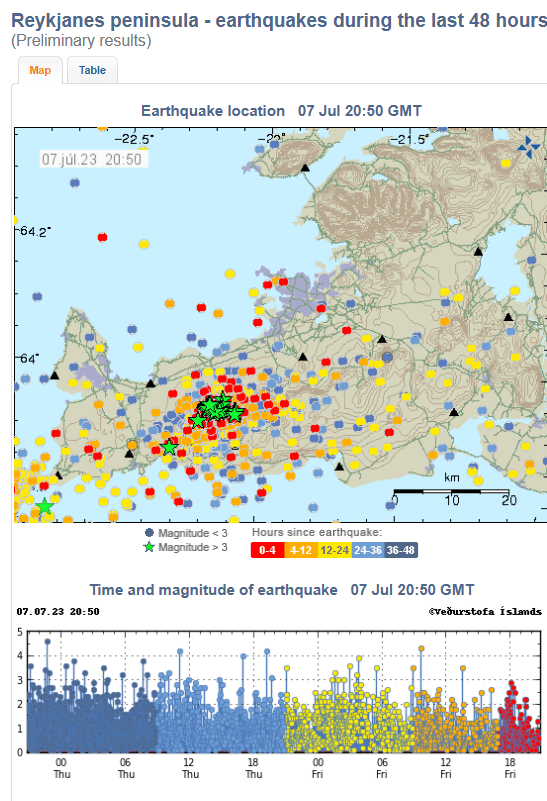
The earthquake swarm which started on 4th July 2023 is continuing vigorously as we write, with 7,000 earthquakes detected. InSAR has confirmed that there is a dike intrusion between Fagradalsfjall and Kelir. IMO have said that magma is likely to have reached a depth of around 1 km by 6th July, causing a fracture of a 2.8 km length between Fagradalsfjall and Keilir, centred a little north of Litli-Hrútur. The expectation is that, if an eruption occurs, it will be in hours or days. The eruption may be short but bigger in its initial stages than the 2021 and 2022 eruptions. The alert level remains at orange.
A smaller swarm is also ongoing southwest of the peninsula on the Reykjanes ridge, near the island of Eldey. This may be due to crustal accommodation of the magma intrusion between Fagradalsfjall and Kelir and/or it may be independent activity. The alert level has been raised to yellow. We will look at this in later posts.
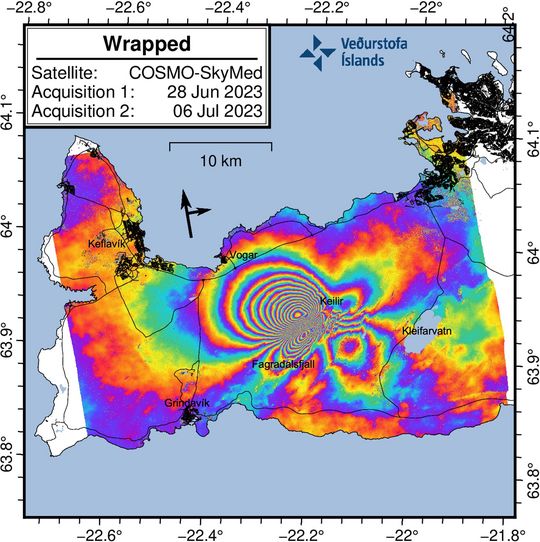
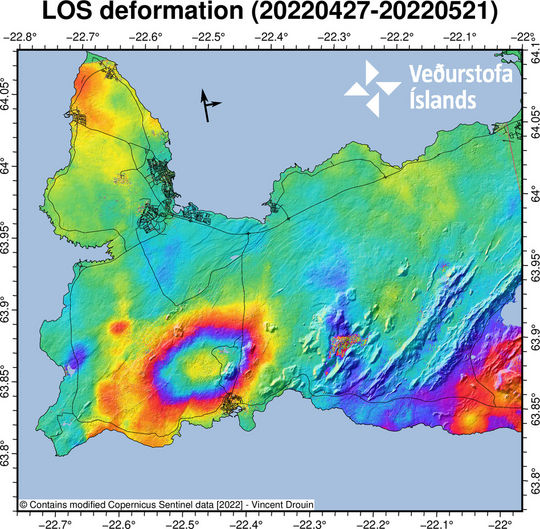
The wrapped image (Fig 2) clearly shows a series of multicolored fringes centered bewtween Fagradalsfjall and Keilir. These fringes show ground deformation caused by the new dike intrusion which commenced on 4 July 2023. The maximum observed deformation related to the dike intrusion is up to 18 cm in the satellite‘s line-of-sight (los) in the NW direction.
Although the deformation signal extends over a large area of the western Reykjanes Peninsula, this does not mean there is magma beneath this entire region. The magma intrusion is situated bewteen Fagradalsfjall and Keilir. There is no indication of additional magma movements outside this area.
Several small lineaments are also visible in the interferogram which cut across the fringes. These represent fault movements/earthquakes that were triggered during the dike propagation.”
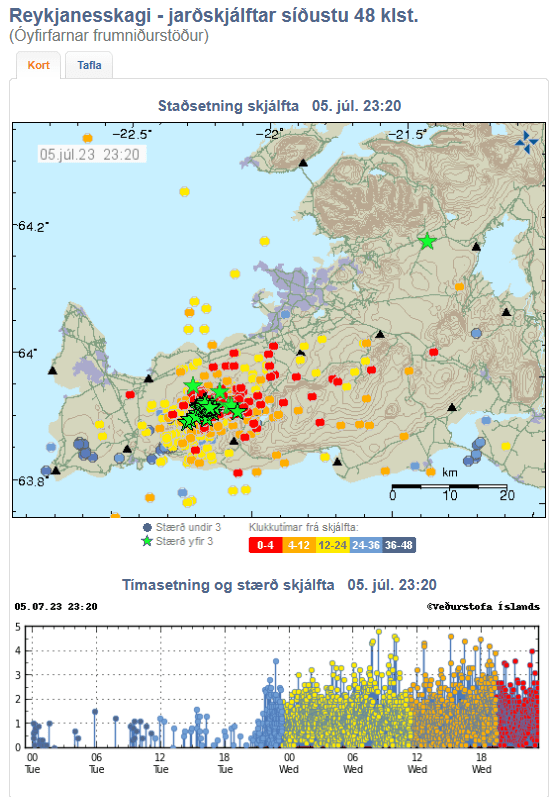
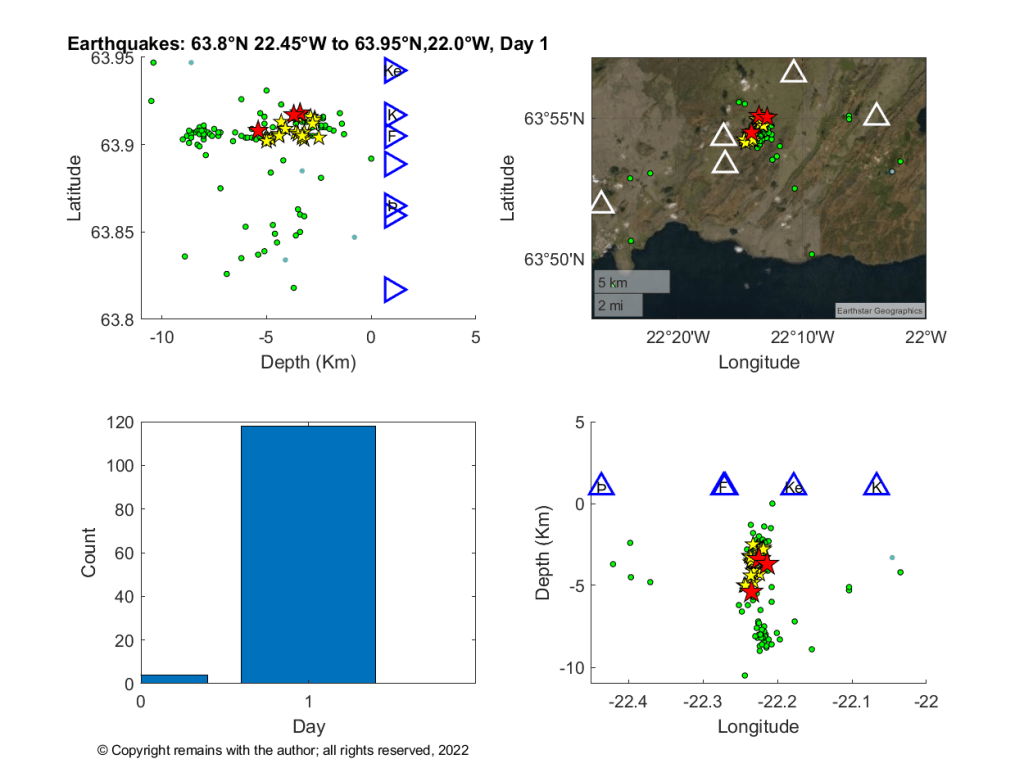
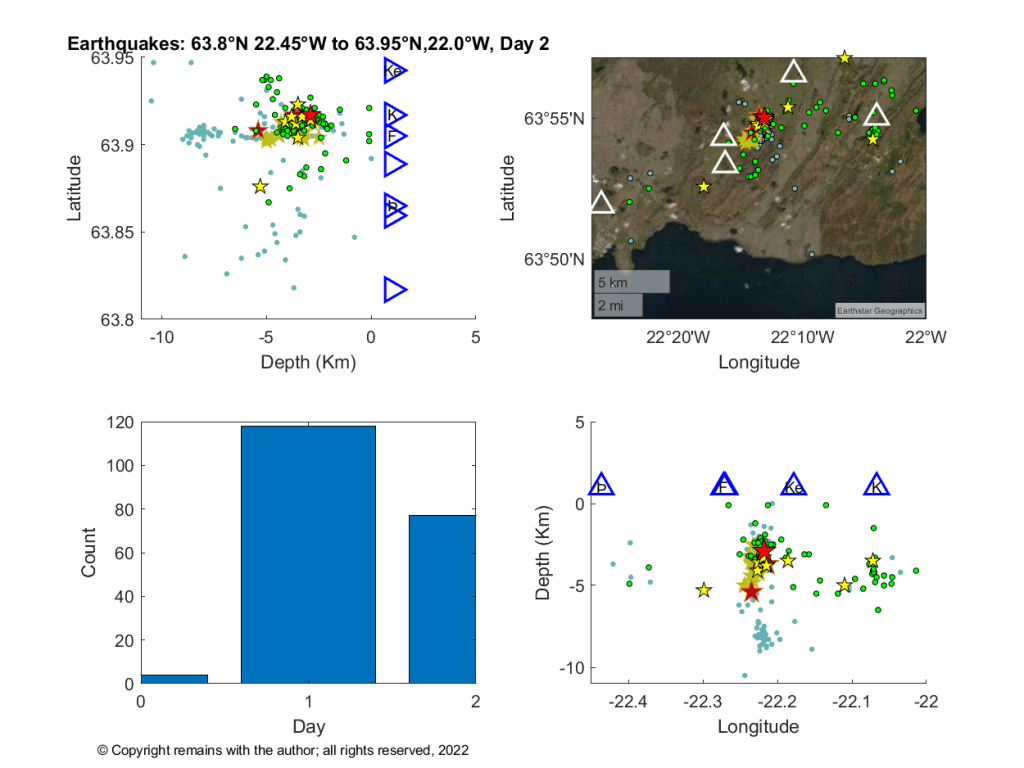
We have updated our earthquake plots to this morning, 7th July 2023 09:37 using the published earthquakes from https://skjalftalisa.vedur.is .
Local volcanologist have said that the likelihood of an eruption in a matter of hours or days has increased. The aviation alert level has been increased to orange.
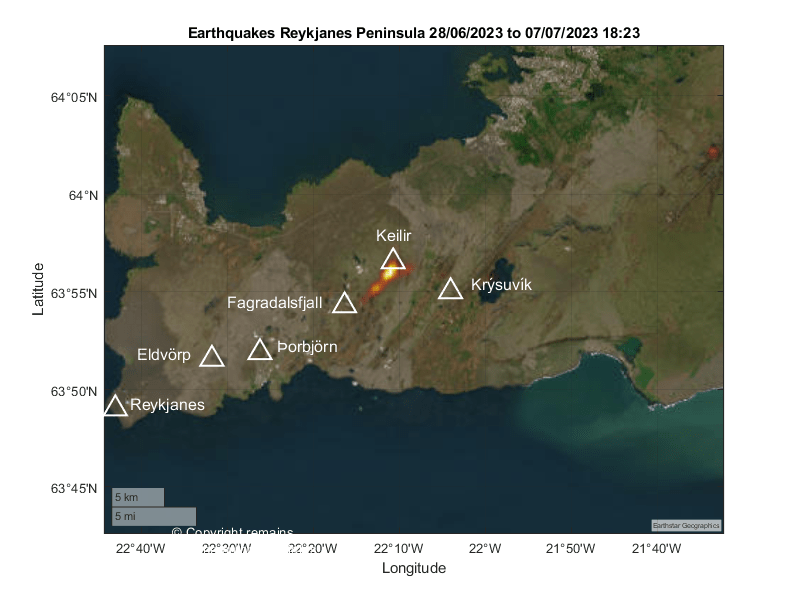
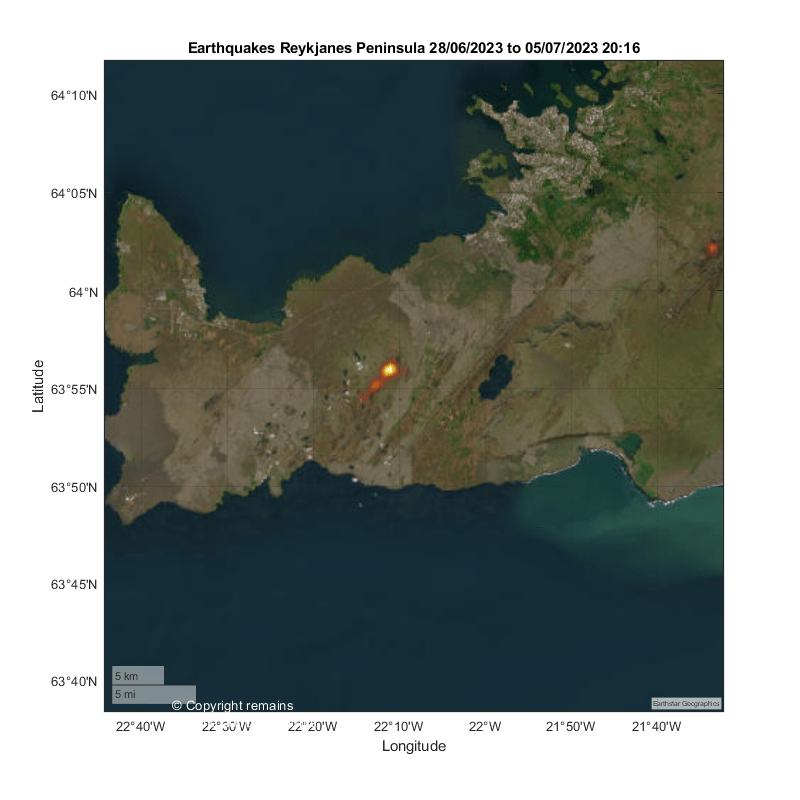
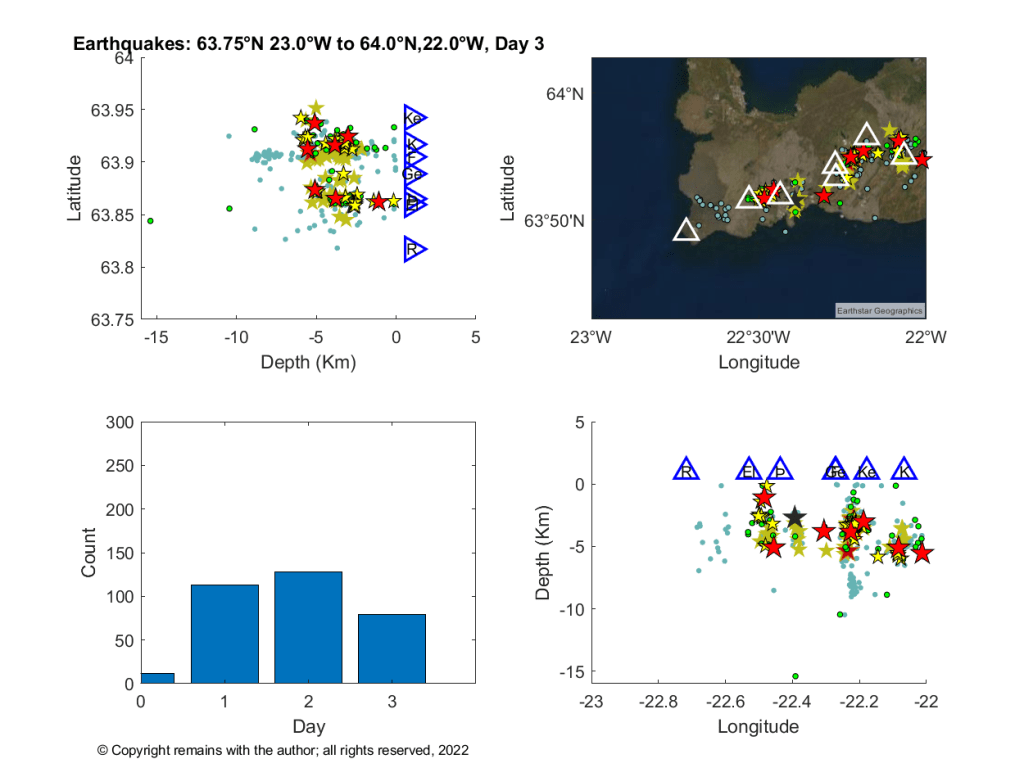
So we have plotted the published earthquakes from https://skjalftalisa.vedur.is from 28th June 2023 to 5th July 2023 20:16 to see what is going on.
It certainly looks like a magma intrusion close to the sites of the recent Fagradalsfjall eruptions. Time will tell whether or not and where lava emerges with the current swarm.
Our thanks go again to the Icelandic Met Office, IMO, https://www.vedur.is/, for the raw earthquake data. For updates, please visit IMO.
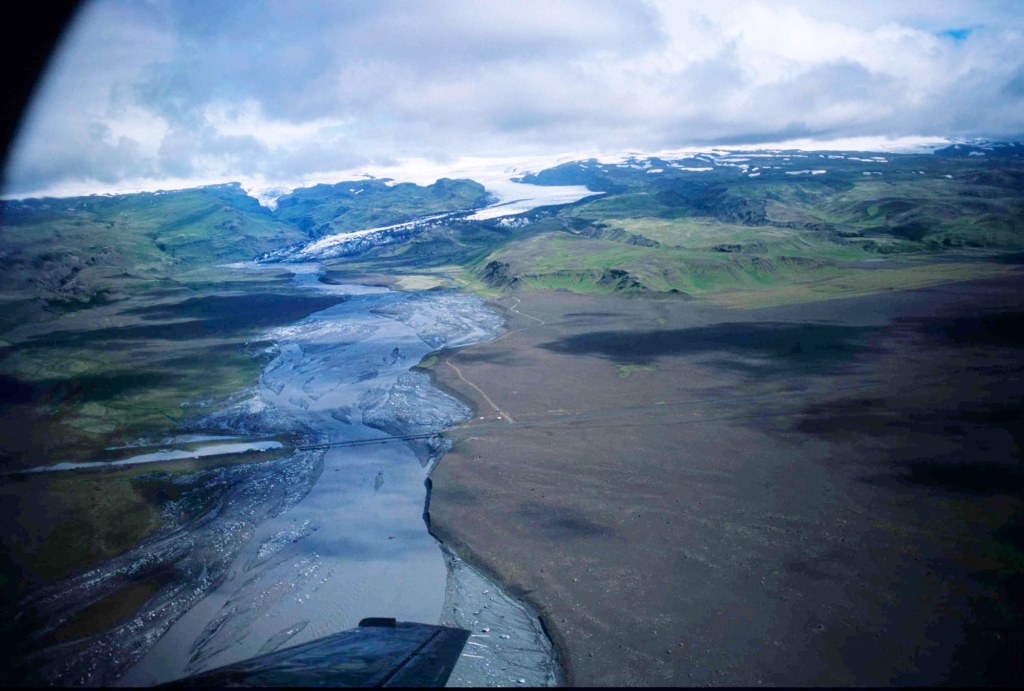
Fig 1: Katla: photo 3 of 6. Retrieved from http://icelandicvolcanoes.is/?volcano=KAT. Jökulhlaup from underneath Mýrdalsjökull glacier in 1999. It remains controversial whether it was caused by a subglacial eruption. Photographer: Oddur Sigurðsson. Date: 18 July 1999
In recent weeks Katla has been showing a heightened level of unrest. Just last month there was an earthquake swarm which led to the temporary raising of the aviation alert level to yellow. Yesterday, the Iceland Met Office reported a risk of ongoing earthquakes at Mýrdalsjökull, gas pollution near Kötlujökull and higher than usual water levels at Múlakvisl; this may be indicative of geothermal activity or magma movement. The alert level is green at the time of writing.
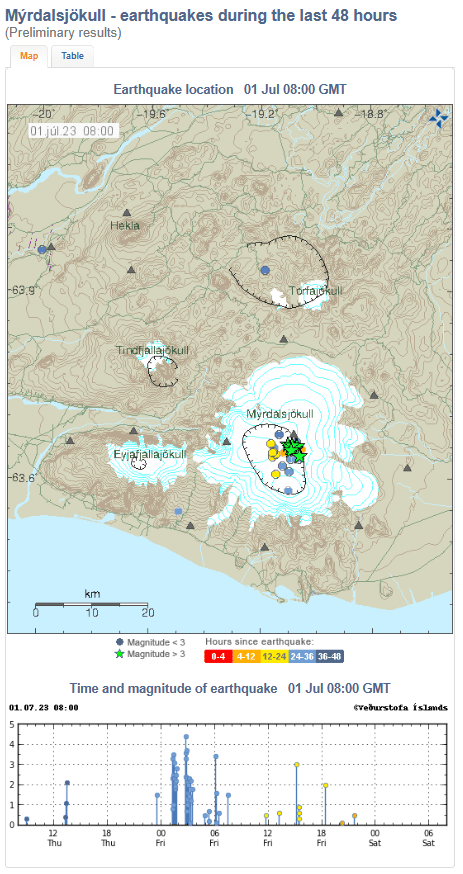
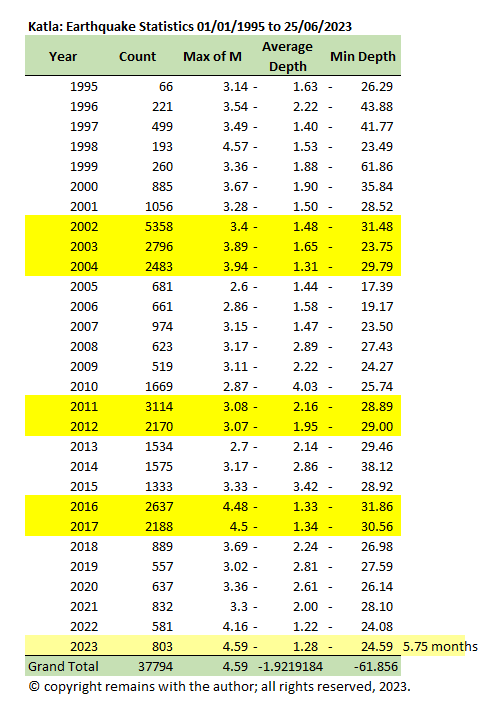
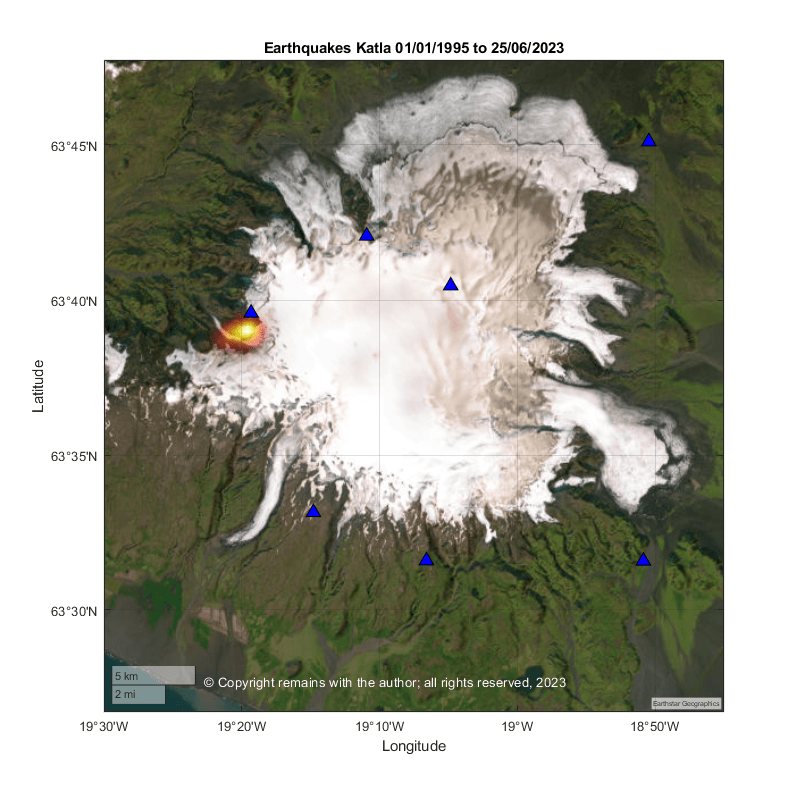
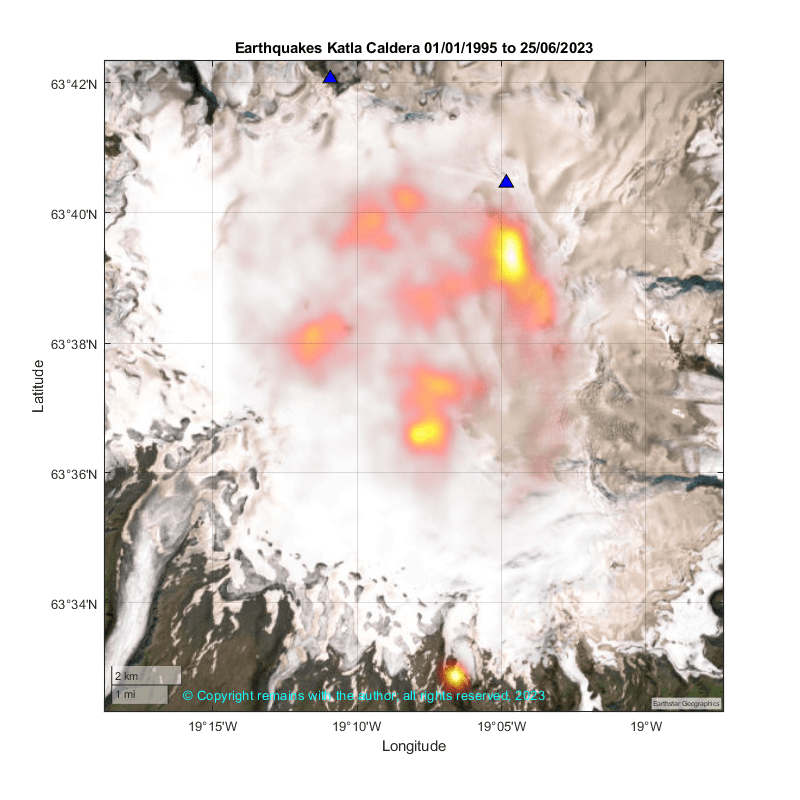
So we took a moment to update our Iceland earthquake database to 25th June 2023 (the earthquake list for week ending 2nd July 2023 is not yet available, although they can be viewed on Skjálfta-Lísa (vedur.is)) and plot the earthquakes at Myrdalsjökull, 63.1°N,18.5°W to 64.2°N,20.00°W, and then the caldera area, 63.45°N,18.98°W to 63.72°N, 19.24°W from 1st January 1995 to 25th June 2023.
This plot shows most seismic activity in the NE of the caldera, near the site of the source of the 1955 jökulhlaup, some in the S of the caldera near the source of the 1918 eruption and 2011 jökulhlaup and another swarm on the volcano’s flank, south of the caldera. The swarm to the south of the caldera occurred in 2011 at the Gvendarfell Ridge. Later study of the Gvendarfell Ridge found sources of recent flank eruptions, including rhyolitic domes and Surtseyan craters.
We have also plotted monthly geoscatter plots for Myrdalsjökull from January 1995 to June 2023 (25 June 2023) and created a 3D rotating scatter plot for the same time period and area.
Giulisa Sgattoni, Federico Lucchi, Páll Einarsson, Ólafur Gudmundsson, Gianfilippo De Astis, and Claudio Antonio Tranne, “The 2011 unrest at Katla volcano: seismicity and geological context”, JÖKULL. No 69, 2019. https://jokull.jorfi.is/wp-content/uploads/2021/12/J69-53-70
Apologies for not posting for a while now. Illness in the family has made more demands on our time than anticipated.
We have missed the eruptions of Mauna Loa and Kilauea, to name but two, and two catastrophic earthquakes: one in West Java in Indonesia and the other in Khost, Afghanistan.
Even when we are not posting, our thoughts remain with all those impacted by volcanic and seismic hazards.
Eruptive activity at the new fissure in Meradalir stalled on 21st August 2022 at around 6:00 am. The seismic tremor ceased following the emission of a blue grey plume. Lava was seen on webcams to be still flowing from the crater just before then. We await to see whether or not this is the end of this eruptive episode.
To quote IMO, “A new chapter is about to begin in the Fagradalsfjall fires, but whether the seismic activity will recur and it will erupt again in the near future or not, time will tell.”
What do we know of the eruption so far? The eruption started on 3rd August 2022. The initial discharge rate was c. 32 cubic metres per second, dwindling to 2 cubic metres per second by 16th August 2022. The total volume of lava emitted by 16th August 2022 was 12 million cubic metres, c. 8% of that emitted by the Geldingadalir eruption last year. At the crater the lava is 20 to 30 metres deep and 40 metres deep by the crater rims, themselves. Over the rest of the lava field the lava is between 5 and 15 metres deep. The new lava has displaced cooling older lava causing it to rise by 3 to 5 metres in places.
The lava composition is similar to the basalt emitted by Geldingadalir in September 2021. The K2O / TiO2 ratio ranges from 9.3 to 9.4 and the MgO is around 8.4 wt(%).
So, it was hours, not days! The eruption started near Fagradalsfjall / Meradalir yesterday at around 13:18 about 1.5 km north of Stóra-Hrut on a north-easterly southwest fissure. The onset was detected by a local webcam and later confirmed by scientists. The alert level is currently orange (Volcanic eruption is underway with no or minor ash emission.)
Like the previous eruption, lava is contained by the local geography so no infrastructure is currently threatened. Gas emissions are, however, a hazard. The lava flow is estimated to be 5 – 10 times that of Geldingadalir at 32 cubic meters per second in the first 24 hours; gas emissions may well be similarly larger.
Visitors are advised not to approach the site at the moment. When the site is open, bear in mind that it is not an easy walk, so for the fit only, and visitors should be properly prepared, including having gas masks and metres.
At the time of updating, we did not have confirmation of the coordinates of the eruption site, so we have guessed based on maps of the fissure. The plots will be updated when more up to date information becomes available.
Update 02/08/2022, 20:39:46, Fagradalsfjall and Grímsvötn
The earthquake swarm near Fagradalsfjall continues unabated. The aviation code for Grímsvötn has been raised to yellow following increased seismic activity there.
Fagradalsfjall
At the time of writing IMO were reporting 3,000 earthquakes in the last 48 hours detected by the SIL Seismic Network.
Rising magma has caused some large triggered earthquakes where existing faults slip to accommodate the strain, the largest so far being 5.47 on day 2 of the swarm.
The Icelandic media are reporting that new satellite images taken on 1 August 2022 show magma movements located between Fagradalsfjall and Keilir. The magma intrusion is shallow at c. 1 km below the surface. The magma influx is close to double the rate of the previous eruption. The chances of an eruption near Fagradalsfjall in the coming days or weeks have therefore increased and are considered to be significant.
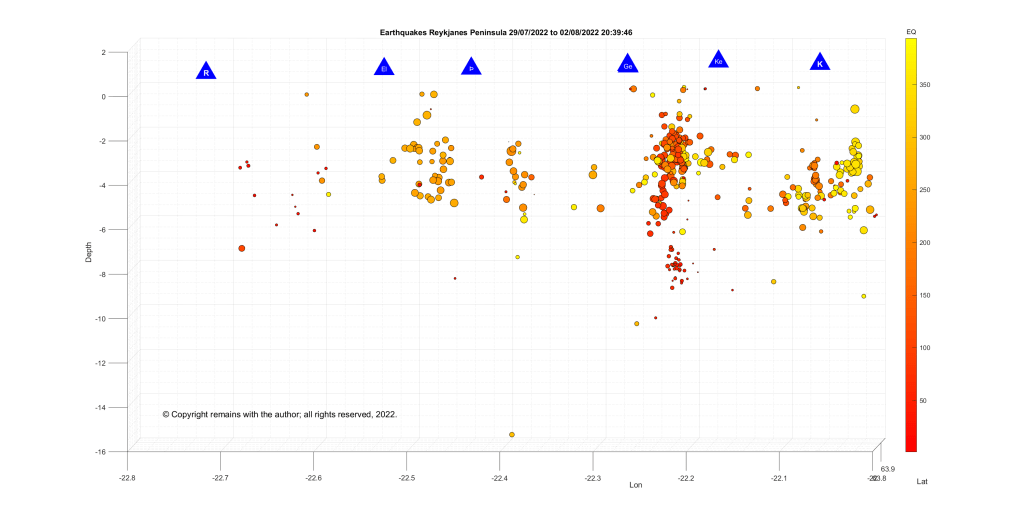
We have updated our earthquake plots using confirmed earthquake data from IMO’s Skjálfta-Lísa for the area 63.75°N, 23.0°W to 64.0°N, 22°W (the western Reykjanes Peninsula). The geodensity plot shows that most of the action is centred north east of Fagradalsfjall.
The image from IMO below shows the earthquake activity at Grímsvötn.
Fig 7: Screenshot of seismic activity at Grímsvötn today. Source: Vatnajökull (vedur.is)
Hopefully, eruptions are not like buses – wait for ages, then several show up together. On a more serious note, if Grímsvötn does erupt, ash may be problematic for Europe depending on the size of the eruption and the prevailing wind direction. A jökulhlaup caused by melting of the ice-cap is another hazard. An eruption near Fagradalsfjall is less likely to produce a lot of ash unless magma encounters an aquifer or other body of water; lava and any gas emissions depending on volume and location are likely hazards. Seismic activity remains a hazard for both; the public are advised of the risk of rockfall and landslip.
A large earthquake swarm started yesterday (30/07/2022) lunchtime north east of Fagradalsfjall, Iceland. At the time of writing, IMO had reported 1,597 earthquakes in the last 48 hours for the Reykjanes Peninsula from the SIL seismic network. This network automatically detects and locates earthquakes in Iceland and the surrounding offshore region. 199 of these earthquakes had been confirmed.
At the moment the swarm is being likened to the swarm in December 2021, which did not result in an eruption. The local authorities are warning of the increased risk of rockfall as a result of increased seismic activity.
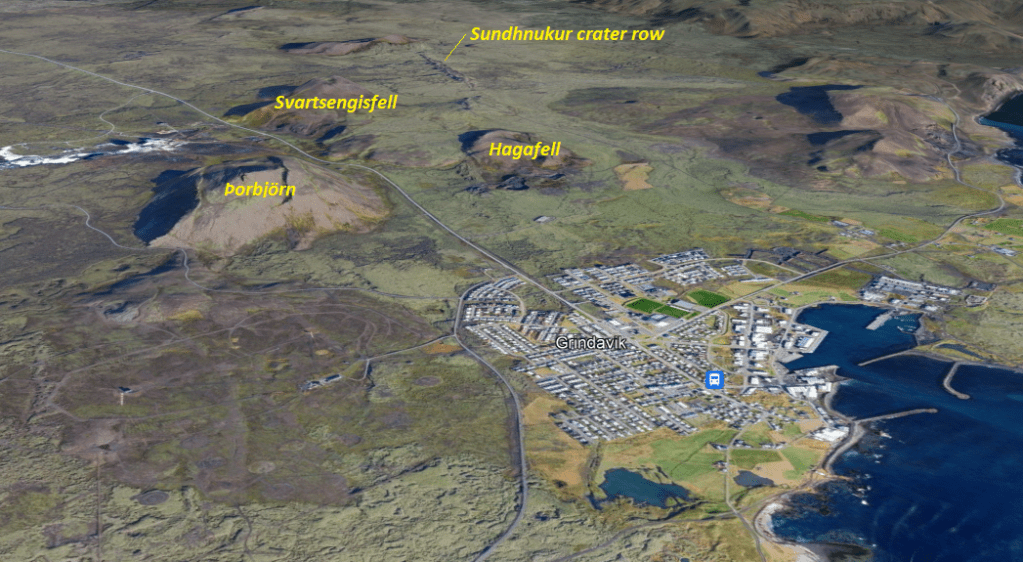
Seismic activity continues in the Svartsengi area, extending to the Sundhnúkur crater row. The earthquakes in the vicinity of Mount Þorbjörn appear to be getting shallower today as at the time of writing.
The Sundhnúkur crater row erupted c. 2,360 years ago. It is accredited with creating the Hópsnes/Þórkötlustaðanes land spit to the east of Grindavík.
Fig 8: Bird’s eye view of the Svartsengi area and Gringavík. Image from Google Earth; yellow text added by the author.
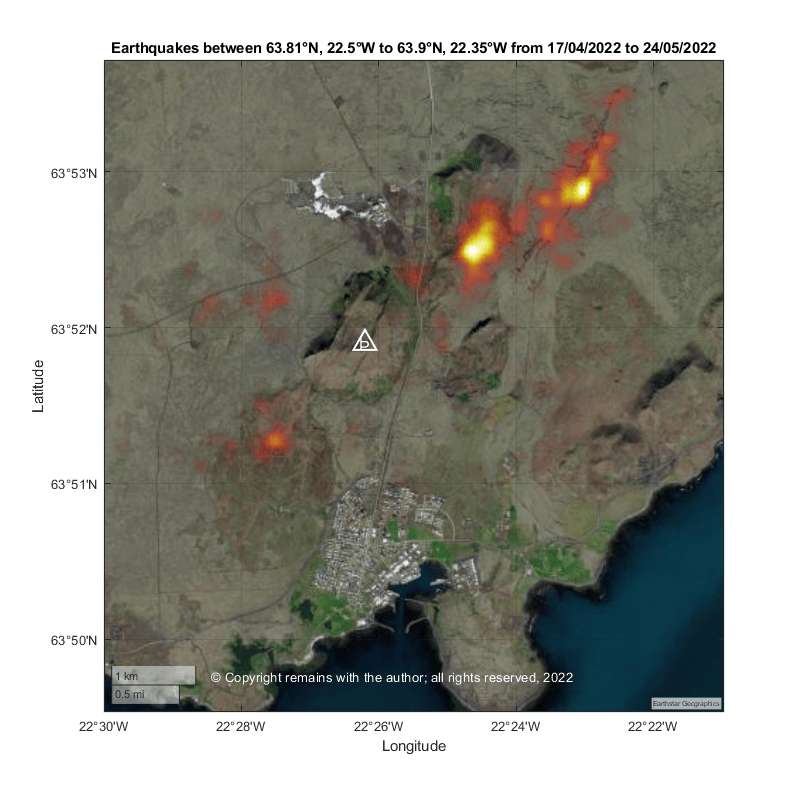
Here are our updated earthquake plots to 26th May 2022 15:06.
The following video shows both the geoscatter plots by day from 17th April 2022 to 26th May 2022 in the swarm for the western Reykjanes Peninsula, and the scatter plots for the same period for the area around Mount Þorbjörn.
While the earthquake plots are highly suggestive of more shallow magma ascent, we need to bear in mind that this area is on the plate boundary, the Mid Atlantic Ridge. Some of the seismic activity may be existing faults moving to accommodate the magma. Time will tell when and where magma emerges.
For the latest updates and alerts, please consult with IMO or the local authorities.
Armchair Volcanologist
Original Post 24th May 2022
The earthquake swarm that started on 17th April 2022 on the western Reykjanes Peninsula continues. Today we are plotting activity at the Svartsengi area near Mount Þorbjörn, which lies to the north of Grindavík, Iceland. We have used Mount Þorbjörn as the marker for Svartsengi in our plots.
Fig 1: Image cropped from one by Arian Zwegers of the Blue Lagoon looking towards Mount Þorbjörn. Published under CC-BY SA-2.0. Source: Þorbjörn (mountain) – Wikipedia
IMO reports that there has been significant uplift of 40mm to 45mm during the swarm in the area north of Grindavík indicative of magmatic activity.
From a simpler scatter plot and a geodensity plot, we can see much of the activity has occurred near Mt Þorbjörn or Svartsengi in the area enclosed in the green box below.
An earthquake swarm started on the Reykjanes Peninsula on 17th April 2022 and is continuing at the time of writing. This swarm is part of a larger volcano-tectonic episode that started at the end of 2019 on the Reykjanes Peninsula, including the eruption at Geldingadalir.
Local volcanologists are reporting now that recent ground deformation of 3.5cm suggests a magma intrusion in the vicinity of Svartsengi, north of the town of Grindavík. Magma is believed to be pooling at a depth of c. 4km between Mount Þorbjörn and the Eldvörp crater row. This is an area which can produce large earthquakes of 6.5M. People are advised to avoid areas where landslip is likely.
Fig 1: Image cropped from a photo by Roman Zacharij of Grindavik, Iceland (Source: Wikimedia Commons, Public Domain).
We have updated our earthquake plots to show the swarm to date. Our plots exclude an earthquake occurring earlier today with a depth of 40.7km to keep the detail in the plots showing depth; the earthquake omitted is 19/05/2022, 00:11:14, 63.77°N , 22.75°W, 40.7km, 1 magnitude. Since we downloaded the data at 09:55 am today, there has been a 3.0 magnitude, 4.9 km NNE of Grindavík.
Our plots show possible doming in the vicinity of Mount Þorbjörn and the Svartsengi Volcanic System.
An earthquake swarm started near the Reykjanes and Eldey volcanic systems on 17th April 2022. A volcanologist was reported by the Icelandic media to have said that there is a 50% chance of another eruption on the Peninsula by the end of this year. If the eruption occurs offshore, the resulting ash may reach Reykjavik and beyond. Another possibility is that Fagradalsjall may erupt again.
Fig 1: Image of Eroded partially submarine volcano and boulder beaches at Reykjanestá by Diego Delso. Published under CC BY-SA 4.0. Source: Geology of Reykjanes Peninsula – Wikipedia
So we decided to plot the earthquakes on the Reykjanes Peninsula from 1st January 1995 to 26th April 2022 for the area 63.6°N, 23.5°W to 64.2°N, 21.0°W by month. The results are interesting.
Intense earthquake activity starts early 1995 in the east of the region to the south east of Hengill near the Hrómundartindur volcanic system, which has not erupted since the early Holocene. Activity migrates slowly westward to Geirfuglasker via Krýsuvík, Fagradalsfjall, Reykjanes, and the intensity of activity near Hrómundartindur lessens. The volcano-tectonic episode which resulted in the eruption at Geldingadalir started in month 300, the eruption, itself, started in month 315.
We have discussed the Hengill, Brennisteinfjöll, Krýsuvík and Reykjanes volcanic systems in an earlier post (Recent Seismic Activity on the Reykjanes Peninsula, 14th May 2020) The Hrómundartindur system is about 25 km long, comprising a fissure swarm and a 500m high central volcano. The system lies at the junction of the Western Volcanic Zone and the South Iceland Seismic Zone. Its lavas range from picrite to basaltic andesite. There is an active geothermal field in the system. The Eldey volcanic system is a 40km long fissure system on the Mid Atlantic Ridge, here, the Reykjanes Ridge. There is no central volcano. It is mostly submarine; the island Eldey and the skerries, Eldeyjardrangur, Geirfugladrangur and Geirfuglasker, are the only subaerial features of the system. Six small submarine/explosive Basaltic eruptions have occurred in the last 1,100 years, the last eruption occurring in 1926 CE.
We would not like to predict where the next eruption will be based on the above earthquake plots alone, other than to say it could be anywhere between Hrómundartindur and Geirfuglasker. Our non-expert interpretation of the above plots is that magma is ascending between Krýsuvík and Reykjanes. The seismic activity to the east and west of that area is caused by resulting stress on the crust; whether there is enough activity to provide an additional path for magma remains to be seen. Time will tell where and when magma makes it to the surface again.
Kristján Sæmundsson (Iceland GeoSurvey) (2019 November 15). Hrómundartindur. In: Oladottir, B., Larsen, G. & Guðmundsson, M. T. Catalogue of Icelandic Volcanoes. IMO, UI and CPD-NCIP. Retrieved from http://icelandicvolcanoes.is/?volcano=HRO
Guðrún Larsen (Institute of Earth Sciences – Nordvulk, University of Iceland) (2019 November 15). Eldey. In: Oladottir, B., Larsen, G. & Guðmundsson, M. T. Catalogue of Icelandic Volcanoes. IMO, UI and CPD-NCIP. Retrieved from http://icelandicvolcanoes.is/?volcano=ELD


#/media/File:Blue_Lagoon_(6818651629).jpg)
.JPG)