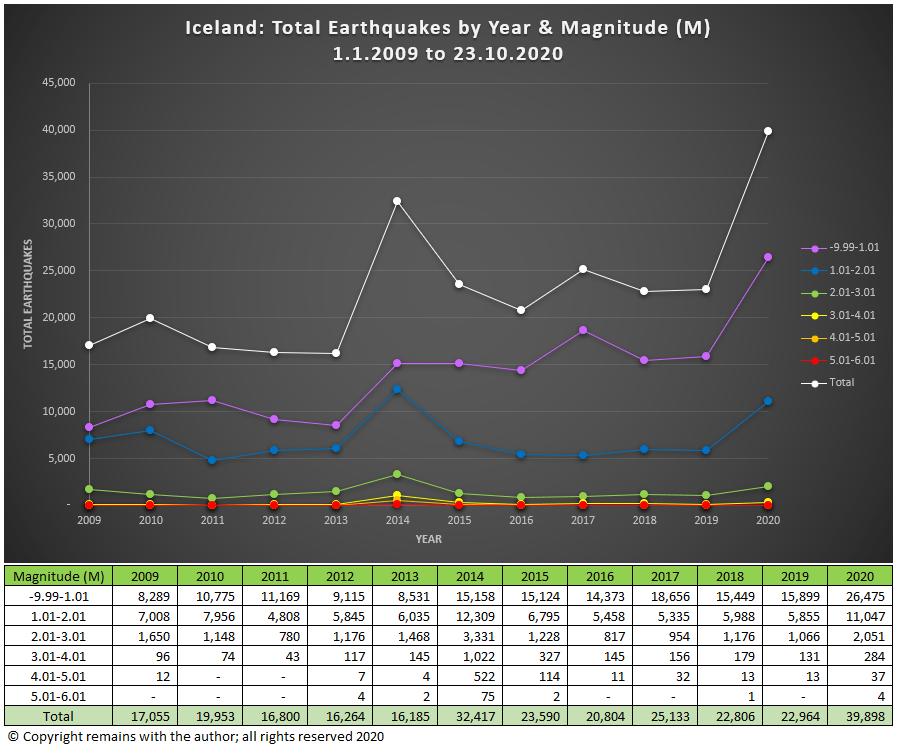
While we are waiting to see if there is any volcanic activity at Grímsvötn or her neighbours, let’s take a look at how the current seismic activity in Iceland compares to previous years.
Our database, comprised of earthquake data downloaded from IMO (see Sources below), now goes back to 29 December 2008 and extends to 23 October 2020, although we may reupload the last week soon because IMO may have been in the process of updating the record when we downloaded the data.
From our graph, we can see that the total number of earthquakes was up in 2010, 2014, 2017 and 2020. In 2010, Eyjafjallajökull erupted, in 2014, Barðarbunga erupted at the Holuhraun fissure; in 2017, there was no subaerial volcanic activity, although Katla may have had some subglacial activity, and, in 2020, there is rifting both in the Reykjanes Peninsula and Tjörnes Fracture Zone but we have yet to see what, if any, volcanic activity emerges. Interestingly, the 2011 eruption of Grímsvötn did not push the total earthquakes up in 2011.
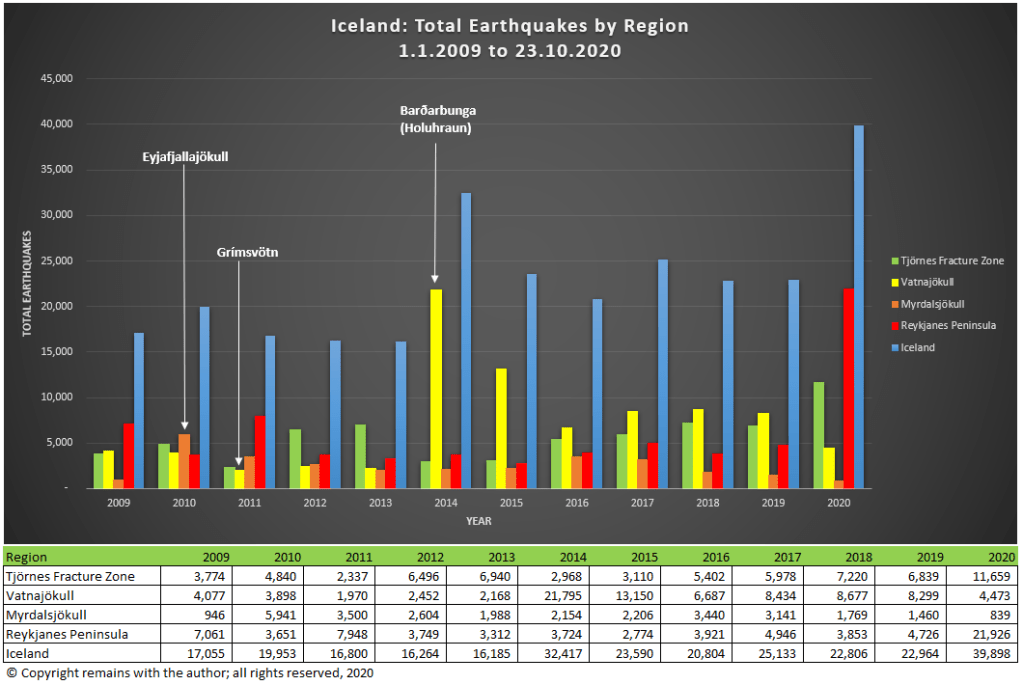
Let’s take a look at activity by region. Here we look at the four main volcanic regions: the Tjörnes Fracture Zone, Vatnajökull, Myrdalsjökull and the Reykjanes Peninsula, where there is most seismic activity.
Fig 2: Iceland Total Earthquakes by Region and Yearby the author, using data downloaded from IMO (see Sources below). Note: not all regions
We see that the eruption of Eyjafjalljokull increased the number of earthquakes in Myrdalsjökull but not to the extent that the eruption of Barðarbunga at the Holuhraun fissure and subsidence in the caldera pushed up the earthquakes for Vatnajökull in 2014 and subsequent years. In fact, the total number of earthquakes in all regions, except Myrdalsjökull, has remained elevated since Holuhraun.
Our database does not extend back far enough to draw any firm conclusions, however, it would appear that rifting events such as Holuhraun produce far more earthquakes than volcanic activity on its own.
Tjörnes Fracture Zone and on the Reykjanes Peninsula
This rather begs the question as to what is happening this year with the large earthquake swarms both in the Tjörnes Fracture Zone and on the Reykjanes Peninsula. Unless our database does not go back far enough, neither the 2011 Grímsvötn nor the 2014 Barðarbunga eruption was preceded by such large earthquake swarms in other regions.
The fact that there is significantly raised activity this year in both regions suggests to us that we may be witnessing the normal plate separation on the Mid Atlantic Ridge (it is not entirely smooth), possible local magma ascent, and / or the plates accommodating an ascending blob of magma from the mantle plume, which is believed to be under the Vatnajökull icecap. There is ground deformation at several spots under the Vatnajökull icecap which points to magma ascent.
IMO have reported that there could be a magmatic intrusion at depth on the Reykjanes Peninsula; this is supported by ground deformation.
Gas measurements, ground deformation and recent seismic activity at Grímsvötn (not enough to show in our graphs but above the background levels for the volcanic system) have led to the Icelandic authorities to consider that an eruption is possible there in the not too distant future and to raise the alert level a notch (see earlier article).
It is too soon to tell whether or not the rifting events, themselves, will result in eruption(s); it is possible that it is just a coincidence that we are seeing two large rifting events at roughly the same time – both areas are seismically active. Time will tell.
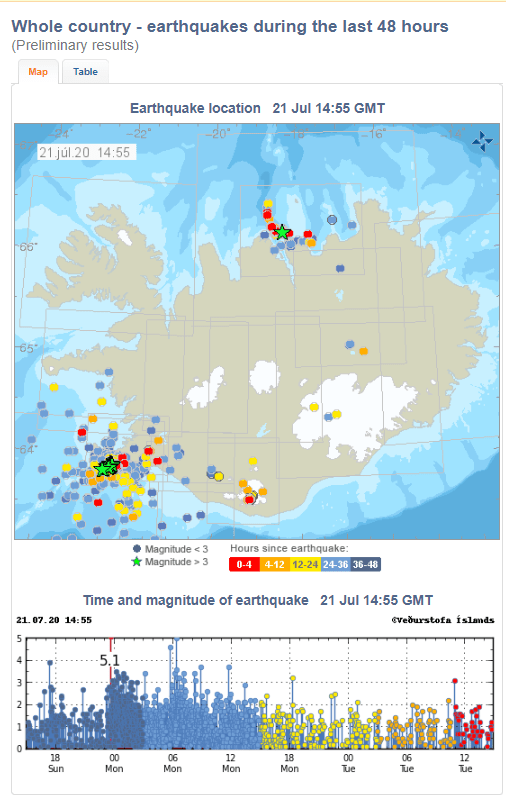
A large earthquake swarm started on the morning of 19 July at around 1:30 am at Fagradalsfjall on the Reykjanes Peninsula. The largest earthquake had a magnitude of 5.1M. At the time of writing, there had been 1,635 earthquakes in the last 48 hours recorded on IMO’s website (note that not all of these have been confirmed). IMO’s map and breakdown of the swarm are shown below:
Fig 1: Map of earthquakes in Iceland over the past 48 hours. Source: IMO
Close up of the Reykjanes Peninsula:
Fig 2: Map of earthquakes in the Reykjanes Peninsula over the past 48 hours. Source: IMO
Magnitude
Number
< 1.0
720
1.0-2.0
723
2.0 -3.0
162
>3.0
30
Fig 3: Breakdown of earthquakes by magnitude
This swarm is occurring on the east side of the swarms on the Reykjanes Peninsula which started late last year. IMO have reported that these swarms (still ongoing) are associated with multiple magma intrusions. The aviation code for the area is still green (IMO). IMO are in the process of evaluating the Fagradalsfjall swarm.
The swarm at the Tjörnes Fracture Zone is still ongoing.
The eagle-eyed amongst you will note that there is some seismic activity at Katla. Whether this will result in anything is anyone’s guess at the moment.
We have not yet updated our earthquake data-set for the current swarm. We will wait until IMO has had a chance to confirm more earthquakes
Update 24 July 2020
The swarm at Reykjanes is now less intense. In the meantime, Katla produced a shallow 3.0 M. IMO have remarked that earthquakes in the summer at Katla are not uncommon.
From memory, Katla was seismically active before the intense swarms started in August 2014 at Barðarbunga in the run up to the eruption at Holuhraun. This may have been a coincidence.
Fig 4: Map of earthquakes in Iceland over the past 48 hours. Source: IMO
The earthquake swarm which started in December 2019 is continuing, let’s have a quick update on the stats.
Statistics
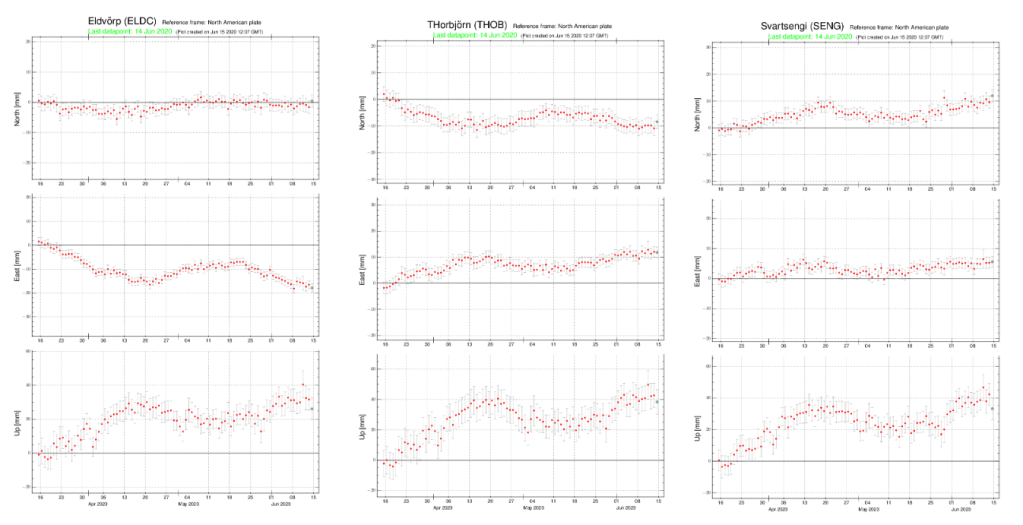
There have been 19,675 earthquakes in the Reykjanes Peninsula area 64.4°N, 23.0°W to 63.7°N, 21.0°W for the period 1 Jan 2016 to 14 June 2020, of which 14,258 (72%) have occurred in the last six months, most associated with the swarm near Svartsengi.
The geodensity plots for months 48 (December 2019) onwards (Figs 3.1 and 3.2) show that the most intense action started to the east of Mt Thorbjörn and has migrated west to Svartsengi and beyond.
IMO has confirmed that uplift has resumed in the vicinity of Mount Þorbjörn. Ground deformation is clearly visible on the GPS plots.
Fig 4:Uplift in the vicinity of Mt Þorbjörn as shown in recent GPS plots published by IMO: GPS Þorbjörn. THOB moved south eastwards, SENG moved north eastwards and ELDC moved westward; all showed uplift.
Summary
We are still looking at an unusually large swarm, accompanied by continued uplift in the vicinity of Mt Þorbjörn.
At the time of writing, there has been no change in the uncertainty phase declared by Icelandic Civil Protection .
The Armchair Volcanologist
15 June 2020
Sources:
Raw earthquake data and GPS plots downloaded from the Icelandic Met Office: https://en.vedur.is
There has been a large earthquake swarm on the Reykjanes Peninsula over recent months, still ongoing at the time of writing, albeit with reduced intensity.
The Reykjanes Peninsula lies at the south west tip of Iceland on the Mid Atlantic Ridge, the boundary between the North American and Eurasian Plates. The North American Plate is moving westwards in relation to the Eurasian Plate; transform and extension faulting accommodate the relative Plate motions. The Reykjanes Volcanic Belt lies on the Reykjanes Peninsula, comprising five north east trending volcanic systems: Reykjanes, Svartsengi, Krýsuvík, Brennisteinsfjöll and Hengill. The volcanic systems are fissure swarms.
Earthquakes
The line of earthquake epicentres in Fig 1 shows the path of the Mid Atlantic Ridge. These earthquakes were extracted from the data set used to generate the plots in the earlier post introducing Iceland. The raw earthquake data is publicly available data downloaded from the Icelandic Meteorological Office for the period January 2016 to 12 April 2020. The plot above is still data-heavy (too much data to see what is happening) so I have extracted the earthquakes by month to see where and when most activity occurred.
In the plots there is an impression of seismic activity trending along the Peninsula from the east to the west. This impression is born out most strongly in the activity from month 48 onwards. Although it should be noted that the level of activity for these months is unusually high.
There are several possible reasons for the east to west trending of the earthquake swarms:
the plates do not move smoothly past each other, so friction generates faults and earthquakes;
rifting is occurring to accommodate the upward motion of land further to the east, generated by the mantle plume in the vicinity of Vatnajökull; and /or,
magma intrusion in local volcanoes.
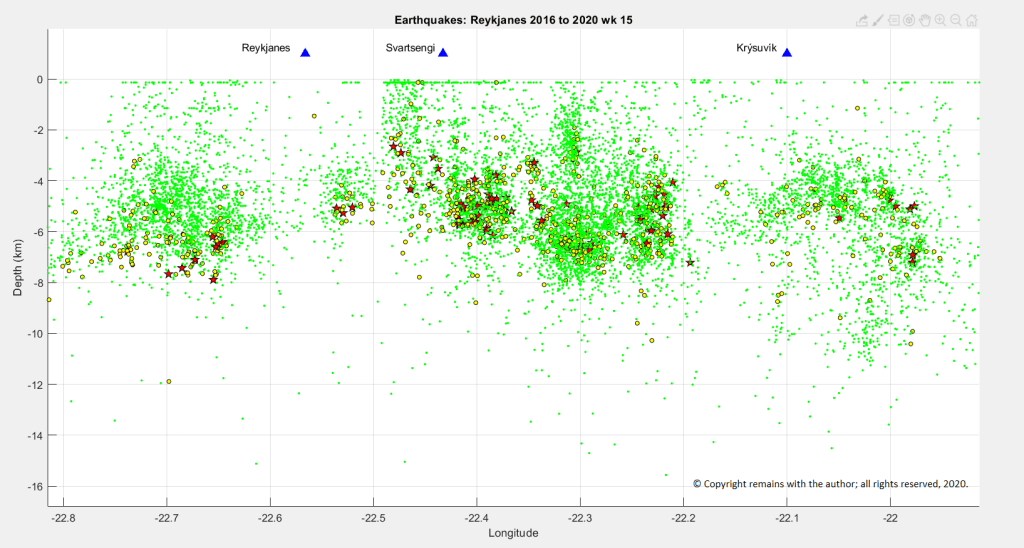
Let’s take a look at depth plots of earthquakes under the Reykjanes / Svartsengi area. This shows that the earthquakes over 3 M are largely in the lithosphere.
Plotting depth against longitude, effectively looking northwards through the swarms, also shows that most larger quakes are in the lithosphere but some over 2 M track towards the surface. On its own, this is not enough to draw any conclusions over the likelihood of an eruption; field observations, including gas emissions and ground deformation are required to determine how close to the surface magma may be.
These swarms were accompanied by local uplift, as shown by local GPS stations.
Fig 9: Uplift in the vicinity of Mt Thorbjörn as shown in recent GPS plots published by IMO: https://en.vedur.is/. THOB moved south eastwards and ELDC moved westward; both showed uplift.
IMO(3) has reported that the most likely explanation for the recent swarms and uplift is a magma intrusion near Mt Thorbjörn at depth; Mt Thorbjorn is located near the Blue Lagoon, Svartsengi. As to whether or not magma will reach the surface for an eruption and where it emerges, we will have to wait and see. In the meantime, let’s look at the recent activity in historical times.
Historic Volcanic Activity
As noted earlier, the volcanic systems are fissure swarms. Activity is driven by rifting which enables magma to reach the surface. The most recent onshore volcanic activity took place between 940 AD and 1340 AD; later activity has been offshore. Onshore lavas from these eruptions tend to be tholeiitic basalts (1). The systems are still active as demonstrated by current geothermal activity.
Hengill
Fig 10: Image cropped from one by Hansueli Krapf, published under cc licence: CC BY-SA 3.0
The Hengill volcanic system is a series of fissure vents, crater rows and small shield volcanoes, with a highest point of 803m. It lies at the triple junction of the Reykjanes Peninsula volcanic zone, the Western volcanic zone and the South Iceland seismic zone. The lava types are basalt / picro-basalt, andesite / basaltic andesite and rhyolite. Hengill’s lavas are more complex that those to the west, reflecting its position at the triple junction. GVP(2) lists 13 Holocene eruptions ranging between VEI 0 and VEI 2; the last known eruption was a VEI 2 in 150 AD.
Brennisteinsfjöll
The Brennisteinsfjöll volcanic system is a series of crater rows and small shield volcanoes, with a highest point of 610m. Its lava types are basalt / picro-basalt. GVP(2) lists 9 Holocene eruptions ranging between VEI 0 and VEI 2. One eruption, previously attributed to Hengill, occurred during a meeting of the Icelandic parliament at Thingvellier in 1000 AD. The most recent eruption was a VEI 2 in 1341.
Krýsuvík
Fig 11: Image cropped from one by Reykholt, published under creative commons licence: CC BY-SA 3.0
The Krýsuvík volcanic system is a series of crater rows and small shield volcanoes, with a highest point of 360m. Like Brennisteinsfjöll, its lava types are basalt / picro-basalt. GVP(2) lists 11 Holocene eruptions ranging from VEI 0 to VEI 2; the most recent of which was in 1340. The Krýsuvík Fires spanned a period between 1151 and 1188, producing 36 km2 of lava.
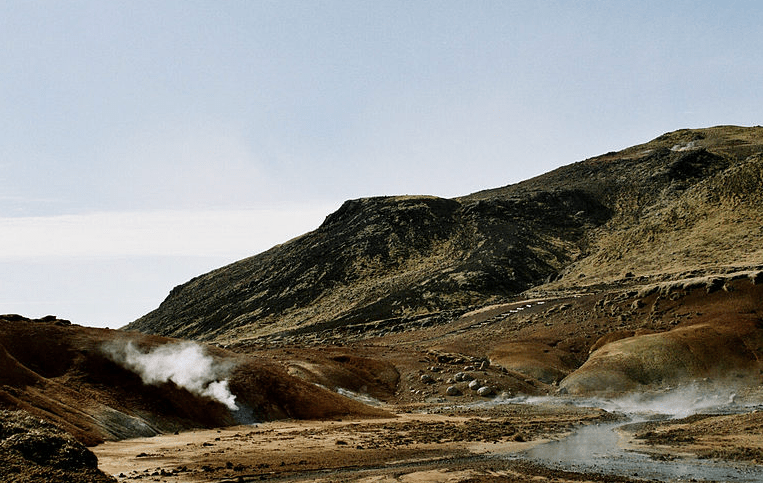
Reykjanes & Svartsengi
Fig 12: Image of Svartsengi Power Station from one by Jóhann Heiðar Árnason, published under creative commons licence: CC BY-SA 3.0
The Reykjanes volcanic system is a series of crater rows and small shield volcanoes, which extends offshore and includes several small islands. Reykjanes highest point is 140m. The Reykjaneshryggur volcanic system is a submarine system which is considered part of Reykjanes. GVP includes Svartsengi as a crater row of Reykjanes. Reykjanes lava types are basalt / picro-basalt. GVP(2) lists 22 Holocene eruptions ranging between VEI 0 and VEI 4, of which the most recent was a VEI 0 in 1970; the VEI 4 was in 1226. The 1226 eruption was part of the Reykjanes Fires which started in 1210 and lasted until 1240.
The area is one that has had a period of intense volcanic activity, so the recent earthquake swarms have generated a lot of interest.
Regular updates on seismic and volcanic activity in Iceland are published by the Icelandic Meteorological Office(3).
The Armchair Volcanologist
14 May 2020
References & Further Reading:
David W Peate, Joel A. Baker, Sveinn P. Jakobsson, Tod E. Waight, Adam J. R. Kent, Nathalie V. Grassineau, Anna Cecile Skovgaard , 2009. “Historic Magmatism on the Reykjanes Peninsula”, Contrib Mineral Petrol (2009) 157:359-382
Smithsonian Institution Natural History Museum Global Volcanism Program (GVP): https://volcano.si.edu