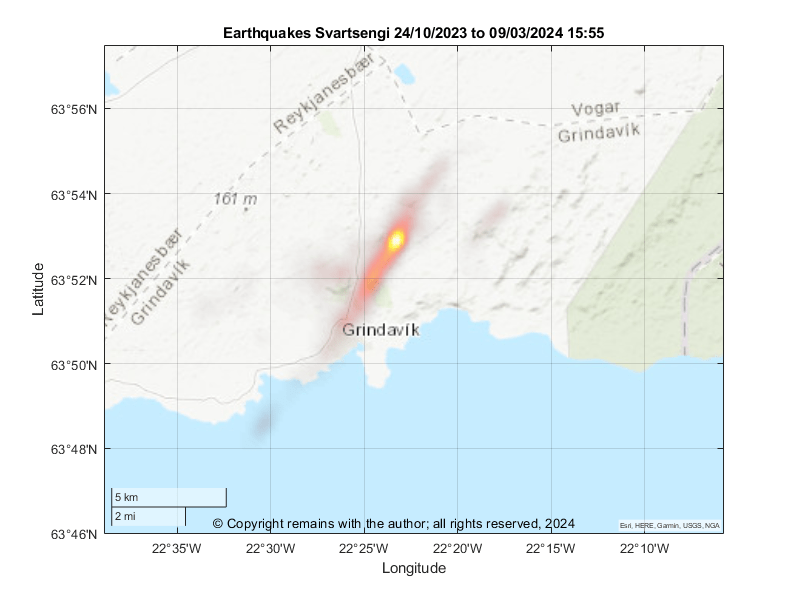
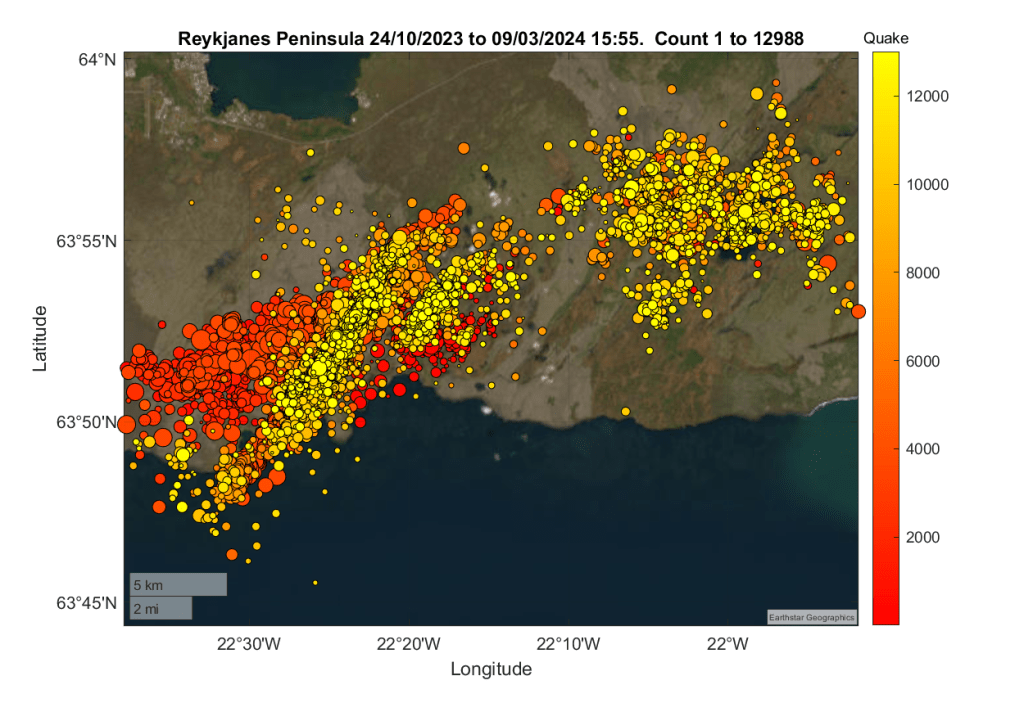
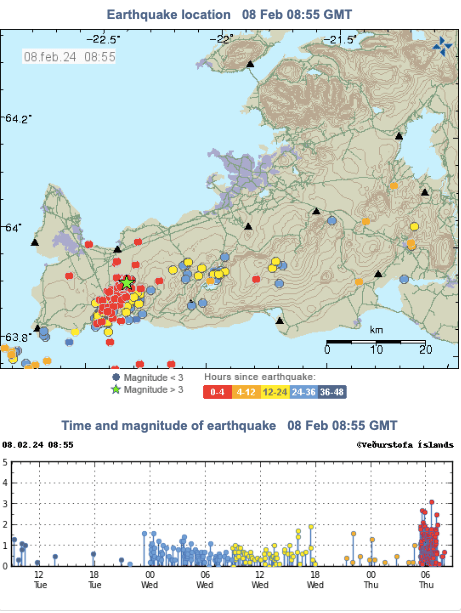
While waiting to see where and when the next eruption on the Reykjanes Peninsula occurs, we have updated our earthquake plots for the area between 63.746°N, 22.631°W and 63.996°N, 21.864°W from 24th October 2023 to 9th March 2024 – a total of 12,988 earthquakes. We have extended the area plotted to include Krýsuvík.
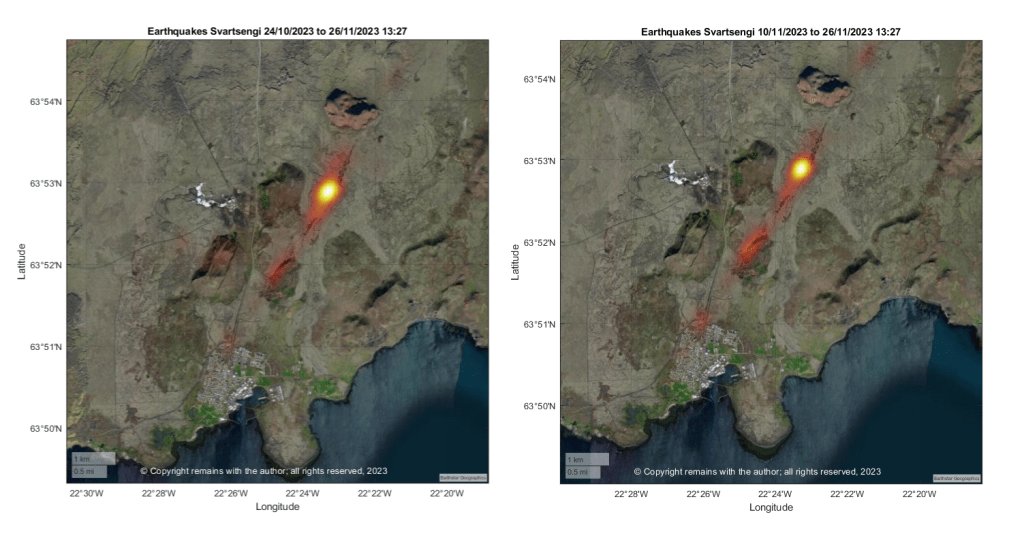
First, we start with the geodensity plot for the period 24th October 2023 to 9th March 2024. Most activity is still occurring on the magma intrusion / graben between Hagafell and Stóra-Skógafell. The earthquake density plots for the entire period also picks up some activity southwest of Grindavík, west of Fagradalsfjall and at Mount Þorbjörn. This shows best on a topographic map with a lighter background.
Next, we look at the geoscatter plot for the same area and period. This shows the activity along the magma intrusion / graben, that west of Fagradalsfjall, and, also, an upkick in activity in the Krýsuvík area. The last may be local faults accommodating the uplift at Svartsengi. Whether or not this lets magma ascend in the Krýsuvík volcanic system, itself, remains to be seen. At the time of writing, the alert level for Krýsuvík is unchanged at green.
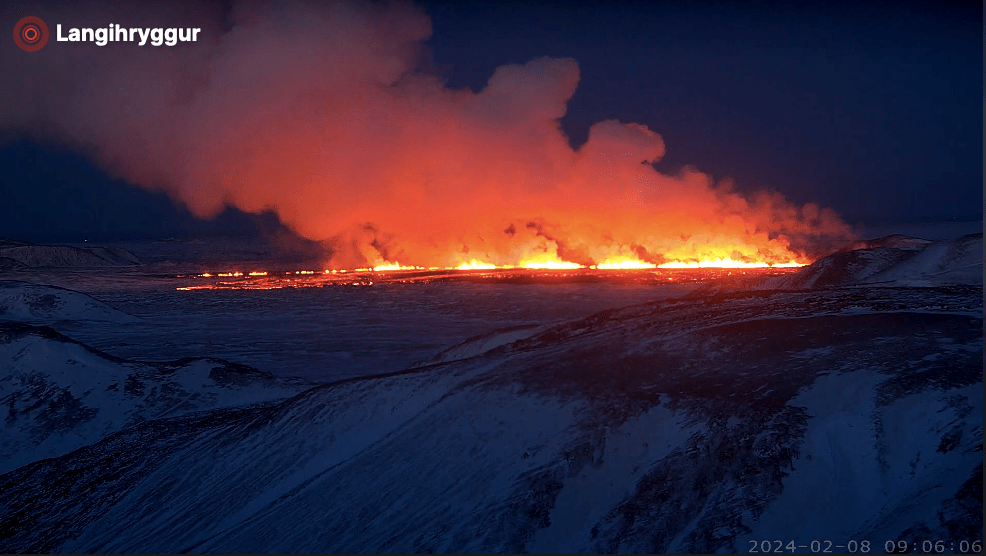
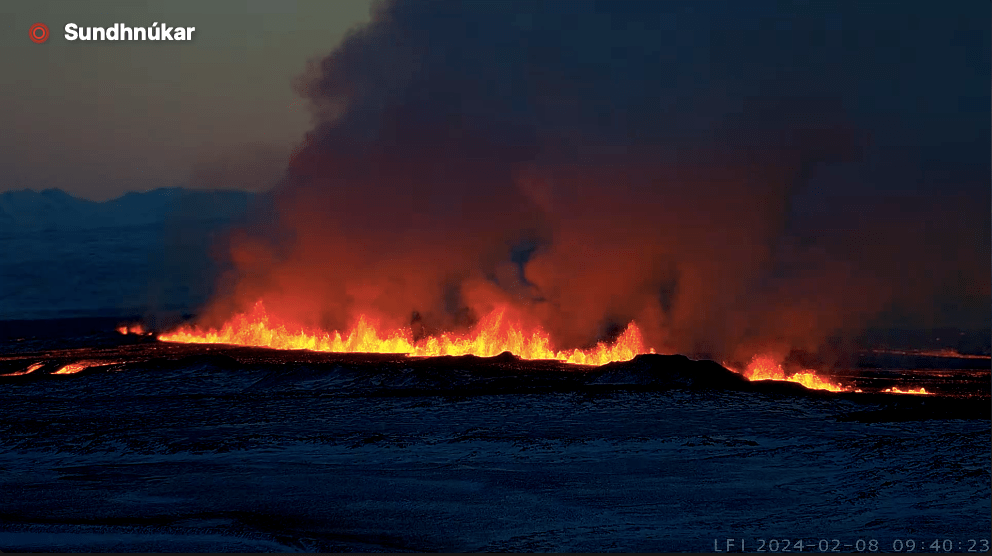
The eruption start early this morning at 6am with a 3km long fissure near to the location of the 18th December 2023 eruption. Lava is flowing westwards.
At the time of writing there is no immediate threat to Grindavík the Blue Lagoon or Svartsengi Power Plant. No-one is thought to have been in Grindavík when the eruption started; the Blue Lagoon was evacuated successfully. It will be some time before lava may reach the protective walls round Grindavík.
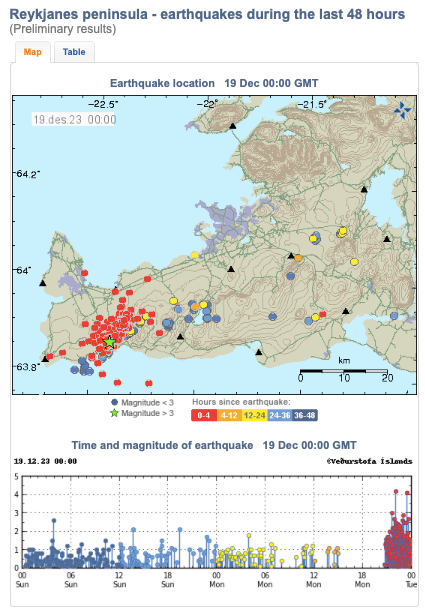
The eruption started with little notice. The precursors were an earthquake swarm which started 30 minutes before at 5:30 am and around ten minutes later pressure changes in bore holes at the power plant were noted.
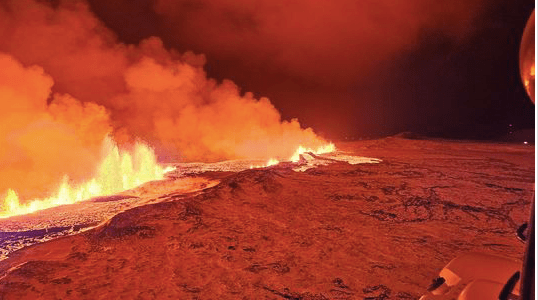
The eruptive mechanism is similar to the two previous eruptions. Magma flows into the channel and then erupts with jets of lava. Lava fountains are currently reaching 80m height and the plume rises to 3km.
Inflation has been continuous at Svarsengi since the December 18th eruption. It is too soon to see what effect thus eruption has had on local ground deformation.
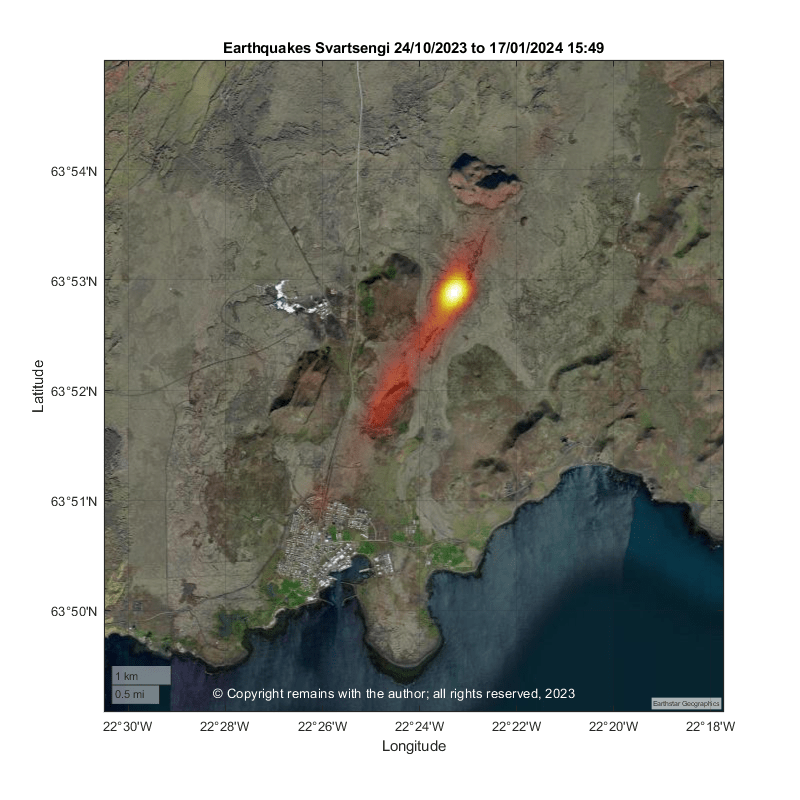
There are no signs of eruptive activity, however, inflation still continues at Svartsengi.
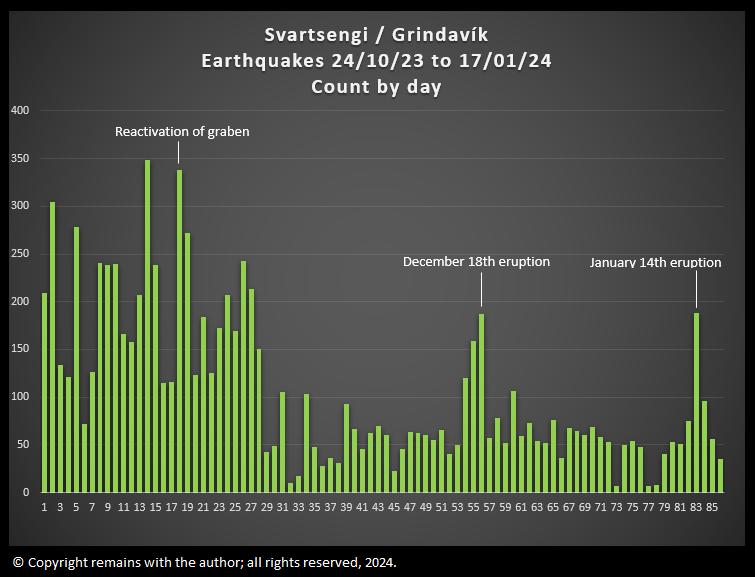
We have updated our earthquake plots to 17th January 15:49. The geodensity plot shows an increase in density south westwards from the hotspot. The geoscatter plots (latitude v longitude) show the development of seismic activity near Fagradalsfjall after the December eruption in addition to activity at Svartsengi / Grindavík.
We recommend that you watch the videos on YouTube rather than here; you can adjust the size and speed more easily there.
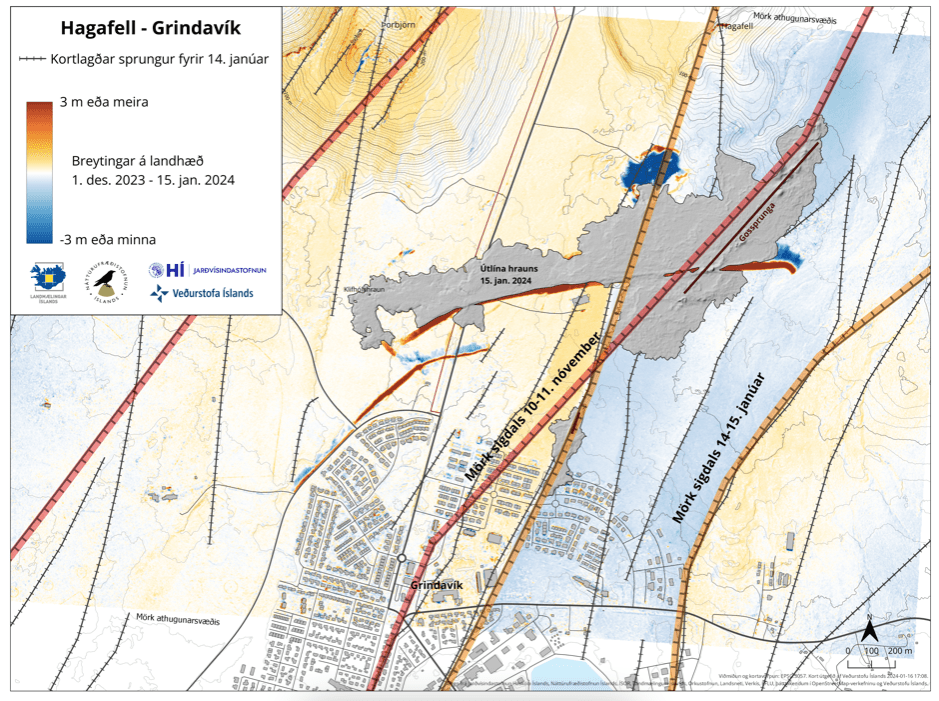
IMO are reporting that a new graben has formed to the east of the graben which formed in November 2023. The new graben is between 800m and 1,000m wide with a depth of up to 30cm, whereas the older graben is 2km with with depths of up to 1.3m. The new graben is widening and deepening. Unfortunately, this increases the risk of new fissures in and around Grindavík.
Because a new graben has formed the magma intrusion which supplied the 14th January 2024 eruption is thought to be further east than that which supplied the 2023 eruptions.
Fig 6: Map published by IMO showing the location of the graben which formed in November 2023 and the new graben which formed in January 2024. The graben are outlined by red lines; the new graben is coloured in blue. The grey areas are the lava flows from the January 2024 eruption. Warm colours denote land which rose and blues denote land which dropped (note some is due to the creation of the defensive walls). Source: https://vedur.is/um-vi/frettir/jardskjalftahrina-nordan-vid-grindavik-hofst-i-nott
Meanwhile, inflation at Svartsengi continues. This is thought to be due to more magma entering the system.
Update, 16th January 2024
From what we can see on the webcams, the eruptive activity (or this phase of the eruption) seems to have ended on the northern fissure at around midnight last night. Activity on the southern fissure ended yesterday.
It is too early for the eruption to be declared over. Inflation continues at Svartsengi and has resumed at the stations which recorded initial inflation. New fissures may open with little to no warning.
Three properties were lost to lava. The defensive walls were effective in diverting most of the lava flow from the town, itself, despite not being completed. We do not know whether or not livestock and pets trapped in the town have been rescued. The full damage to the town has yet to be assessed. However, due to ground deformation with displacement of up to 1.4m spread over existing and new fissures, new surface cracks can appear without warning.
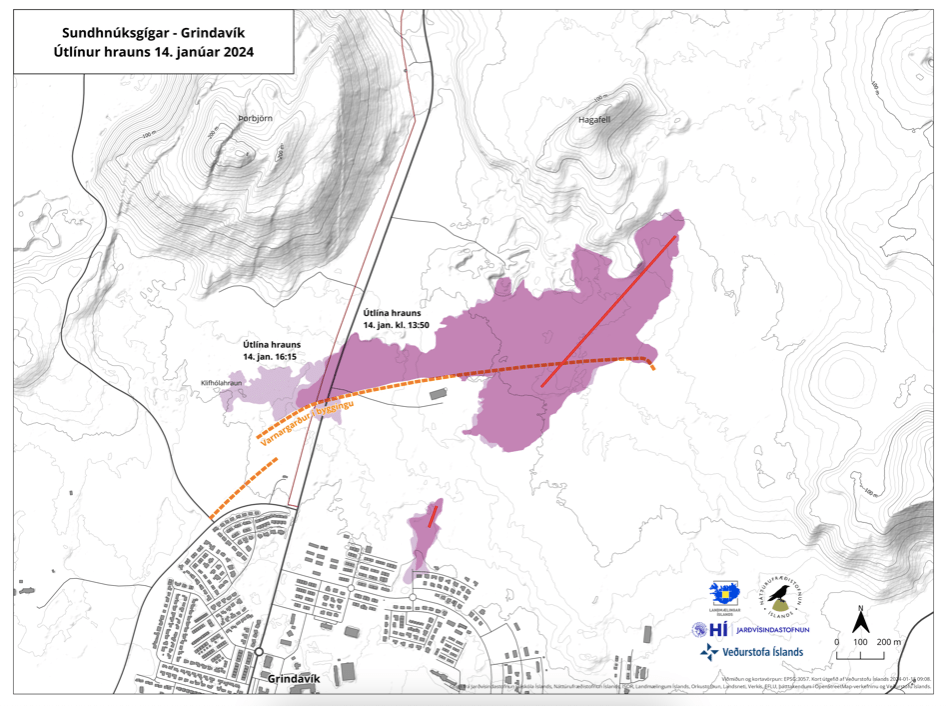
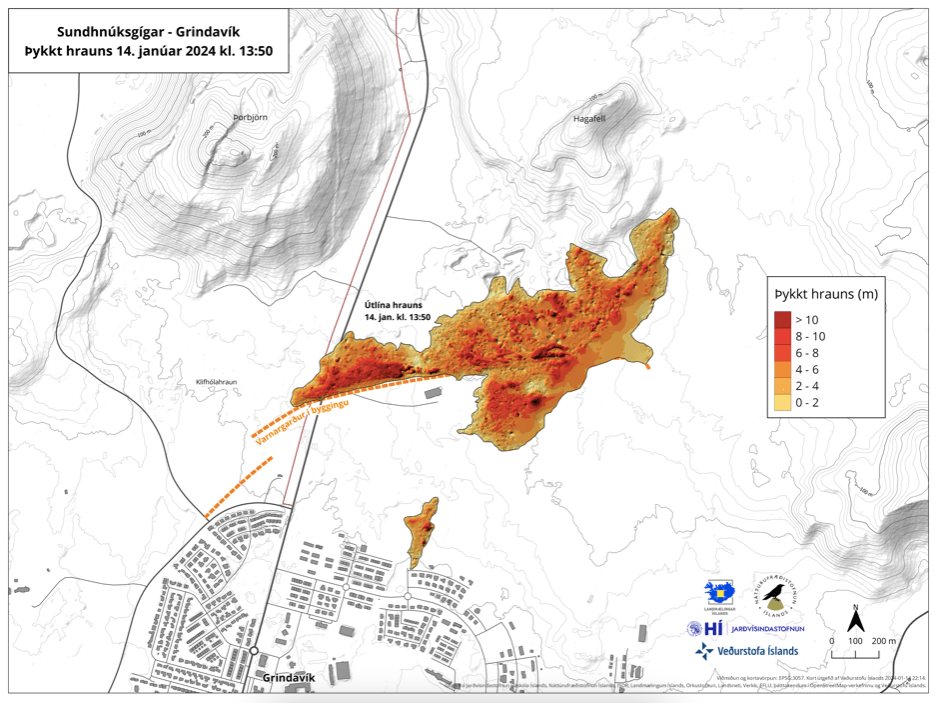
IMO has also published maps showing the extent of the lava flow as of yesterday and thickness of the lava flow. The se also show how the defensive walls diverted lava and lava pooling by the defensive wall.
Fig 4: Map published by IMO showing the extent of the lava flows. The dark purple area is the extent of the lava as at 1:50 pm on January 14; the light purple shape shows the extent as of 4:15 pm. The eruptive fissures are denoted by red lines and the defensive walls are represented by orange dotted lines. Source: https://en.vedur.is/about-imo/news/a-seismic-swarm-started-north-of-grindavik-last-night
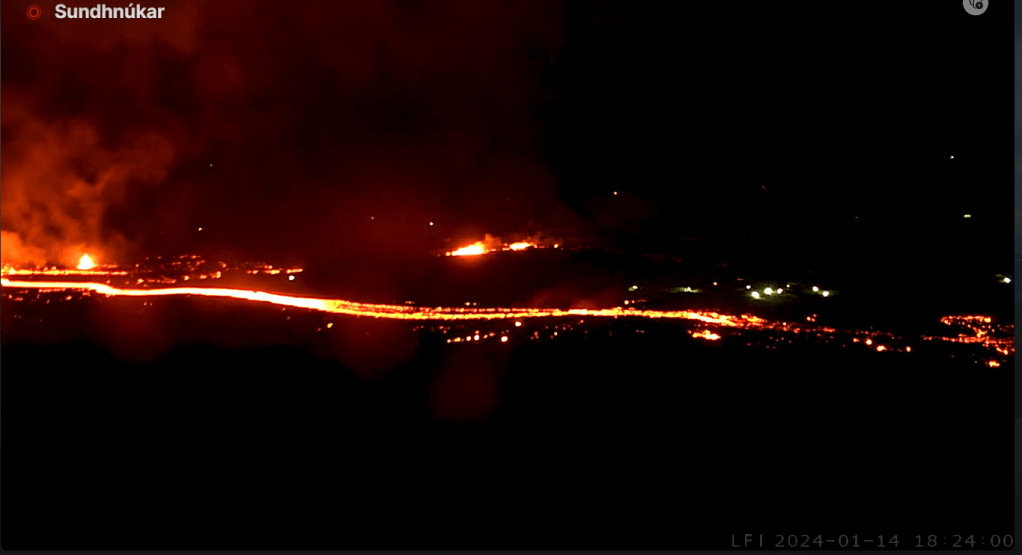
Two eruptive fissures have opened north of Grindavík today. The summary below is sourced from IMO’s updates and RUV’s live English blog.
Inflation at Svartsengi had continued uninterrupted since the 18th December 2023 eruption at the Sundhnúksgígar crater row. A new earthquake swarm started before 03:00 UTC today (14th January 2024) at the the Sundhnúksgígar crater row migrating south westwards towards Grindavík. By 05:30am both seismicity and ground deformation indicated that the magma intrusion had propagated under the town.
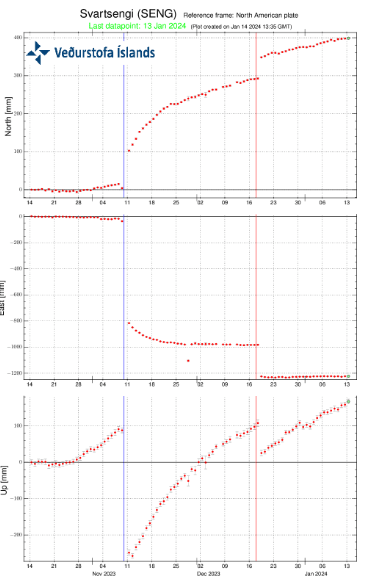
Fig 2: Inflation at Svartsengi. Source: IMO
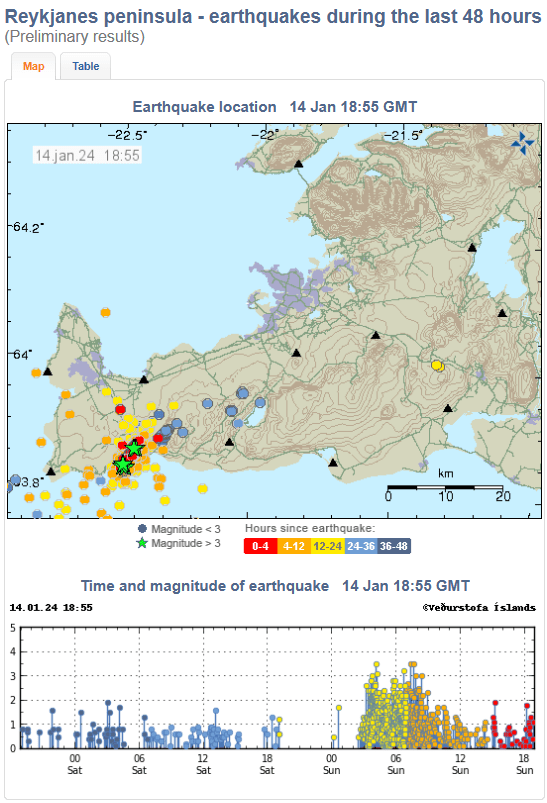
Fig 3: Earthquake swarm today. Source: IMO
A fissure opened east of Þorbjön and southeast of Hagafell, the southern most part of which was 900m from Grindavík. By 10:44, the fissure was around 1 km in length. A second fissure opened at 12:10 just north of the town. Lava has now entered the town.
Grindavík was evacuated at c.03:00 this morning. However, some sheep and other animals kept in the town were trapped.
The defensive walls built to protect the town from lava were working well, despite not being completed, until the second fissure opened; the fissure’s southern most end was south of the defensive walls.
The authorities are asking that sight seers keep away from the site at the moment. We have given links to some webcams where you can view the eruption live.
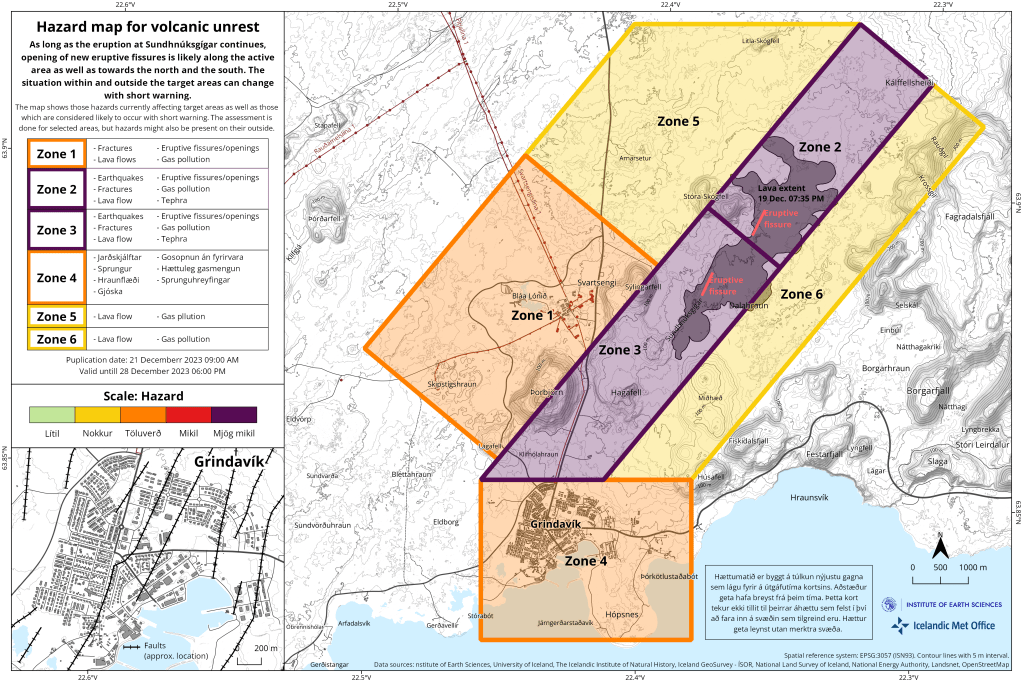
IMO have confirmed that the eruption has ended. However, since uplift resumed immediately at Svartsengi after the onset of the eruption and is at a higher rate than that which preceded the eruption, magma is still accumulating under Svartsengi and the risk of further eruptions increases daily. The rate of uplift decreased prior to the eruption; this process is thought likely to be repeated. The most likely site for another eruption is thought to be between Stóra-Skógfell and Hagafell.
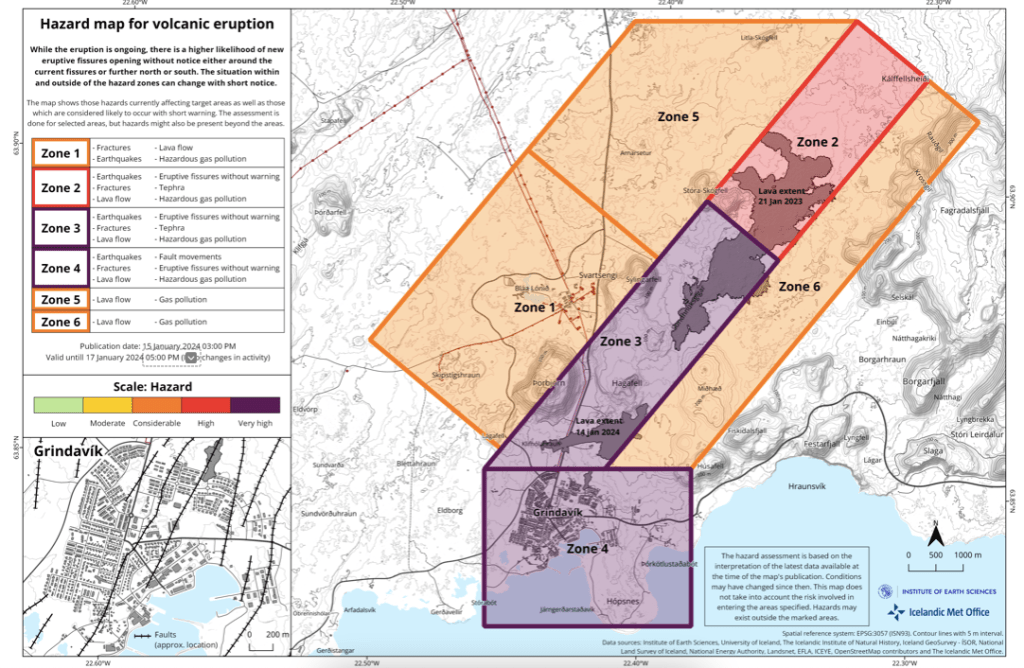
A new hazard assessment has been issued by IMO. It can be found here: https://en.vedur.is/about-imo/news/a-seismic-swarm-started-north-of-grindavik-last-night . The purple zones (very high risk) over the magma intrusion have been lowered to red (high risk); all other zones remain the same. The hazard level for Grindavík remains considerable. Conditions can change rapidly and adverse weather can hinder detection, reducing warning time.
At risk of jinxing it, the eruption appears to be over. Activity decreased late last night / early this morning. Scientists who viewed the site from the air today report that there is no visible activity in the craters and the lava flow appears to have ceased. It is, however, feasible that lava is flowing in closed channels. It would be premature to declare the eruption over. Scientists continue to monitor the area. Source: https://en.vedur.is/about-imo/news/a-seismic-swarm-started-north-of-grindavik-last-night
IMO are reporting that the eruption remains steady today. The authorities are concerned that the eruption started with considerable force after only an hour from the start of the latest episode in the seismic swarm. Magma is most likely sourced from Svartsengi, which has had several periods of inflation since 2020, although the eruption started on the magma intrusion which formed on 10th November 2023. The current level of activity is comparable to recent eruptions at Fagradalsfjall.
A new risk assessment has been carried out. Seismic activity has remained fairly steady, following the initially intense swarm, and ground deformation has not changed significantly to date (or not as much as during the formation of the November magma intrusion). The risk of a new eruptive site forming near Grindavík is thought to have decreased but the risk still remains substantial. Magma can reach the surface quickly, not giving the authorities much time to issue warmings. The most likely sites for new activity remain over the November magma intrusion. A new hazard map has been created.
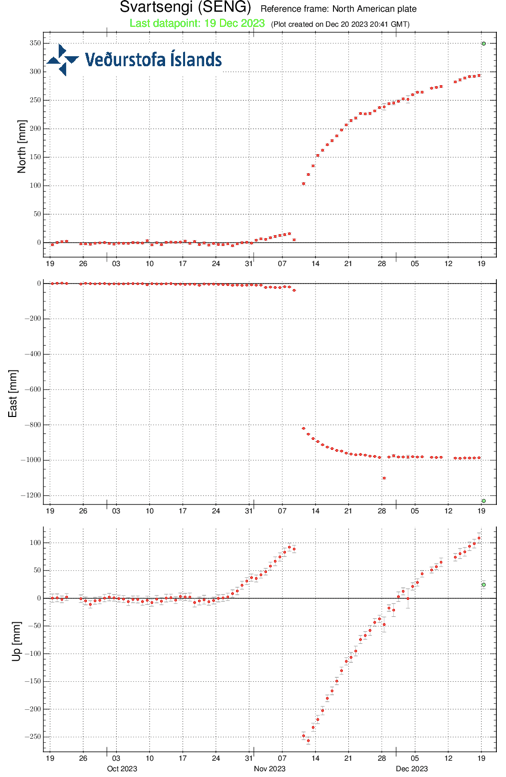
Fig 6: Ground deformation at Svartsengi. Source: IMO
Scientists collected lava samples on 19th December 2023. Their analysis shows a composition of c.6% Mg2O, c.2.29% TiO2 with a K2O/TiO2 ration of 0.23. The lava is thought to be more evolved than the lavas erupted at Fagradalsfjall, having spent more time in the crust. It may have the same source as the recent Fagradalsfjall eruptions. (Source: https://jardvis.hi.is/is/eldgos-vid-sundhnuksgiga-nidurstodur-maelinga-18-desember).
Update 19th December 2023, 16:30 (video issues corrected)
The lava flow has decreased and is now about 25% of the initial output.
The Coast Guard reports that the eruption is now mainly in two places on the fissure and a small vent in the south. The larger sites are each c. 300 metres to 500 metres long. The southernmost site is c. 2 kilometres north of Sundhnúk. There is also a very small site north east of Stóra-Skógsfell.
Magma plumes are also smaller, reaching about 30 meters at their highest point. Lava is currently flowing eastwards towards Fagradalsfjall, with two smaller flows heading westward, both north of Stóra-Skógfell.
The eruption is currently following a similar pattern to recent volcanic eruptions at Fagradalsfjall, where the fissures have started to contract and form single vents.
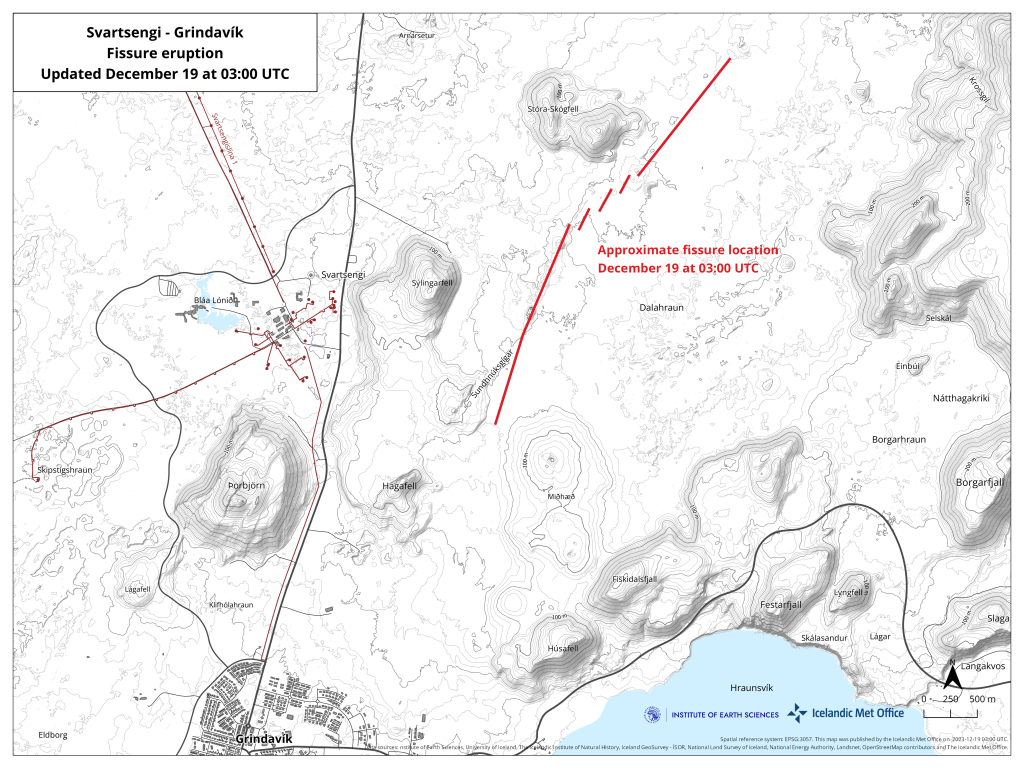
This evening an intense earthquake swarm started c. 20:40 local time, north of Grindavík, following the path of the recent magma intrusion. This heralded the eruption which started just after 10:00pm. The eruption is located close to Sundhnúkagígar, about four kilometres northeast of Grindavík. At the time of writing, the aviation code is orange.
The local authorities are evacuating Grindavík and Reykjanesbraut (the road which connects Reykjavik to the airport). A civil defence emergency has been declared. This is not a tourist eruption.
The eruption is powerful, with jets reaching hundreds of metres high. The initial fissure was 200m to 300m long, with a lava flow of 100 to 200 cubic metres per second. The fissure has now reached c. 3.5km length. There is a risk that lava may reach Grindavík.
Prior to the eruption, inflation at Svartsengi had reached 10th November 2023 levels prior to the formation of the graben and magma intrusion.
Fig 3: inflation at Svartsengi. Source: IMO.
For updates, please consult the relevant authorities, for example, IMO and Department of Civil Protection and Emergency Management
We will update our earthquake plots as soon as we get a chance.
At the time of writing, the eruption has not materialised. The swarm continues, albeit the magnitude and number of the earthquakes has decreased.
The status of Grindavík has been downgraded from “emergency” to “danger”. The aviation code has been reduced to yellow. If an eruption does ensue from this swarm, the most likely location is between Hagafell and Sýlingarfell.
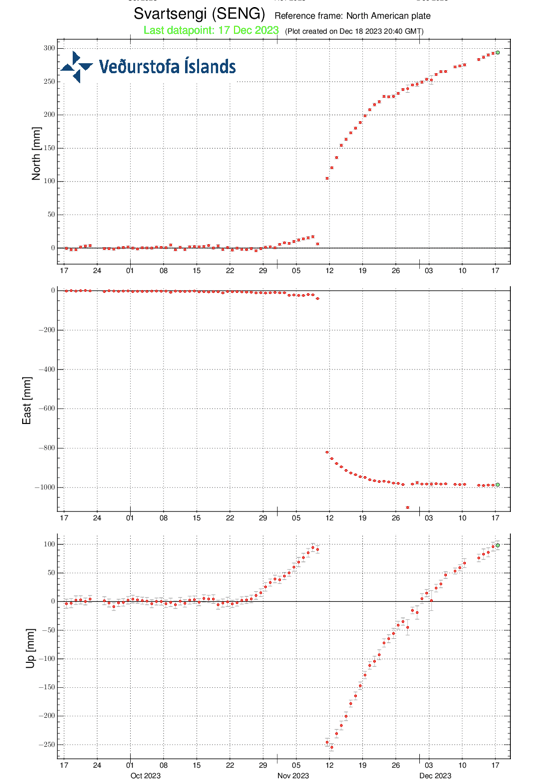
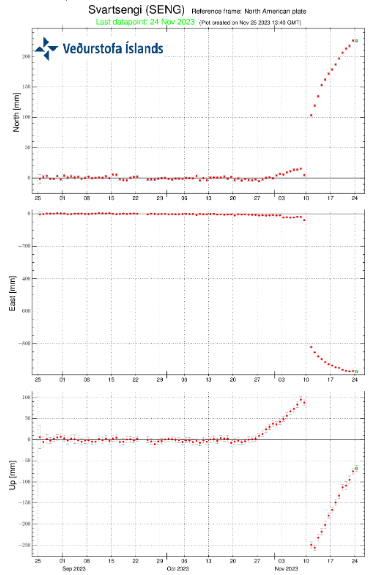
On 21st November 2023, IMO reported significant uplift in the vicinity of Svartsengi. While an eruption may follow here, it is thought that it would be preceded by an increase in seismic activity. There is still a likelihood of an eruption near the magma intrusion. Since then, uplift has continued.
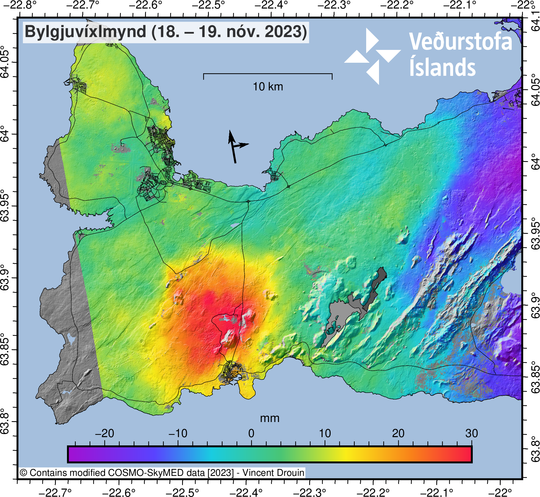
Fig 33: COSMO-Skymed interferogram spanning 24-hours between 18−19 November at 06:41. The broad uplift signal visible in orange/red around Svartsengi is indicative of inflation occurring at a depth of > 5km. Source: IMO
Fig 34: GPS from IMO showing ground deformation at Svartsengi. There was initial uplift at the start of the swarm, followed by large drop when the graben was reactivated / dike formed, which, in turn, is followed by resumed uplift. Source: IMO.
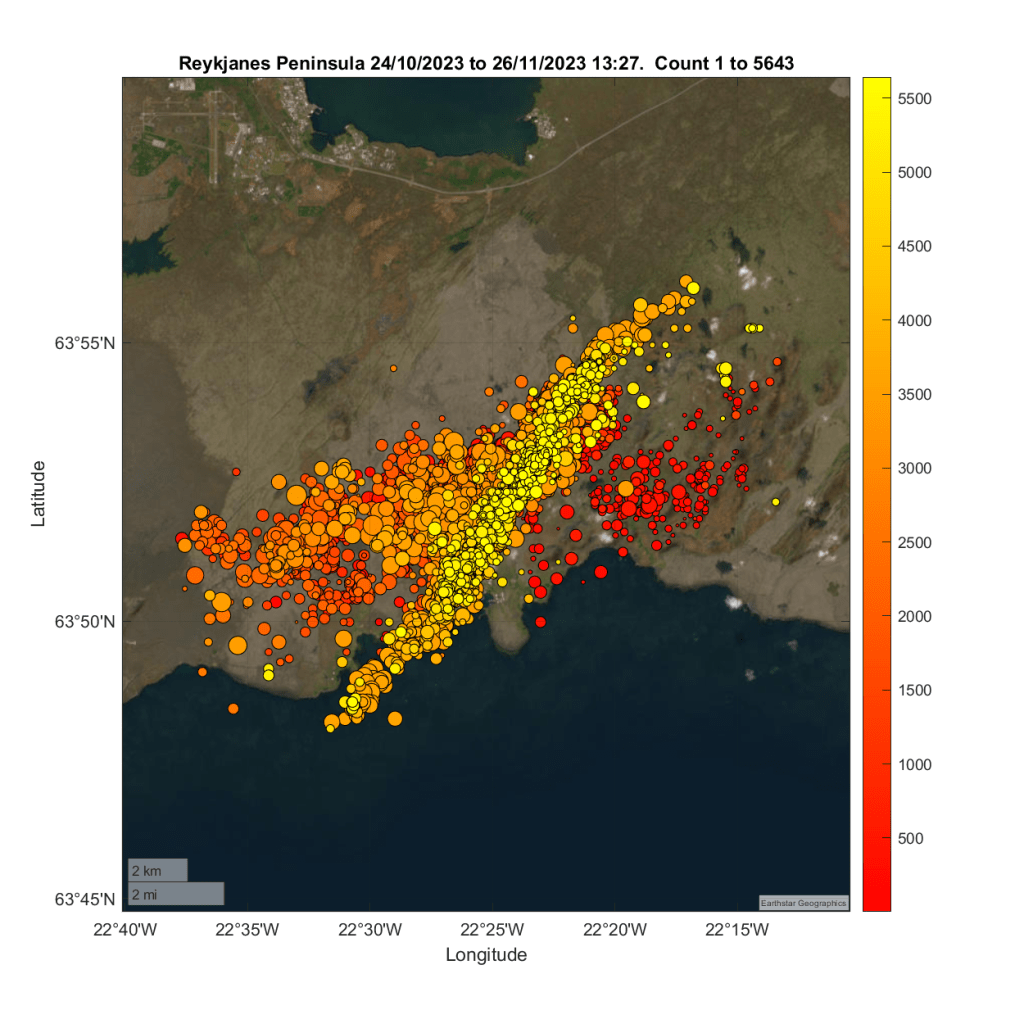
We have updated our earthquake plots from 24th October 2023 to 26th November 2023 13:27. Most activity is occurring along the magma intrusion, although it is focussed more on the area to the east of Sýlingarfell on Sundhnúksgigar.
Our plots show faults responding to magma, with decreasing seismic activity along the possible dyke formation since the reactivation of the graben. This may reflect the fact that magma has reached less brittle layers or most of the seismicity associated with the magma intrusion was in fact due to tearing of the crust in response to the inflation at Svartseni and environs, which, in turn, may or may not have allowed magma to flow into the formation. Time will tell.
Since our earthquake plots were compiled, there has been another small swarm to the east of Sýlingarfell.
We believe that this is the calm before the storm (an eruption) but when will the storm break?
For updates, please consult the relevant authorities, e.g IMO (link below).
14.03.2021: The magma intrusion on the Reykjanes Peninsula appears to be edging further southward. The longer this continues, the more likely an eruption. New plots added (Figs 13 – 15).
Update 14.03.2021
We have moved updates to the beginning of this post. The original post from 9 March 2021 and the earlier update are below.
We have updated our plots to 14.03.2021 17:46 for the area between 63.83314°N, 22.55148°W to 63.96605°N, 21.8566°W . Here are the results; the magma intrusion appears to be edging slowly further southwards, if we use the Department of Civil Protection’s line that the earthquake locations are the best indicator at the moment of where the magma is.
For the current status and advice, please consult IMO.
The Armchair Volcanologist
Update 12.03.2021
Since we wrote [our original post], the earthquake swarm continues unabated with several thousand more earthquakes and some more tremor pulses.
The Department of Civil Protection report today includes the following:
“Earthquake activity now reaches up to the Nátthagi valley south of Fagradalsfjall, which suggests that the southernmost end of the magma path lies there.
The magma path continues to expand although there is some uncertainty regarding the pace of the magma flow. Data has indicated that the magma path has been moving towards the south coast in the last few days, but latest surveys do not indicate that the path has moved notably in the last 24 hours.
With view of the eruption history and geological research, a volcanic fissure opening south of Fagradalsfjall and reaching the ocean is unlikely. Given the current circumstances, an undersea eruption with associated ash eruption is therefore unlikely.
As has been stated earlier in the Science Board’s notifications, while the magma path continues to expand it must be assumed that an eruption may occur in the area. The longer the current situation lasts, the more likely an eruption becomes. “
They also note that gas measurements are being taken in the area.
Our updated plots show the seismic activity moving further southward, notably the geodensity plot in Fig 12. There is also some parallel activity further west on a much smaller scale.
For the current status and advice, please consult IMO.
The Armchair Volcanologist
09.03.2021
An eruption considered likely; magma c. 1km below the surface.
Good Afternoon!
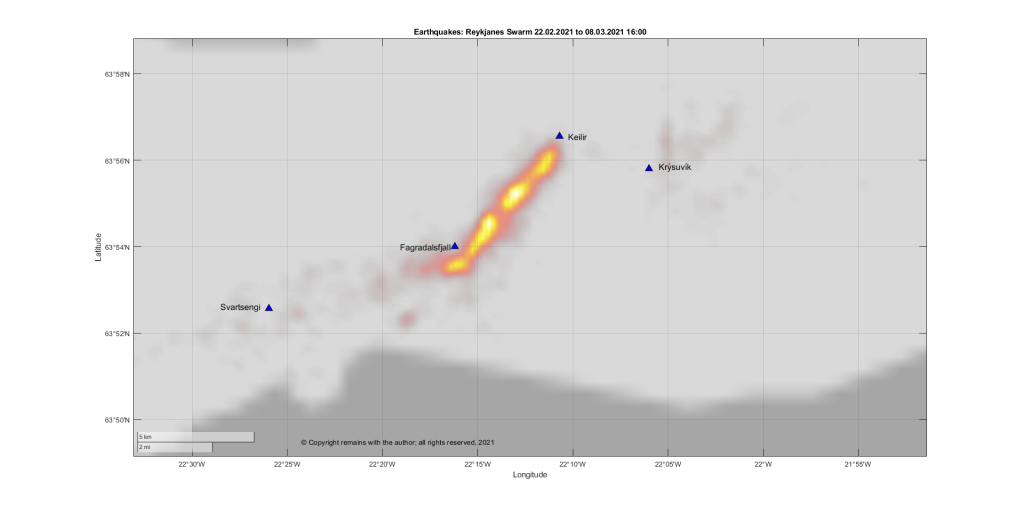
Despite the earlier tremor pulses, the Krýsuvík Volcanic System has not yet erupted. However, as seismicity continues to be intense, with well over 34,000 earthquakes recorded by Iceland’s SIL system now since 24 February 2021, it is thought that an eruption is likely.
The latest report from Iceland’s Civil Protection Service Council on March 8, 2021, states that if an eruption occurs, the most likely scenario is still a fissure eruption between Fagradalsfjall and Keilir. A magma intrusion (they use the term tunnel) is forming in the region, with most recent activity at its southern end. Magma has now reached an upper depth of c. 1 km. GPS and satellite readings indicate that the magma flow has decreased in the past week. If the intrusion continues to grow, further surges in seismic activity can be expected.
The earthquakes trending westward from the vicinity of the magma intrusion are thought to be the result of the crust accommodating the intrusion. No other magma movement has been detected during this swarm.
So where are Fagradalsfjall and Keilir? Here is a map (with directions on how to drive from one to the other, not that we would recommend that at the moment).
Fig 1: Extract from Google Maps showing the location of Fagradalsfjall and Keilir.
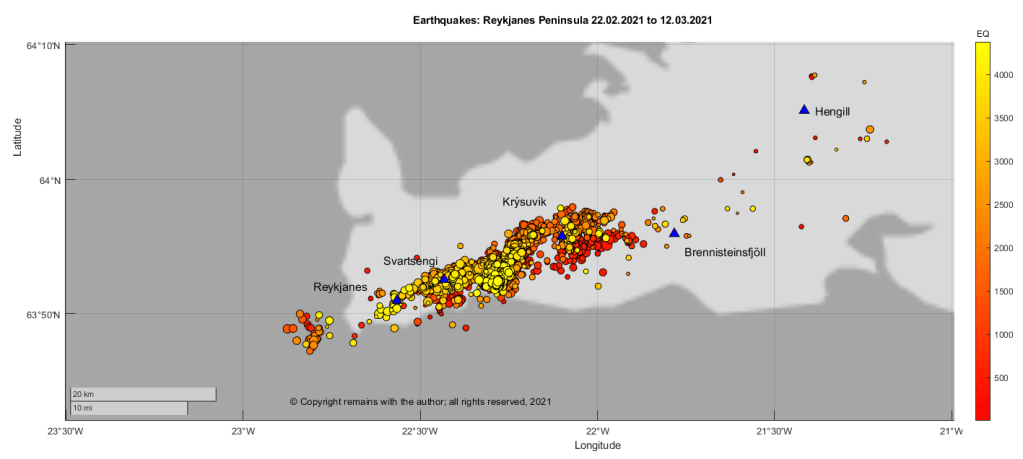
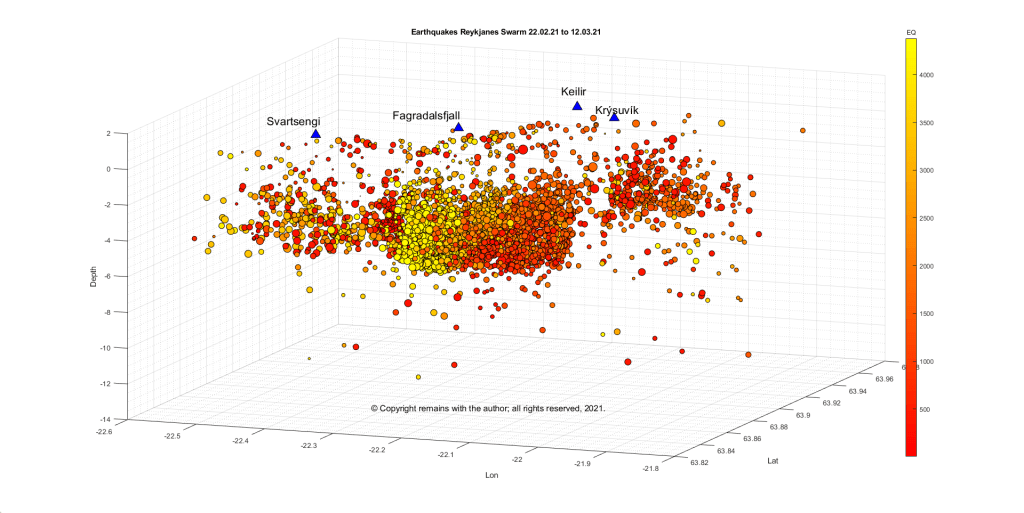
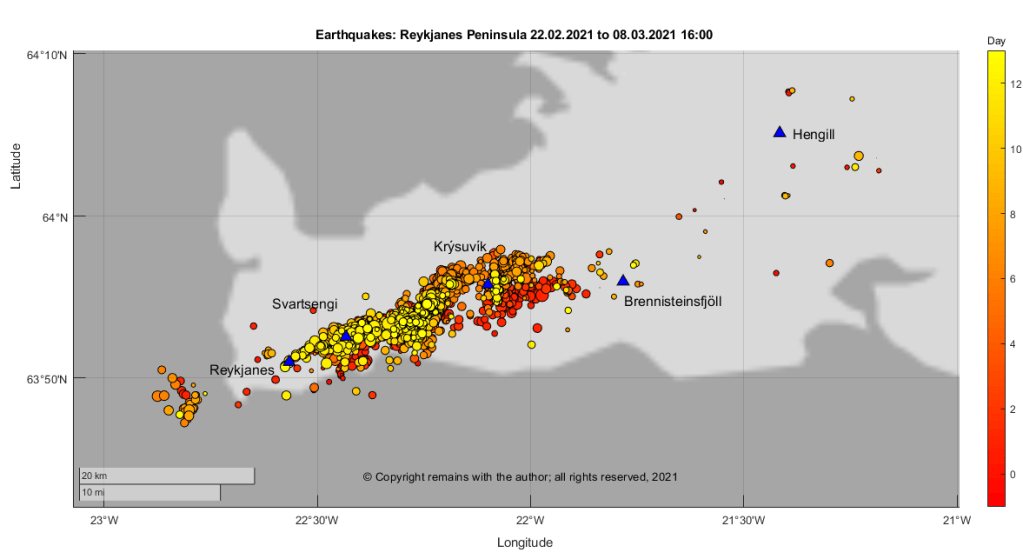
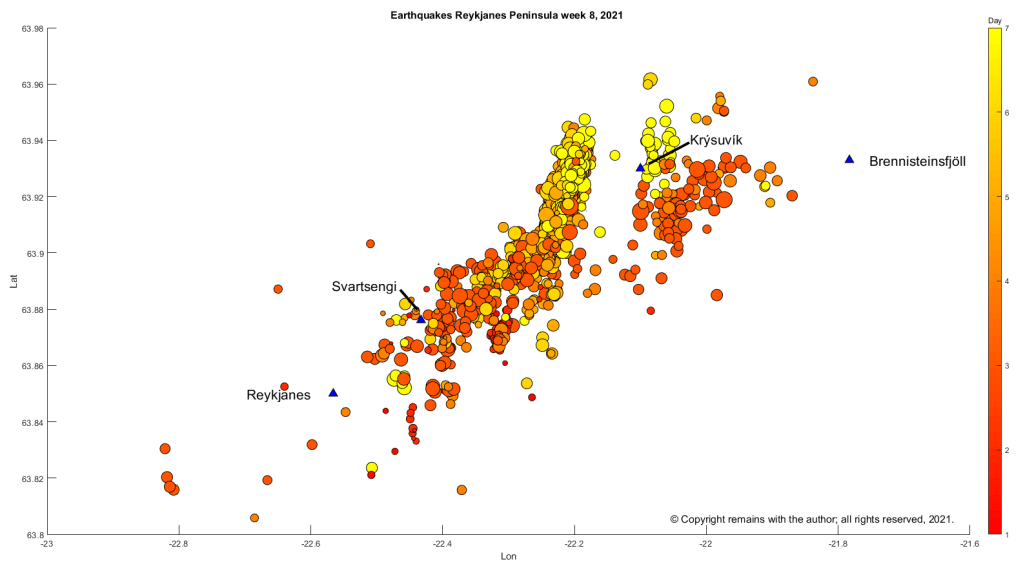
We have plotted the confirmed earthquakes for week 8 and week 9 2021, plus a few hours of yesterday, between 63.7°N, 21.0°W to 64.4°N, 23.0°W download from IMO’s site. Here are the latest plots for the Reykjanes Peninsula, 63.7°N, 21.0°W to 64.4°N, 23.0°W:
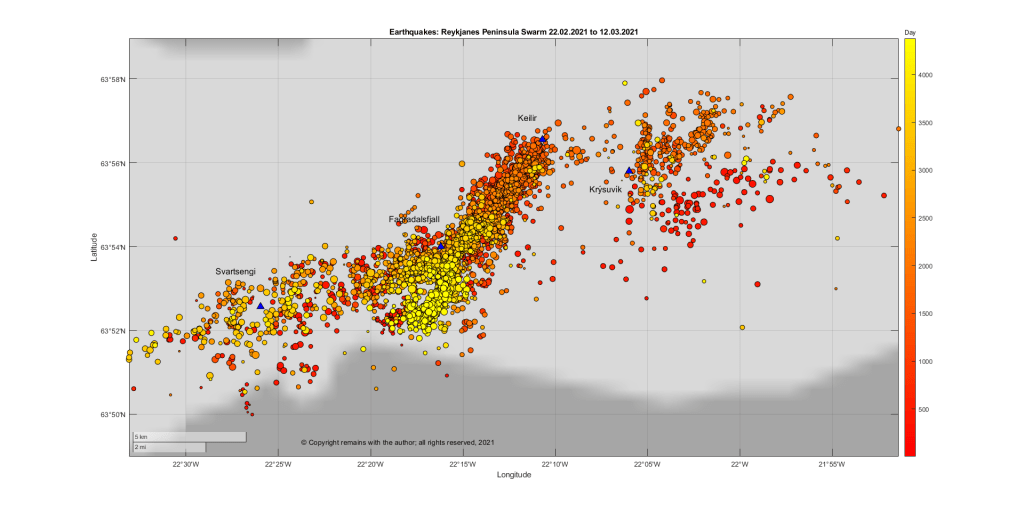
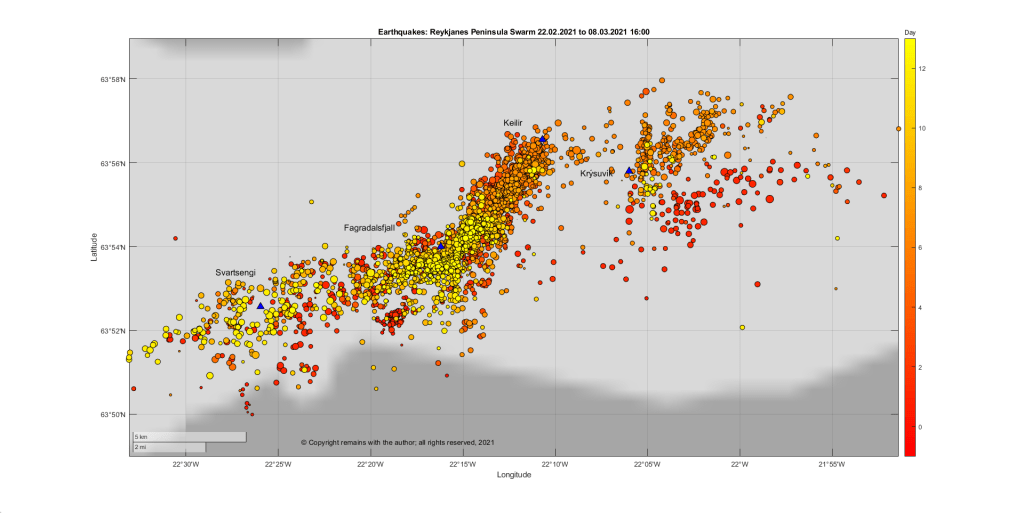
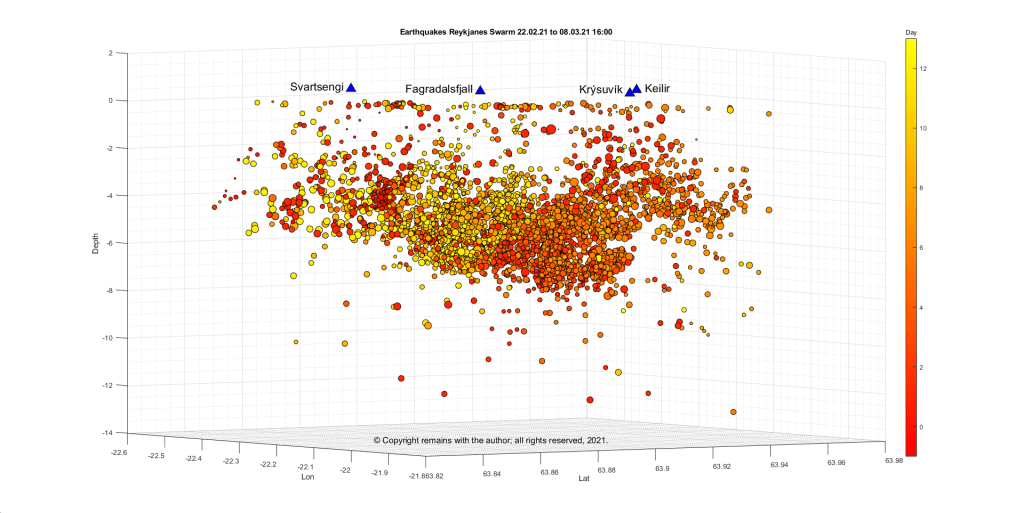
If we zoom in on the area between 63.83314°N, 22.55148°W to 63.96605°N, 21.8566°W we can take a closer look at the intrusion, itself, (or the earthquakes magma movement is causing). The area was selected to take in Svartsengi, Fagradalsfjall, Keilir and Krýsuvík.
Since we downloaded the data for the above plots, IMO have reported another short-lived burst in seismic activity at 05:20 this morning with a seismic tremor Mt. Fagradalsfjall, south of the intrusion.
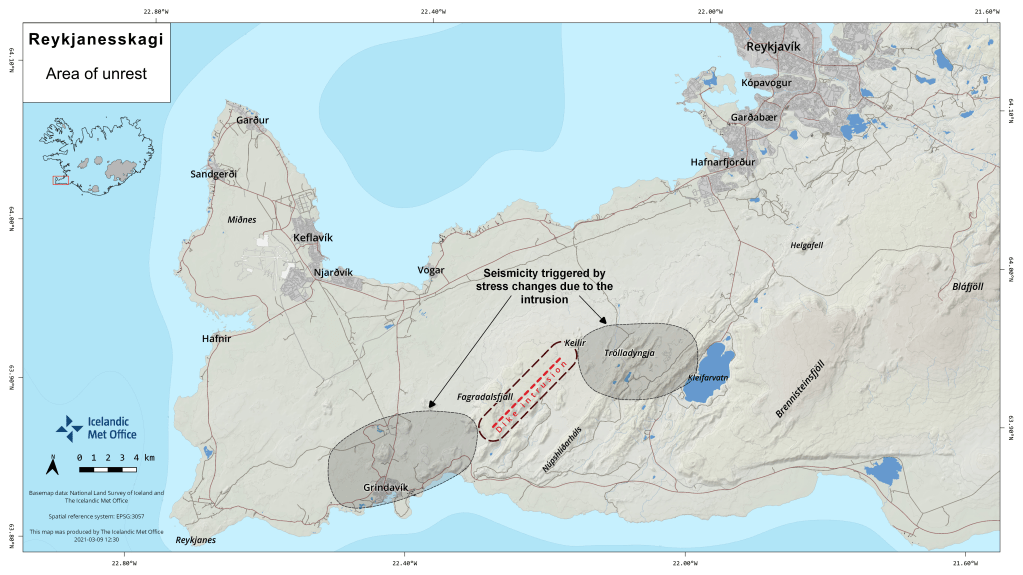
IMO have produced a map of the dike intrusion and the areas of seismic activity that are arising due to the increased tension in the crust caused by the intrusion.
Fig 8: Map by the Icelandic Met Office showing the dike intrusion and the areas of stress.
For the current status and advice, please consult IMO.
28 February 2021 (updated 2 March 2021 with the addition of earthquake plots showing rifting / dike formation)
Good Evening!
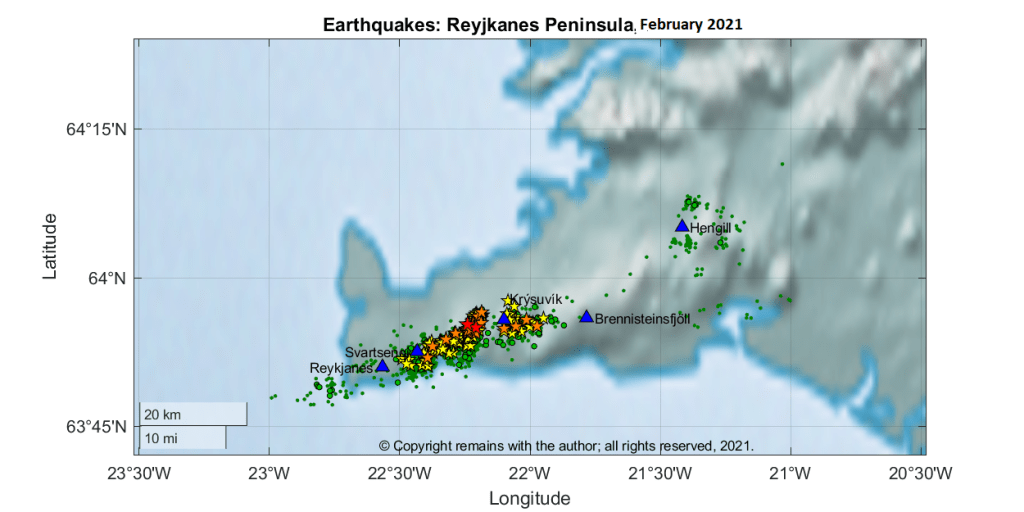
A large earthquake swarm started on 24 February 2021 on the Reykjanes Peninsula in the vicinity of the Krýsuvík volcanic system between Kleifarvatn and Svartsengi. At the time of writing the swarm is still ongoing with over 7,200 earthquakes record by Iceland’s SIL system. Three earthquakes of 5.0M or more have been recorded: 5.7M and 5.0M on 24 February and a 5.2 on 27 February 2021.
The alert level for the Krýsuvík volcanic system has been raised to yellow following sightings of steam jets in geothermal areas in the region after the 5.7M and 5.0M.
The Icelandic Met Office have attributed this swarm to the recent re-awakening of volcano-tectonic activity on the Peninsula.
We downloaded the confirmed earthquakes from IMO’s site to take a look. We plotted earthquake density for Week 8, 2021, earthquake locations for February 2021 and earthquakes by month from January 2009 to February 2021.
From our plots we can see the awakening of the volcano-tectonic activity with the upkick in number of earthquakes from December 2019. The current swarm is part of this activity.
At the time of writing, it is not possible to predict whether or not this activity will result in a local eruption in the near future. Only time will tell.
Update 1 & 2 /03/2021
Since writing the swarm has continued, with more than 15,000 earthquakes since it began last week.
The Department for Civil Protection has advised on 1 March 2021, that satellite images show deformation in the area has increased more than expected, indicating possible magma inflow.
We can see from the local GPS stations that there has been significant uplift near Krýsuvík.
Fig 5: Composite GPS plots for KRI, SENG and THOB.
We have also produced scatter plots by day for the swarm in week 8, 2021 which show possible rifting or dike formation.
The earthquake swarm which started in December 2019 is continuing, let’s have a quick update on the stats.
Statistics
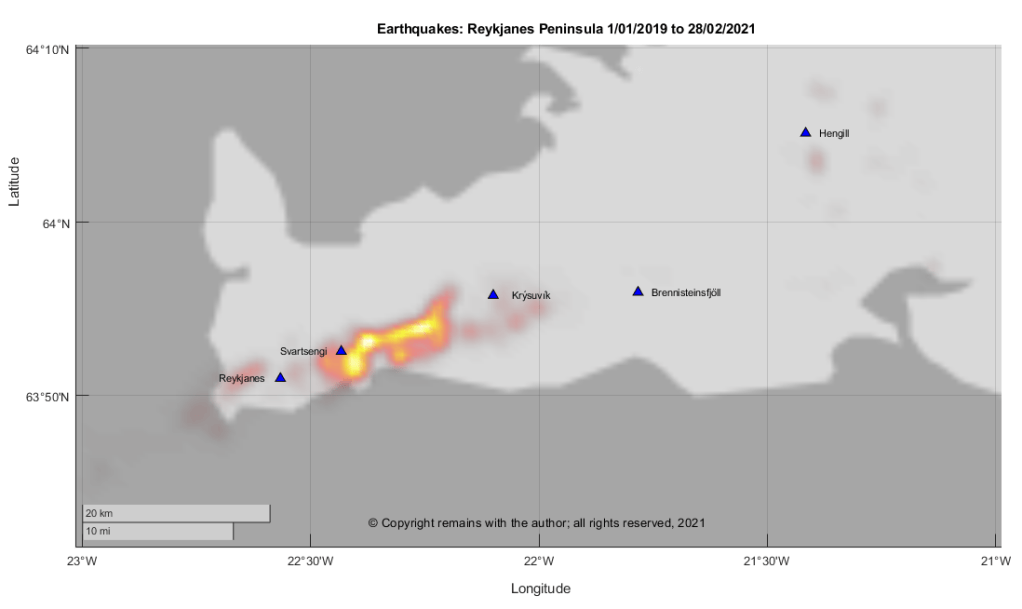
There have been 19,675 earthquakes in the Reykjanes Peninsula area 64.4°N, 23.0°W to 63.7°N, 21.0°W for the period 1 Jan 2016 to 14 June 2020, of which 14,258 (72%) have occurred in the last six months, most associated with the swarm near Svartsengi.
The geodensity plots for months 48 (December 2019) onwards (Figs 3.1 and 3.2) show that the most intense action started to the east of Mt Thorbjörn and has migrated west to Svartsengi and beyond.
IMO has confirmed that uplift has resumed in the vicinity of Mount Þorbjörn. Ground deformation is clearly visible on the GPS plots.
Fig 4:Uplift in the vicinity of Mt Þorbjörn as shown in recent GPS plots published by IMO: GPS Þorbjörn. THOB moved south eastwards, SENG moved north eastwards and ELDC moved westward; all showed uplift.
Summary
We are still looking at an unusually large swarm, accompanied by continued uplift in the vicinity of Mt Þorbjörn.
At the time of writing, there has been no change in the uncertainty phase declared by Icelandic Civil Protection .
The Armchair Volcanologist
15 June 2020
Sources:
Raw earthquake data and GPS plots downloaded from the Icelandic Met Office: https://en.vedur.is
There has been a large earthquake swarm on the Reykjanes Peninsula over recent months, still ongoing at the time of writing, albeit with reduced intensity.
The Reykjanes Peninsula lies at the south west tip of Iceland on the Mid Atlantic Ridge, the boundary between the North American and Eurasian Plates. The North American Plate is moving westwards in relation to the Eurasian Plate; transform and extension faulting accommodate the relative Plate motions. The Reykjanes Volcanic Belt lies on the Reykjanes Peninsula, comprising five north east trending volcanic systems: Reykjanes, Svartsengi, Krýsuvík, Brennisteinsfjöll and Hengill. The volcanic systems are fissure swarms.
Earthquakes
The line of earthquake epicentres in Fig 1 shows the path of the Mid Atlantic Ridge. These earthquakes were extracted from the data set used to generate the plots in the earlier post introducing Iceland. The raw earthquake data is publicly available data downloaded from the Icelandic Meteorological Office for the period January 2016 to 12 April 2020. The plot above is still data-heavy (too much data to see what is happening) so I have extracted the earthquakes by month to see where and when most activity occurred.
In the plots there is an impression of seismic activity trending along the Peninsula from the east to the west. This impression is born out most strongly in the activity from month 48 onwards. Although it should be noted that the level of activity for these months is unusually high.
There are several possible reasons for the east to west trending of the earthquake swarms:
the plates do not move smoothly past each other, so friction generates faults and earthquakes;
rifting is occurring to accommodate the upward motion of land further to the east, generated by the mantle plume in the vicinity of Vatnajökull; and /or,
magma intrusion in local volcanoes.
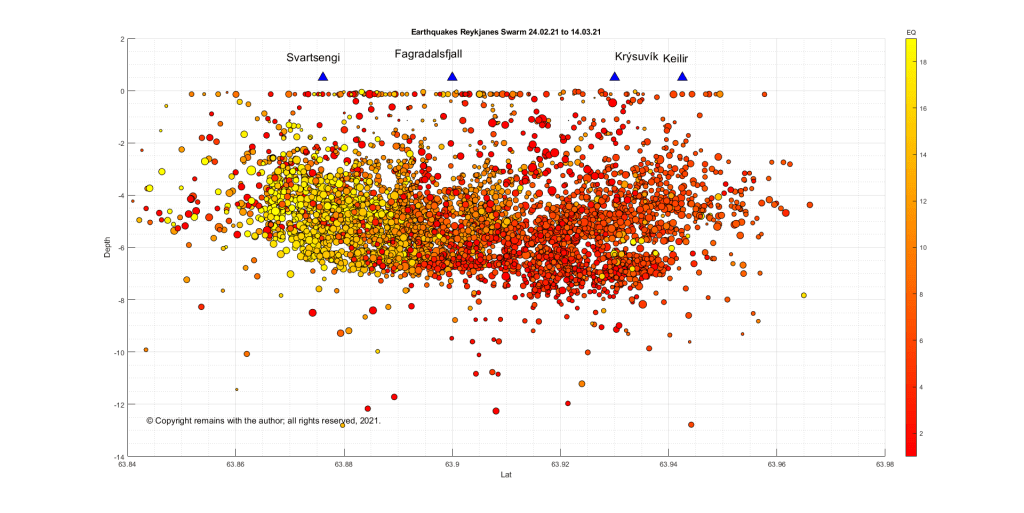
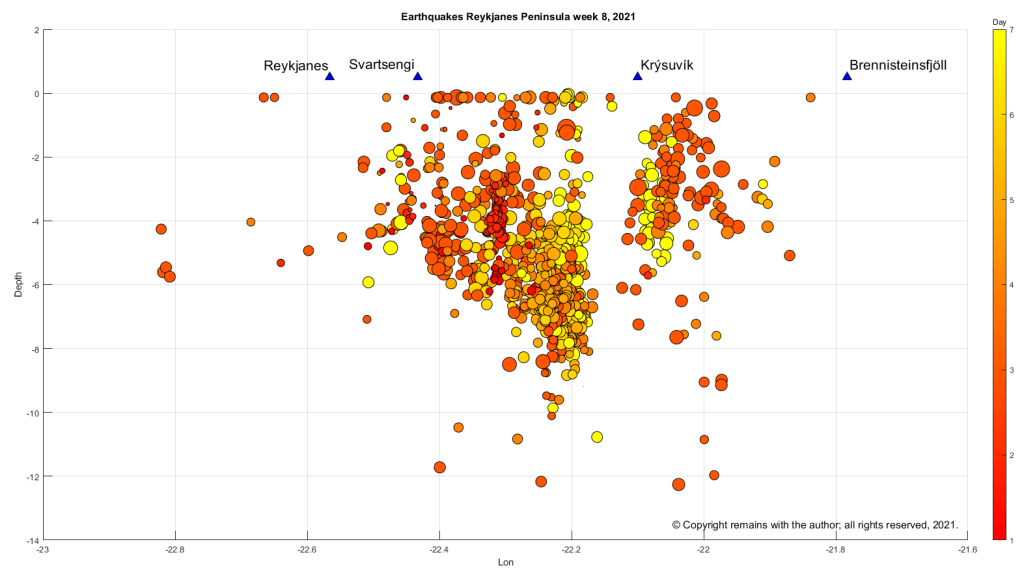
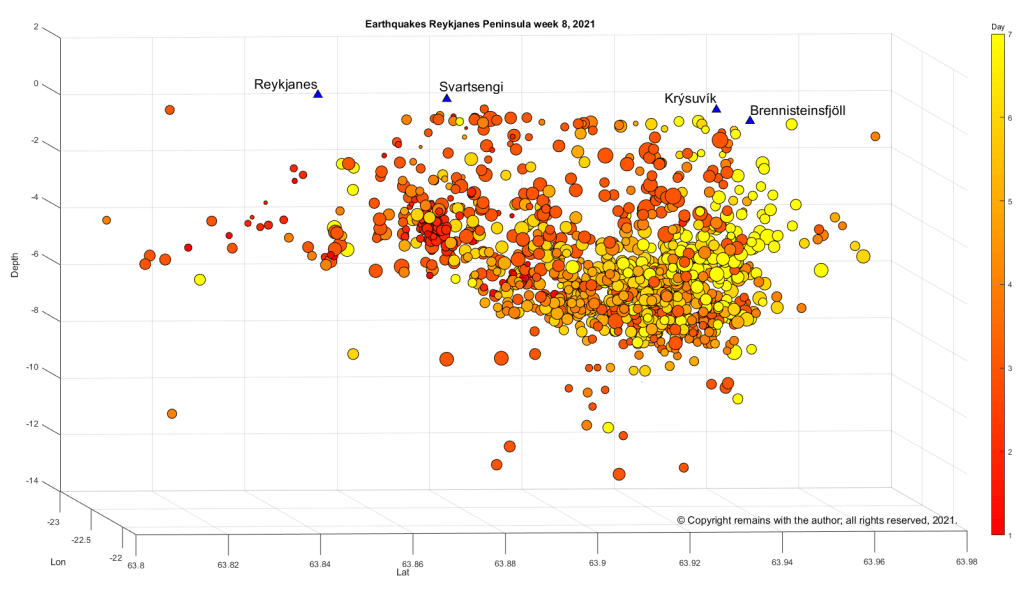
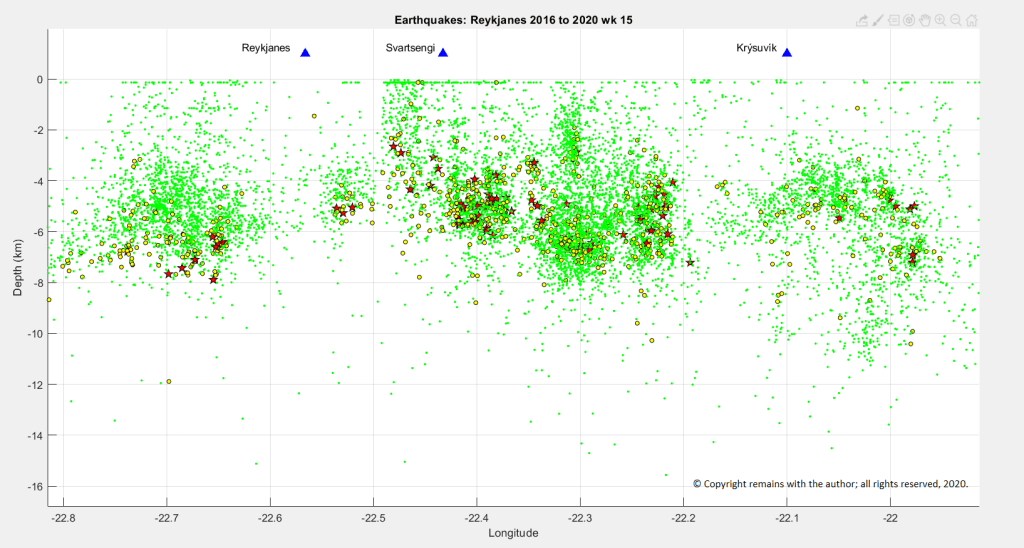
Let’s take a look at depth plots of earthquakes under the Reykjanes / Svartsengi area. This shows that the earthquakes over 3 M are largely in the lithosphere.
Plotting depth against longitude, effectively looking northwards through the swarms, also shows that most larger quakes are in the lithosphere but some over 2 M track towards the surface. On its own, this is not enough to draw any conclusions over the likelihood of an eruption; field observations, including gas emissions and ground deformation are required to determine how close to the surface magma may be.
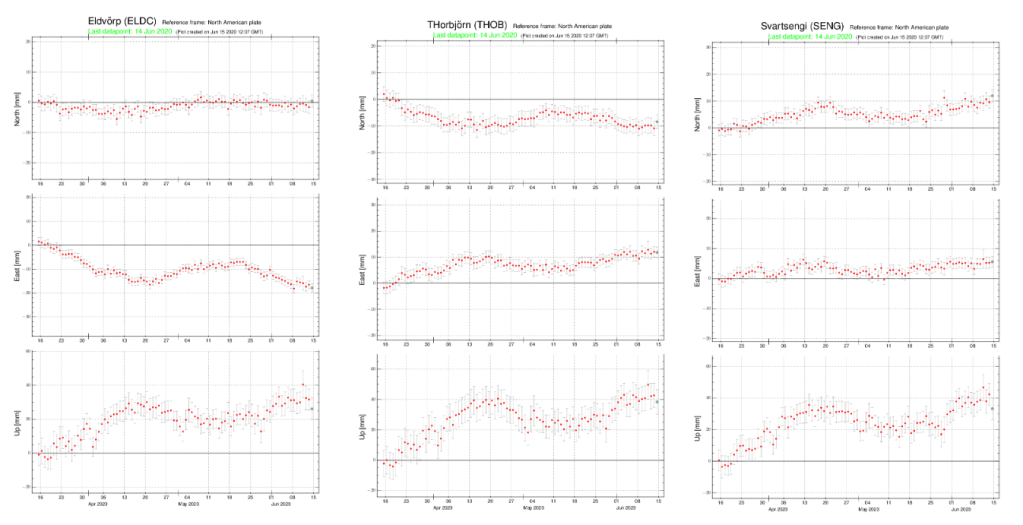
These swarms were accompanied by local uplift, as shown by local GPS stations.
Fig 9: Uplift in the vicinity of Mt Thorbjörn as shown in recent GPS plots published by IMO: https://en.vedur.is/. THOB moved south eastwards and ELDC moved westward; both showed uplift.
IMO(3) has reported that the most likely explanation for the recent swarms and uplift is a magma intrusion near Mt Thorbjörn at depth; Mt Thorbjorn is located near the Blue Lagoon, Svartsengi. As to whether or not magma will reach the surface for an eruption and where it emerges, we will have to wait and see. In the meantime, let’s look at the recent activity in historical times.
Historic Volcanic Activity
As noted earlier, the volcanic systems are fissure swarms. Activity is driven by rifting which enables magma to reach the surface. The most recent onshore volcanic activity took place between 940 AD and 1340 AD; later activity has been offshore. Onshore lavas from these eruptions tend to be tholeiitic basalts (1). The systems are still active as demonstrated by current geothermal activity.
Hengill
Fig 10: Image cropped from one by Hansueli Krapf, published under cc licence: CC BY-SA 3.0
The Hengill volcanic system is a series of fissure vents, crater rows and small shield volcanoes, with a highest point of 803m. It lies at the triple junction of the Reykjanes Peninsula volcanic zone, the Western volcanic zone and the South Iceland seismic zone. The lava types are basalt / picro-basalt, andesite / basaltic andesite and rhyolite. Hengill’s lavas are more complex that those to the west, reflecting its position at the triple junction. GVP(2) lists 13 Holocene eruptions ranging between VEI 0 and VEI 2; the last known eruption was a VEI 2 in 150 AD.
Brennisteinsfjöll
The Brennisteinsfjöll volcanic system is a series of crater rows and small shield volcanoes, with a highest point of 610m. Its lava types are basalt / picro-basalt. GVP(2) lists 9 Holocene eruptions ranging between VEI 0 and VEI 2. One eruption, previously attributed to Hengill, occurred during a meeting of the Icelandic parliament at Thingvellier in 1000 AD. The most recent eruption was a VEI 2 in 1341.
Krýsuvík
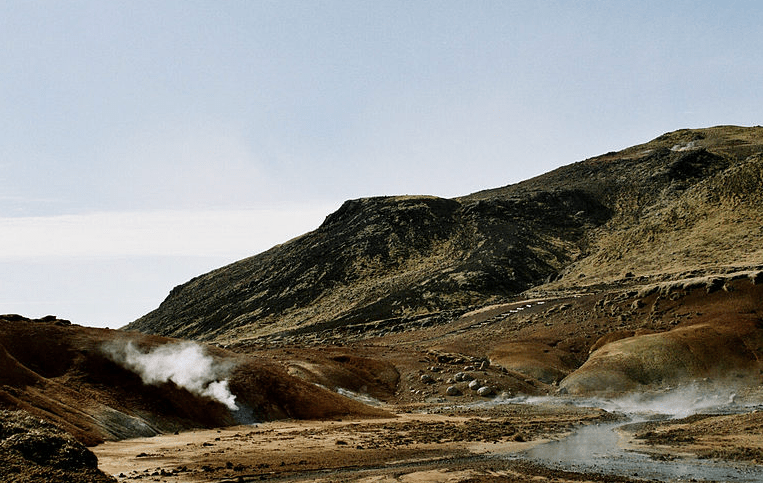
Fig 11: Image cropped from one by Reykholt, published under creative commons licence: CC BY-SA 3.0
The Krýsuvík volcanic system is a series of crater rows and small shield volcanoes, with a highest point of 360m. Like Brennisteinsfjöll, its lava types are basalt / picro-basalt. GVP(2) lists 11 Holocene eruptions ranging from VEI 0 to VEI 2; the most recent of which was in 1340. The Krýsuvík Fires spanned a period between 1151 and 1188, producing 36 km2 of lava.
Reykjanes & Svartsengi
Fig 12: Image of Svartsengi Power Station from one by Jóhann Heiðar Árnason, published under creative commons licence: CC BY-SA 3.0
The Reykjanes volcanic system is a series of crater rows and small shield volcanoes, which extends offshore and includes several small islands. Reykjanes highest point is 140m. The Reykjaneshryggur volcanic system is a submarine system which is considered part of Reykjanes. GVP includes Svartsengi as a crater row of Reykjanes. Reykjanes lava types are basalt / picro-basalt. GVP(2) lists 22 Holocene eruptions ranging between VEI 0 and VEI 4, of which the most recent was a VEI 0 in 1970; the VEI 4 was in 1226. The 1226 eruption was part of the Reykjanes Fires which started in 1210 and lasted until 1240.
The area is one that has had a period of intense volcanic activity, so the recent earthquake swarms have generated a lot of interest.
Regular updates on seismic and volcanic activity in Iceland are published by the Icelandic Meteorological Office(3).
The Armchair Volcanologist
14 May 2020
References & Further Reading:
David W Peate, Joel A. Baker, Sveinn P. Jakobsson, Tod E. Waight, Adam J. R. Kent, Nathalie V. Grassineau, Anna Cecile Skovgaard , 2009. “Historic Magmatism on the Reykjanes Peninsula”, Contrib Mineral Petrol (2009) 157:359-382
Smithsonian Institution Natural History Museum Global Volcanism Program (GVP): https://volcano.si.edu