An amateur volcanology enthusiast with an interest in volcanic and seismic activities, viewed from the comfort and safety of my armchair.
Meandered into this from using publicly available earthquake data to improve my Excel modelling skills. Then had to research the results both to understand and verify them. :)
3 March 2021 (Updated 07.03.2021 – new plots added).
The earthquake swarm which started on 24 February 2021 between Kleifarvatn and Svartsengi on the Reykjanes Peninsula is continuing.
Fig 1: Keilir. Image cropped from one taken by Michal Klajban, published under CC BY-SA 4.0. Keilir is the dark cone in the background; Spákonuvatn lake is in the foreground.
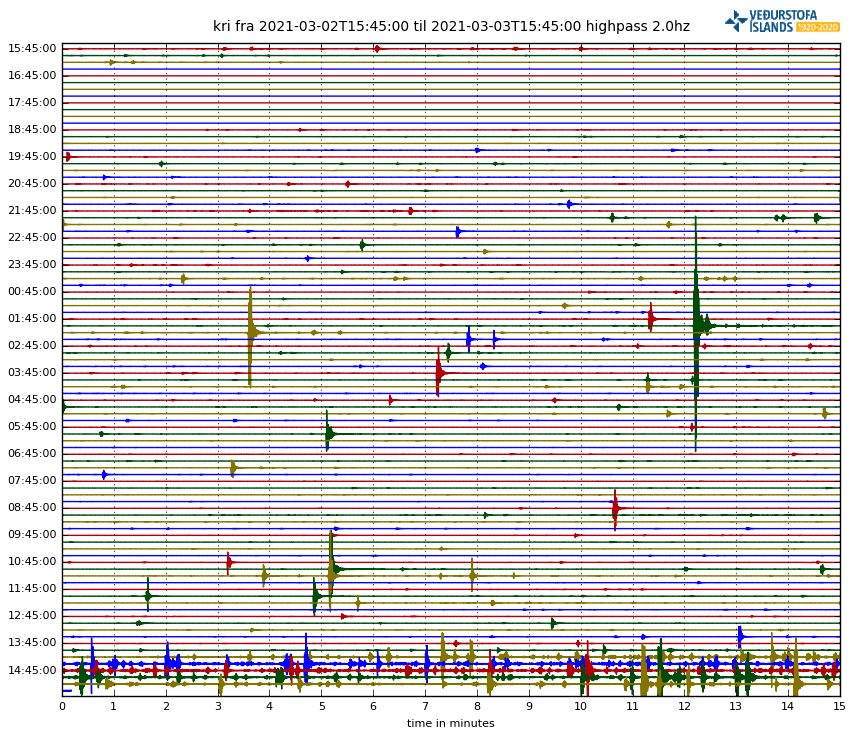
IMO have raised the aviation code for Krýsuvík to Orange and report a tremor pulse south of Keilir. At the time of writing, no eruption has been confirmed; however, visibility of the area is hampered by weather.
Fig 2: Drumplot showing the onset of the tremor pulse. Source: IMO.
If magma does reach the surface, the most likely scenario is a fissure eruption, which would produce effusive basaltic lava flows and toxic gases, rather than an explosive ashy eruption. If lava meets a significant amount of water, some tephra may be produced.
The likely impact from any eruption is expected to be disruption of air traffic and also road traffic access to and from Keflavík International Airport, if lava flows cross the access road.
Keilir, itself, is a subglacial mound near Krýsuvík formed during the Pleistocene during a fissure eruption. The mound is built of tephra formed when melting ice met magma, topped by lava. Fagradalsfjall, another location associated with the earthquake swarm, is a Pleistocene table-mountain. As lava prefers to take the easy route out, it is unlikely to emerge via these two volcanoes whose lavas would be fairly solid – hence the expectation of a new fissure swarm.
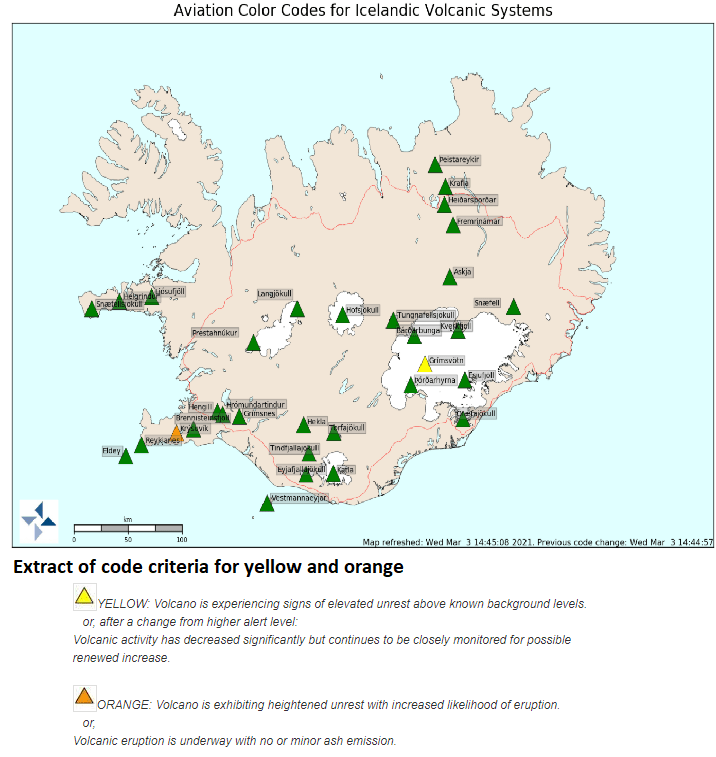
Fig 3: Current aviation codes for Iceland. Source: IMO.
For status updates, please consult IMO.
A local news service that is also providing updates in English is the Reykjavik Grapevine.
Life is not easy for the research scientists monitoring events. Two had to be rescued after having been separated from the main party while studying gas emissions. Spare a thought for the risks they take.
The public have been advised to stay clear of the area at least until it is known where and how lava emerges and where it would be safe to observe the eruption.
In our excitement at the thought of a possible eruption we overlooked the very real risk of larger earthquakes, if the intensity of the swarm continues: up to 6.0 M near Fagradalsfjall and up to 6.5 M in the Brennisteinfjöll range. Be careful if you are in the area.
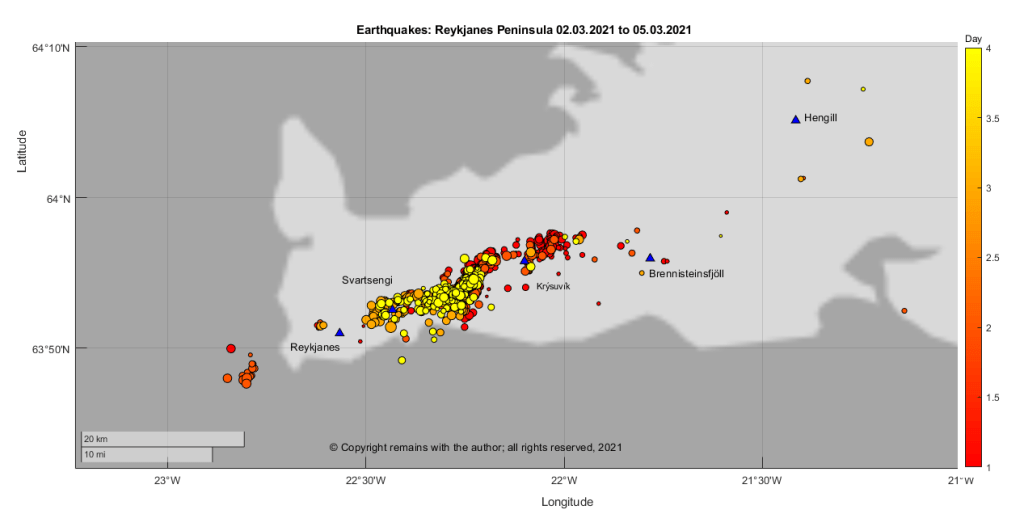
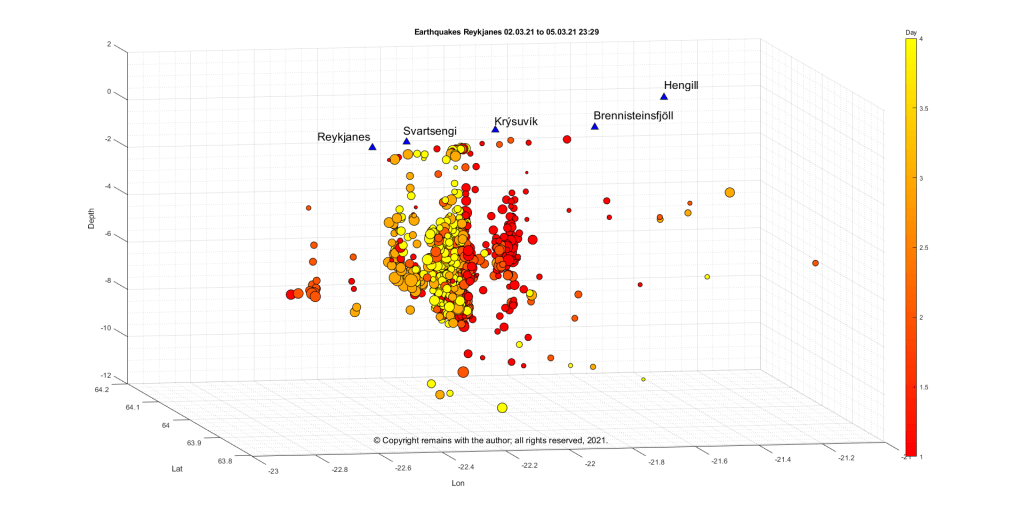
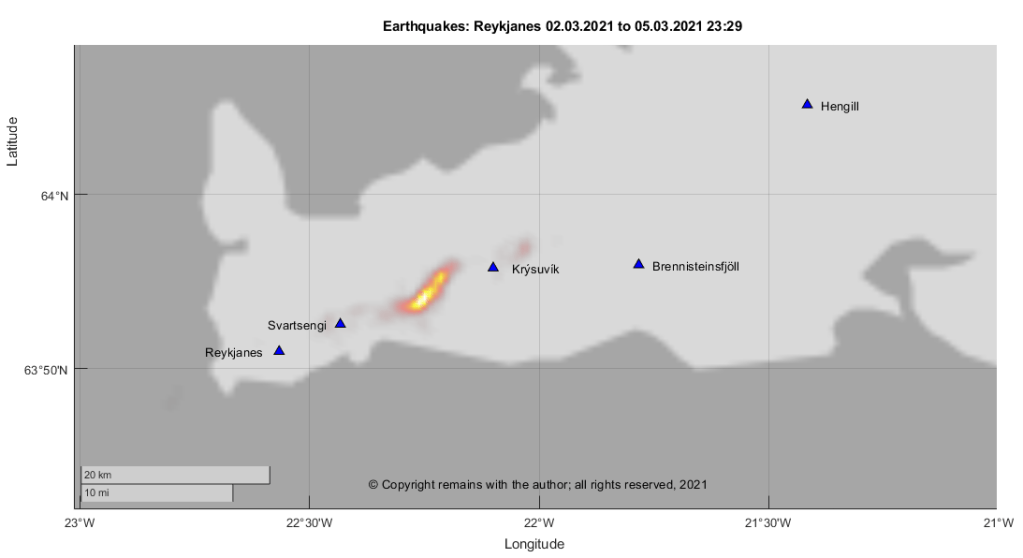
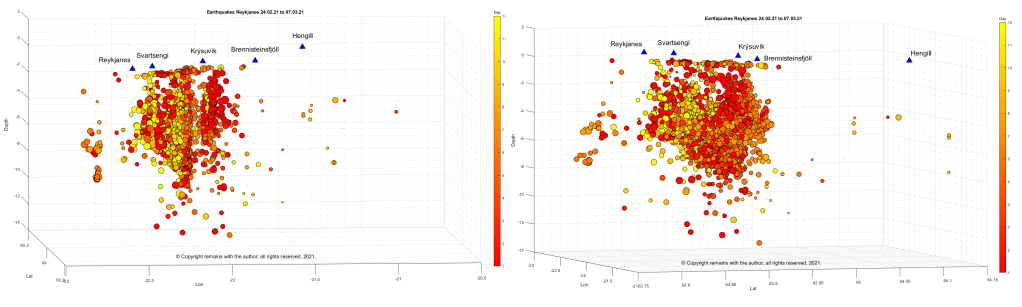
Update 05.03.2021 23:29
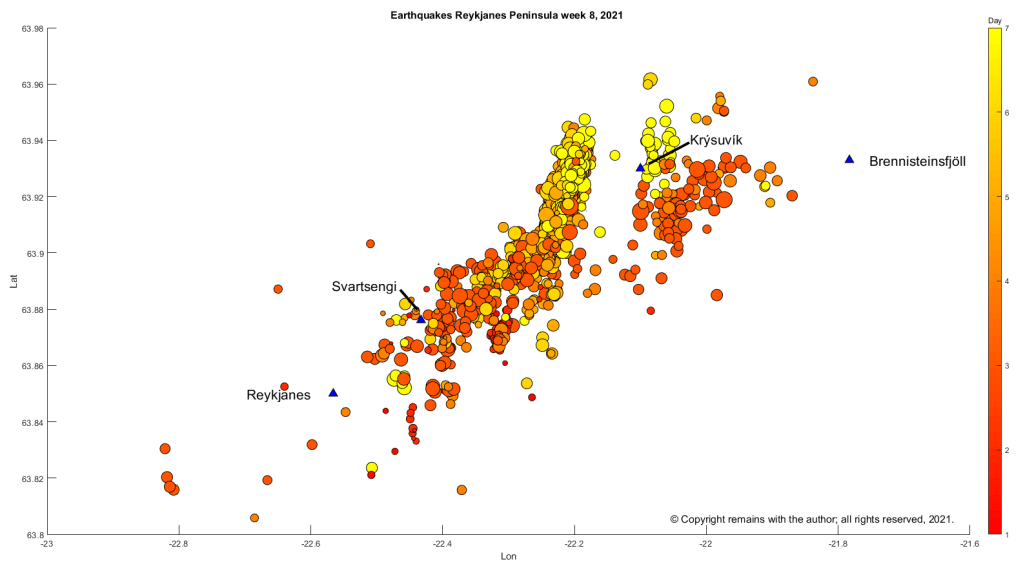
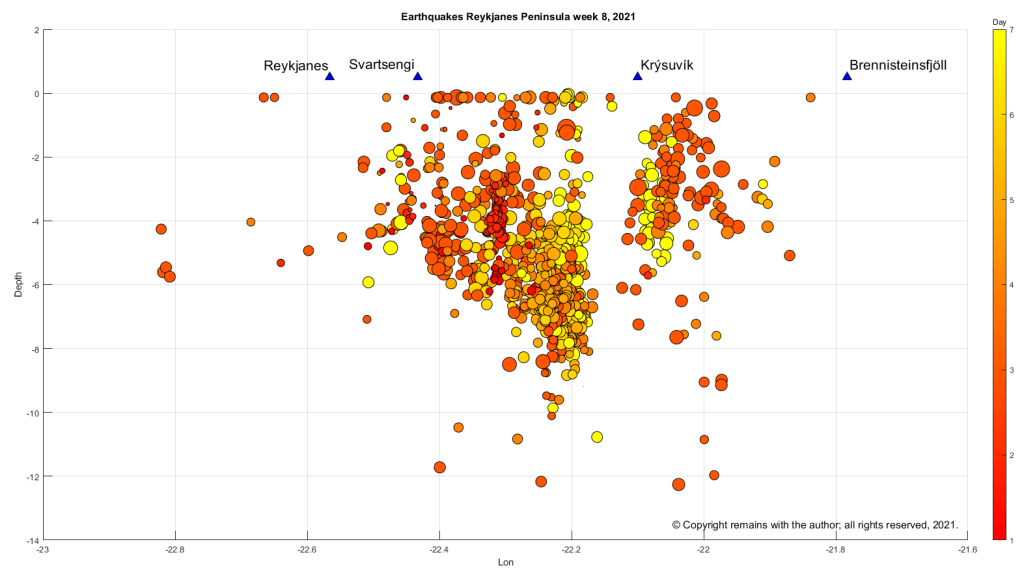
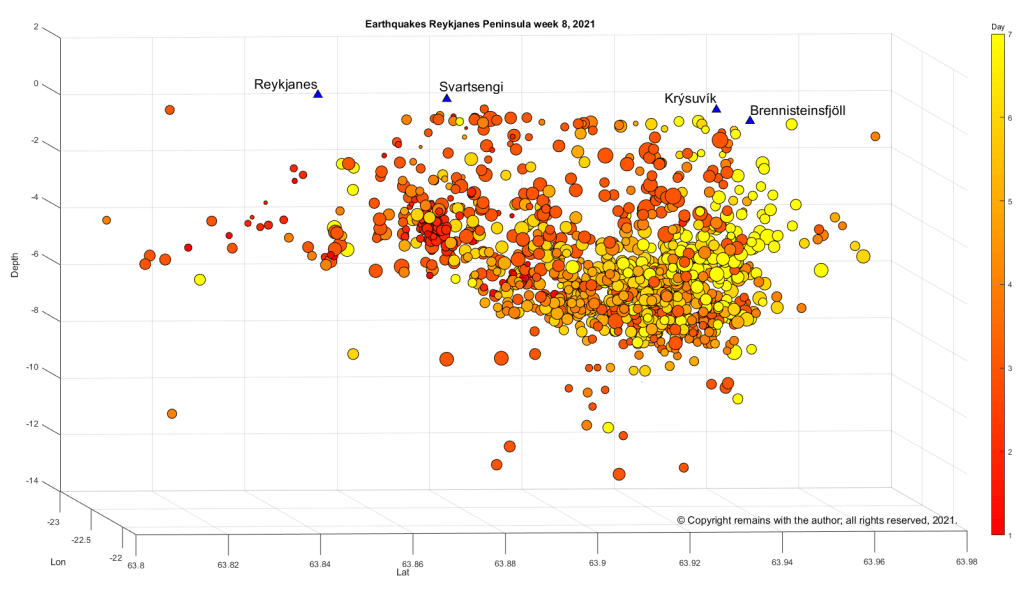
We have plotted the earthquakes with a quality of 99.0 from IMO’s page showing the earthquakes for the last 48 hours for the Reykjanes Peninsula for the period 2 March 2021 to 5 March 2021 (23:29) (we were too slow to capture 1 March 2021). Here are the results. Colour coding in the scatter plots is by day and size reflects magnitude. The geodensity plot is weighted by magnitude.
We’ve touched on plate tectonics in several articles so it would be useful to spend a brief moment summarise plate tectonics and to use earthquake data to show the plate boundaries.
Plate tectonics is the relative movement of the plates to each other. The Earth’s crust is made up of many rigid blocks called plates. There are 7 major plates: the North American Plate, the Eurasian Plate, the Pacific Plate, the South American Plate, the African Plate, the Indo-Australian Plate and the Antarctic Plate; many smaller plates, such as the Juan de Fuca Plate, the Cocos Plate, the Nazca Plate, the Caribbean Plate; and, several micro-plates in the collision zones between the larger plates.
History
The theory of plate tectonics has evolved from early mappers noting the similarities between the shapes of the continents to the current theories set out below. F B Taylor and Alfred Wegener developed theories (1910 and 1912, resp.) of continental drift, which was followed by the discovery of subduction zones from seismic studies by Wadati and Benioff in the 1920s and 1930s, Holmes theory (1928) that convection currents in the mantle caused by heat from radio-active decay stretched the oceanic crust caused the continents to split (the old oceanic crust cooled and sank back into the mantle to be melted and recycled), Hess’ theory (1950s) that the formation of ocean basins pushed continents apart and oceanic crust is formed at mid ocean ridges, confirmation in the 1960s of sea-floor spreading from post WWII studies of magnetic lineations on the sea floor, and the discovery of transform faults also in the 1960s.
The importance of magnetic lineations in the rocks of the sea bed is that when rocks are formed at the mid ocean ridges they are magnetised in the then direction of the earth’s magnetic field; the polarity of the earth’s magnetic field changes over a cycle and these changes are recorded in rocks, giving an indication of when the rocks were formed; the lineations are replicated each side of the spreading ridge.
Later GPS studies have confirmed the plate motions and led to the discovery of some microplates.
Composition of the Plates
The plates are made up of relatively rigid lithosphere with oceanic and / or continental crust.
Oceanic crust is around 7 km thick, principally made up of basalt, whereas continental crust is up to 30 km thick made up of granites and andesite. Oceanic crust is formed at sea-floor spreading centres (such as the Mid Atlantic Ridge). Continental crust is created by volcanic activity and the accretion of terranes (terranes are smaller segments of crust).
The lithosphere is the rocky upper mantle up to 100 km thick which rests on the weaker layer of the upper mantled called the asthenosphere. In the asthenosphere, heat rising from the Earth’s core, causes solid state convection; rock in the asthenosphere circulates round – heated rock rising and cooling rock sinking. The plates ride on the moving asthenosphere. As the plates move, they generate earthquakes.
There are three distinct types of plate boundary which are clearly delineated by seismic activity at the plate margins:
Divergent margins where plates move apart from each other. Asthenosphere rises to fill the gap, cooling to form new lithosphere. Ocean basins and ridges are formed in this process. Decompression melting of the mantle leads to the formation of magma and volcanoes. An example of a divergent margin is the Mid Atlantic Ridge.
Convergent margins where the plates move towards each other and one plate descends beneath the other or overrides the other. In ocean-to-continent or ocean-to-ocean collision, denser the oceanic crust subducts beneath the lighter continental or oceanic crust. The descending slab causes the formation of a trench and accretionary wedge (sediment scraped off adheres to the overriding plate). As the temperature and pressure increases on the descending plate, water is released which causes hydration melting of the mantle and surface volcanism. In continent-to-continent collision, there is no marked subduction: the plate edges are compressed, folded and uplifted. An example of ocean-to-continent collision is the plate boundary between the Pacific Plate and the North American Plate at the Aleutian Arc.
Transform margins where the plates slide past each other with no vertical motion. An example of this is the San Andreas Fault which marks the western boundary of the North American Plate.
There are other boundaries that are less well defined.
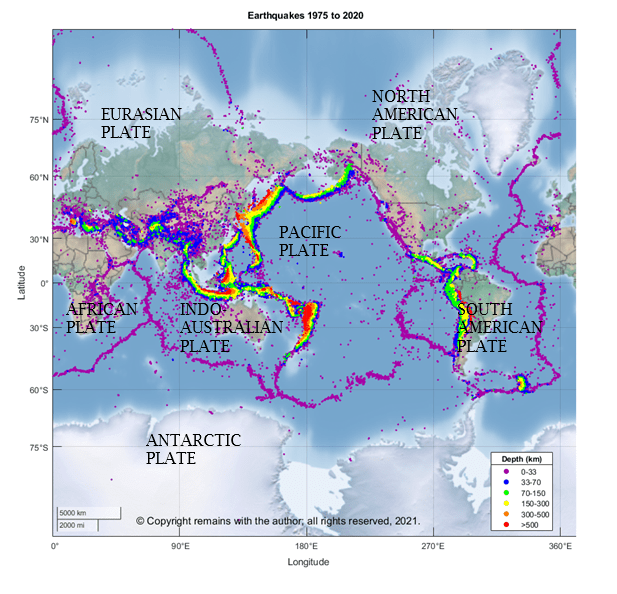
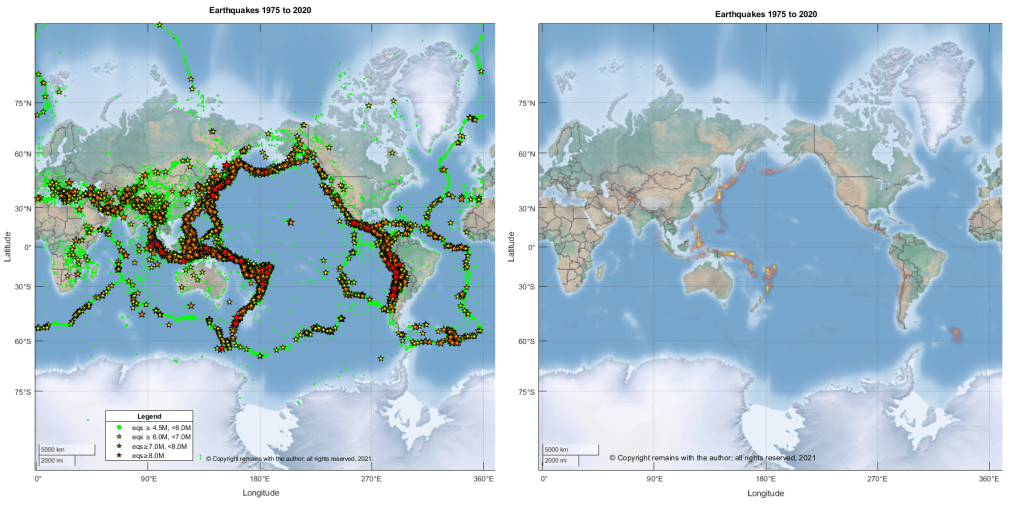
If we plot the earthquakes, we can see the plate boundaries. We plotted earthquakes downloaded from USGS’s earthquake search with magnitude ≥ 4.5M for the period 1975 to 2020 for coordinates 90°S, 180°W to 90°N, 180°E.
From out plots, most of the plate boundaries are clearly visible (some of the microplate boundaries are hidden due to the scale of the plots): the mid-ocean ridges, ocean-to-continent collision zones marked by deep subduction zones and the shallower continent-to-continent collision zones. We can also see that the subduction zones bordering the Pacific Ocean and subduction zones of Indonesia are responsible for most of the earthquakes with magnitude of 8.0M or more.
The drivers for plate motion are the convection currents in the asthenosphere drag the lithosphere (basal drag) and the pull of the cooler lithosphere sinking into the asthenosphere at subduction zones (slab suction, gravity or slab pull). Slab pull is considered to be the largest driver of plate motions. However, as you will see from the plots below, neither the North American Plate nor the Eurasian Plates have active subductions zones so another mechanism is needed. Super plumes of deeper mantle material may drive larger convection currents. Surge tectonics developed later suggests that the mantle flows in channels beneath the lithosphere which provide basal friction.
Reykjanes Peninsula – update
The Reykjanes Peninsula straddles the Mid-Atlantic Ridge. Here, the plate boundary consists is a transform margin, made up of a transform fault and localised rifting.At the time of writing, a large earthquake swarm is occurring.We have now added plots of the current rifting / dike formation event to our previous post (“Seismic Activity on the Reykjanes Peninsula“) for earthquake data downloaded on 1 March 2021. IMO is in the process of updating week, 2021 .
28 February 2021 (updated 2 March 2021 with the addition of earthquake plots showing rifting / dike formation)
Good Evening!
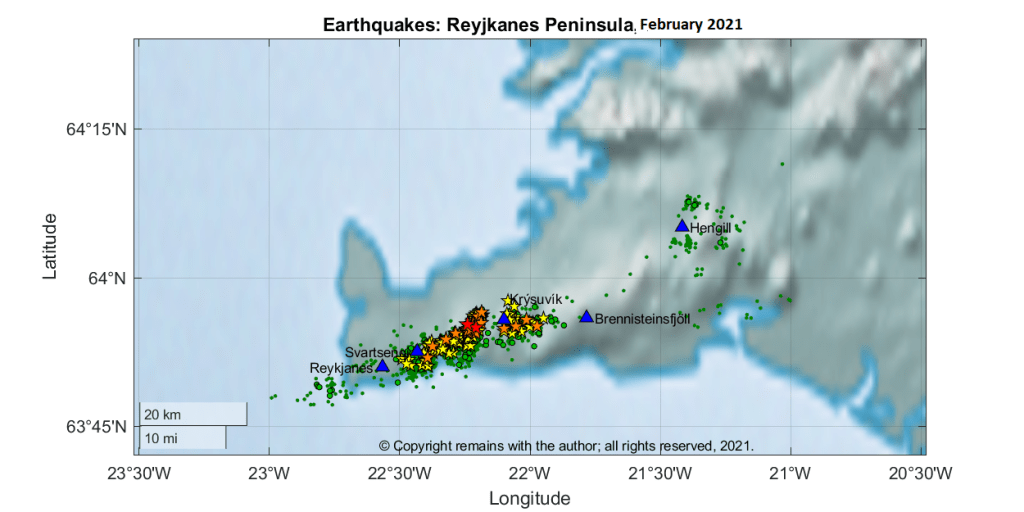
A large earthquake swarm started on 24 February 2021 on the Reykjanes Peninsula in the vicinity of the Krýsuvík volcanic system between Kleifarvatn and Svartsengi. At the time of writing the swarm is still ongoing with over 7,200 earthquakes record by Iceland’s SIL system. Three earthquakes of 5.0M or more have been recorded: 5.7M and 5.0M on 24 February and a 5.2 on 27 February 2021.
The alert level for the Krýsuvík volcanic system has been raised to yellow following sightings of steam jets in geothermal areas in the region after the 5.7M and 5.0M.
The Icelandic Met Office have attributed this swarm to the recent re-awakening of volcano-tectonic activity on the Peninsula.
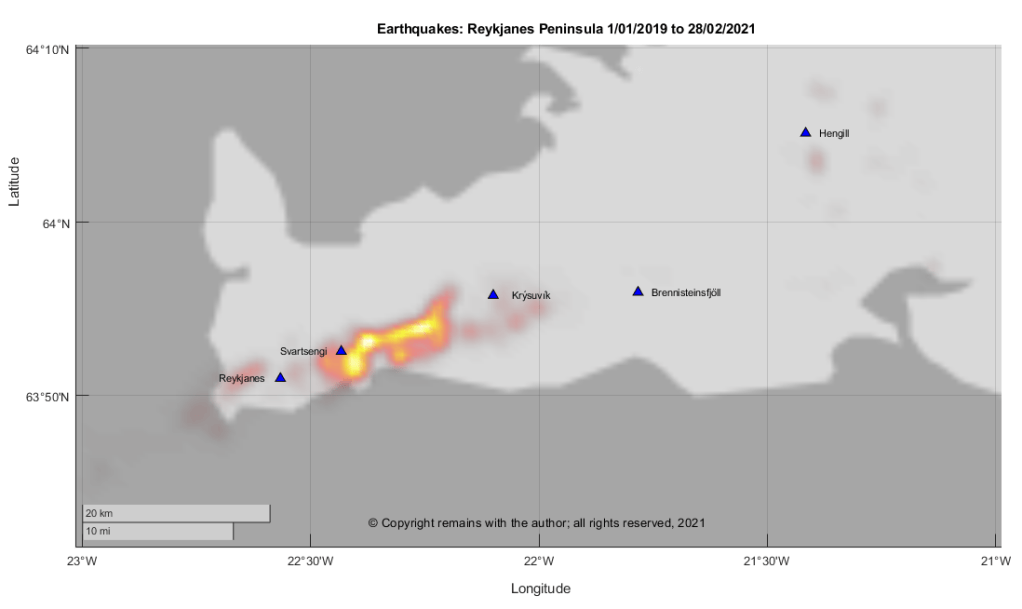
We downloaded the confirmed earthquakes from IMO’s site to take a look. We plotted earthquake density for Week 8, 2021, earthquake locations for February 2021 and earthquakes by month from January 2009 to February 2021.
From our plots we can see the awakening of the volcano-tectonic activity with the upkick in number of earthquakes from December 2019. The current swarm is part of this activity.
At the time of writing, it is not possible to predict whether or not this activity will result in a local eruption in the near future. Only time will tell.
Update 1 & 2 /03/2021
Since writing the swarm has continued, with more than 15,000 earthquakes since it began last week.
The Department for Civil Protection has advised on 1 March 2021, that satellite images show deformation in the area has increased more than expected, indicating possible magma inflow.
We can see from the local GPS stations that there has been significant uplift near Krýsuvík.
Fig 5: Composite GPS plots for KRI, SENG and THOB.
We have also produced scatter plots by day for the swarm in week 8, 2021 which show possible rifting or dike formation.
On 4 December 2020 the alert level for Mt. Pelée was raised to yellow due to increasing seismicity above background levels; and, on 29 December 2020 the alert level for La Soufrière St. Vincent was raised to orange following an increase in seismic activity, changes seen in the lake and fumaroles and a new growing lava dome emerging in the summit crater.
This led us to look into what drives volcanism in the area, notably the interaction of the Caribbean Plate with its surrounding plates.
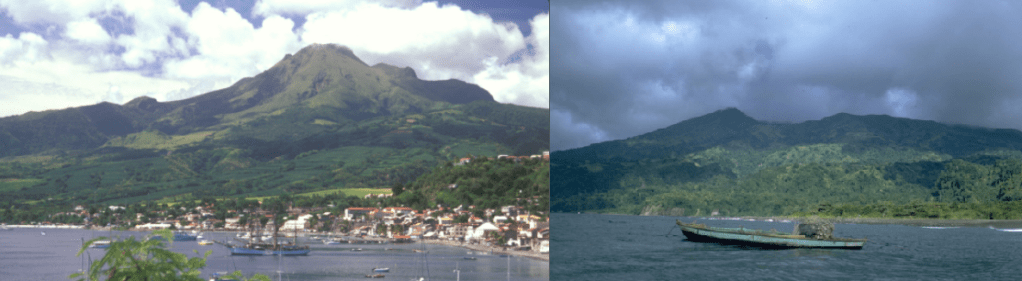
Fig 1: Mt. Pelée on the left with St. Pierre, photo by Lee Siebert, 2002 (Smithsonian Institution); Soufrière St. Vincent on the right, photo by William Melson, 1972 (Smithsonian Institution).
Mt. Pelée is famous for destroying the town of Saint- Pierre and its inhabitants plus visitors – a total of 29,000 people – in a matter of minutes on the morning of 8 May 1902 in a pyroclastic flow during a VEI 4 eruption. La Soufrière St. Vincent also erupted around the same time. Both volcanoes are located in the Lesser Antilles on the Caribbean Plate.
Mt. Pelée
Mt. Pelée is located on Martinique. She is a 1,400m high stratovolcano located in the caldera of an earlier volcano; edifice failures have breached the south west section of the caldera. Her lava types are andesite, basaltic andesite, dacite and basalt, picro basalt.
54 Holocene eruptions are recorded by GVP. Her historic eruptions include 1792 (VEI 1), 1851 (VEI 2), 1902 (VEI 4) and 1929 (VEI 3). Two lava domes were emplaced in the summit crater, l’Etang Sec, during the 1902 and 1929 eruptions.
1902 Eruption
Prior to the 1902 eruption, Mt Pelée’s known eruptions had been mild. Activity at the volcano started to ramp up gradually with fumaroles in the summit crater in 1889 to March 1902. From 23 April 1902 phreatic activity cleared out old rock, starting with minor explosive activity. By 4 May 1902 ash was raining down on Saint- Pierre. On 5 May, 23 people were killed when near boiling water from the crater heated by rising magma overran a distillery in a lahar in the Rivière Blanche valley.
On 6 May 1902, new lava emerged creating a lava dome. During 7 May 1902, small parts of the dome collapsed. At 07:50 on 8 May 1902, explosions were heard and a large black cloud seen to emerge and flow down the volcano, engulfing Saint-Pierre and some of the ships in the harbour. Most of the casualties were killed by hot gases and dust from the blast. Several pyroclastic flows followed: on 20 May 1902 a second pyroclastic current swept over Saint-Pierre destroying several of the remaining buildings; the Rivière Blanche valley saw several PDCs over the ensuing months; and, Morne Rouge was destroyed and 2,000 people killed by a pyroclastic current on 30 August 1902. During this activity a 300m lava spine emerged. After this eruptive activity continued until 1903. The lava spine has since been eroded.
Saint-Pierre had not been evacuated prior to 8 May 1902 for a couple of reasons: it was not known at the time that the volcano produced pyroclastic flows so the danger was not understood; and, an election was due on 11 May 1902, which politicians were keen should go ahead. No evacuation order was given.
When activity ramped up again prior to the 1929 eruption, people were evacuated in time.
La Soufrière St. Vincent
La Soufière St. Vincent can be found on St Vincent Island. She is a 1,234m high stratovolcano with crater lake and lava domes. The 1.6km wide summit crater is located on the south west edge of a 2.2km wide Somma crater; slope failure caused a breach in the Somma crater. Her lava types are andesite, basaltic andesite and basalt, picro basalt.
22 Holocene eruptions are recorded by GVP. Her historic eruptions include 1718 (VEI 3), 1812 (VEI 4), 1902 (VEI 4), 1971 (VEI 0) and 1979 (VEI 3). The 1902 eruption occurred on 6 May 1902, killing 1,680 people. The 1812 eruption produced a new crater, cutting through the summit crater. 1971 eruption extruded a lava dome in the summit crater, which erupted explosively in 1979 to be replaced by another dome.
Tectonic Setting
As noted above, both Mt. Pelée and La Soufrière St. Vincent are located on the Caribbean Plate in the Lesser Antilles. The Caribbean Plate is thick oceanic crust located between the North American and South American Plates. The northern boundary of the Caribbean Plate is a transform boundary with the North American plate, running from Central America to the Virgin Islands. The Gonâve microplate and Puerto Rico Trench form part of the northern boundary. At the eastern boundary, the South American Plate subducts under the Caribbean Plate in the Lesser Antilles. At the western boundary, the Cocos Plate subducts under the Caribbean Plate, forming the Central American Volcanic Arc. The southern boundary with the South American plate is a complex, comprising a convergent margin with the Panama Plate, a subduction zone with the North Andes Plate and a transform boundary with the South American Plate. The main plates velocities relative to the African Plate are noted below.
Plate
Direction
Velocity
North American Plate
West
25 mm per year
Cocos Plate
North east
67 mm per year
Caribbean Plate
North west
10 mm per year
Panama Plate
North west
19 mm per year
Coiba and Malpelo Plates
East
North Andes Plate
North west
23 mm per year
Nazca Plate
North east
40 -53 mm per year
South American Plate
West
27 – 34 mm per year
The origins of the Caribbean Plate are debated. There are two main theories which attempt to explain why the less dense but thicker crust of the plate overrides the Cocos and South American Plates. It may have evolved millions of years ago from the Caribbean large igneous province, formed at the Galapagos hotspot, drifting to its current location as the plates moved to accommodate the widening of the Atlantic Ocean. Alternatively, it may have formed from an old hotspot in the Atlantic. These theories are based on the relative motions of the plates. The first theory works on the basis that the Caribbean Plate is moving eastward compared to the North and South American Plates, whereas the latter uses the actual westward motion of the Caribbean Plate.
Recent Seismicity
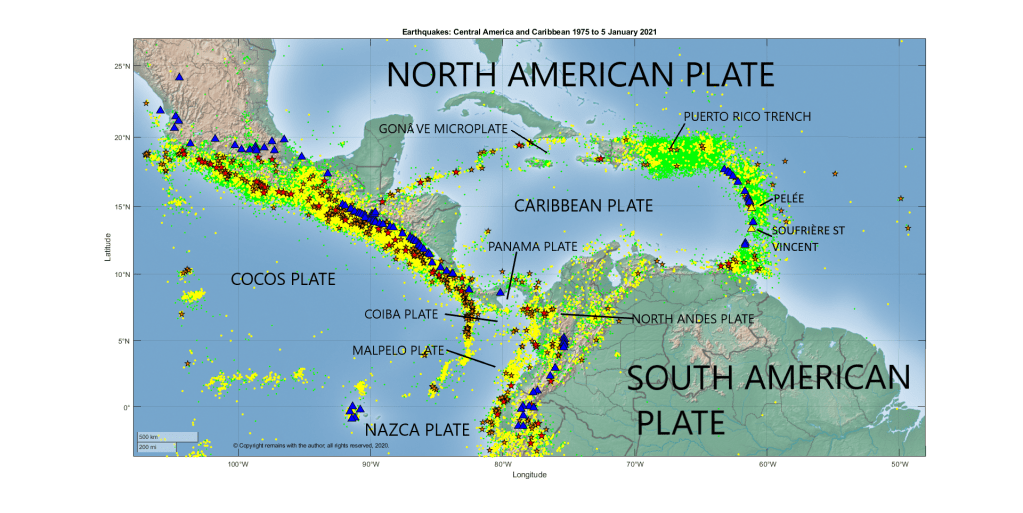
Yes, we’ve downloaded earthquakes for the region from USGS’s earthquake search, taking a larger area than the Caribbean Plate in order to pick up the subduction zones. In this case, it was not really necessary as most subduction is beneath the Caribbean Plate, but it was fun to find several microplates in the process: the Gonâve, Panama, Coiba and Malpelo Plates. The Malpelo Plate was first identified as late as 2017 by Tuo Zhang, Richard G Gordon et al of Rice University.
The coordinates selected were: 3.760°S, 107.051°W to 26.838°N, 48.867°W for earthquakes with magnitudes of 2.5 or more between 1 January 1975 and 5 January 2021. This picked up 80,751 earthquakes.
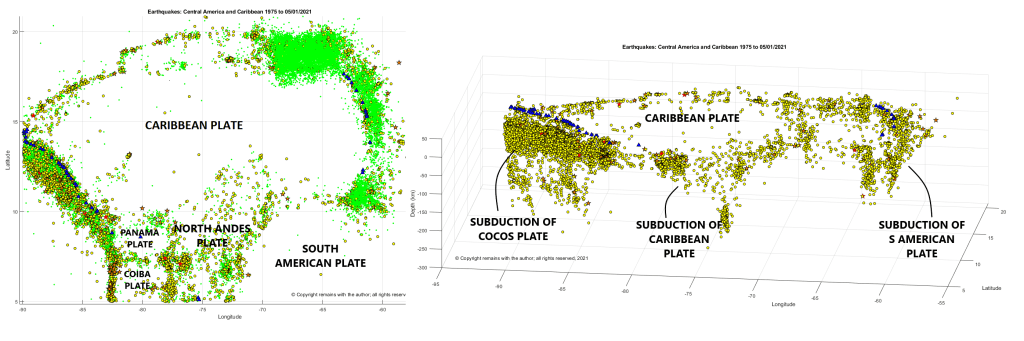
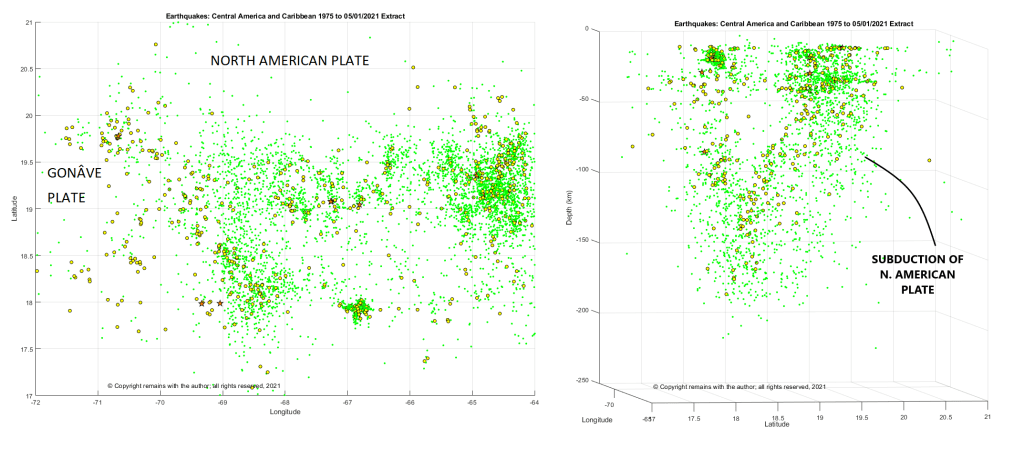
From Figs 2, 3 and 4 below, we can see the plate boundaries and the subduction zones on the western and eastern margins of the Caribbean plate are well marked by earthquakes and volcanoes; the subduction of the Caribbean Plate under the North Andes Plate is also visible (lower centre of the depth plot); and, the Puerto Rico Trench is also tectonically very active. The Puerto Rico Trench has produced some large earthquakes and tsunamis.
Fig 4 shows subduction of the North American Plate on the right of the depth plot. But there is also a line of earthquakes on the left of the plot which appears to indicate another subduction zone. Neither subduction zone here, despite being seismically active, has active volcanoes associated with it. It’s possible that there is another microplate here, but this is conjecture on our part until we can find an explanation or confirmation.
If you are interested or concerned by the alert statuses of Mt Pelée and La Soufrière St Vincent, you can find more information at L’Observatoire Volcanologique et Seismologique de Martinique, the National Emergency Management Organisation (NEMO) or GVP.
Hope you enjoyed our little tour. We will be looking in more detail at points of interest in the future.
Zhang, Tuo; Richard G. Gordon; Jay K. Mishra, and Chengzu Wang. 2017. The Malpelo Plate Hypothesis and implications for nonclosure of the Cocos-Nazca-Pacific plate motion circuit, 1. AGU Fall Meeting, New Orleans. Accessed 2018-06-06.
“Volcanoes”, Peter Francis and Clive Oppenheimer, Oxford University Press, Second Edition, 2004.
Today we are looking at plate tectonics, giving a brief introduction to the Aleutian Arc, which marks the boundary between the North American Plate and the Pacific Plate. The Arc is both seismically and volcanically active. Volcanic activity is of interest because the Arc lies under very busy North American and Asian aviation routes .
Fig 1: The Aleutian Arc. Map base from Google Maps. Names of some geological features added by the author.
The Pacific Plate is moving north westward at a rate of 59mm per year in the north east and 92mm per year in the north west. It subducts orthogonally under the North American Plate on its north-eastern margin, obliquely further westward, and parallel to the North American plate at the transform boundary on its north-western margin. The subduction zone comprises the island arc, the Aleutian Trench, and distinct Wadati-Beniof zones, which extend down to around to between 100 km and 250 km.
The Aleutian Arc is 3,000 km long from the junction with the Fairweather Fault (an extension of the Queen Charlotte Fault) in the east to the triple junction of the Ulakahan Fault, Aleutian Trench and Kuril-Kamchatka Trench in the west. The arc includes a 2,500 km long chain of basaltic andesitic stratovolcanoes and calderas. Behind the arc are basaltic lava fields in the Bering Sea. Most volcanoes are in uninhabited or sparsely populated areas so they pose more of a risk to aviation.
Origins of the Aleutian Arc
In the early Cenozoic, 60 million years ago, the Farallon Plate and Kula Plates covered what is now the northern Pacific Ocean; the Kula Plate moved northwards, while the Farallon Plate moved eastwards. There were active continental margins: in the north west there was in island arc; and, in the north east there was subduction of oceanic crust beneath the Bering Shelf volcanic belt. The Kula-Pacific Transform Fracture Zone may have separated the north west Pacific from the north east.
In the middle of the Eocene (50 million years ago to 47 million years ago) the movement of the Pacific Ocean plates changed from the NNW subduction of the Kula Plate, followed by ridge subduction, to the NW subduction of the Pacific Plate. This change in motion resulted in the formation of the Aleutian Arc and its back-arc basin in the Bering Sea. The Shirshov Ridge and Bowers Ridge originated from the ongoing displacement of the North American Plate in relation to the Eurasian Plate in the mid Eocene. Subduction beneath the Kamchatka margin is associated with the late Cenozoic. The Komandorsky Basin formed in the Miocene.
The oblique subduction of the Pacific Plate towards the centre of the Aleutian Arc has caused clock-wise rotation of island arc blocks and breaches in the island chain, notably at the Near, Buldir, Amchitka and Amukta Straits. This motion moved the Komandorsky block from its location at the subduction zone near the junction with the Bowers Ridge to its current location at the transform boundary; Eocene volcanicsnin the block ceased after its movement away from the subduction zone. Recent tomographic studies have shown a possible slab under the Bering Sea that may be a remnant of the Kula Plate.
Recent Seismicity
The current Aleutian Arc is seismically very active; it has produced several large earthquakes with magnitudes in excess of 7.0M.
We looked at the earthquakes between 1 January 1975 to 30 November 2020 with a magnitude greater than 4.5M from 47.04°N, 142.559°W to 66.548°N, 198.984°W downloaded from USGS Earthquake search (see Sources below). This includes the triple junction at the west of the Arc and the junction with the Fairweather Fault in the east, and the Bering Sea. It also picks up some of the subduction zone to the west at the northern end of the Kuril-Kamchatka Trench. We also identified seismic swarms in the period; for this purpose, swarms are defined here as more than 30 earthquakes per day (normally there are less than 10 per day).
Figs 2a and 2b show that most of the action is at the southern section of the Arc where the subduction of the Pacific Plate changes from orthogonal to oblique. The geoscatter plot shows that most of the swarms are occurring here, confirmed by the geodensity plot. There is very little seismic activity behind the arc, except for a swarm in Kamchatka north of the arc.
Earthquakes with magnitudes greater than 7.0M occur round the arc, with the exception of the region near the Fox Islands; the lack of earthquakes here greater than 7.0M may be due to the nature of the crust, or, the comparatively short time period selected (45 years is a short time in geological terms).
If we look closer at sections of the arc (see figs 3a to 3e below), we can see that that earthquakes tend to follow a block pattern with gaps in between; the gaps may be gaps between crustal blocks or they may be areas likely to have swarms in the future. We can also see the well-defined Wadati-Benioff Zones which extend to a depth of 250 km in the Eastern and Central Blocks (blocks here are the sections of the arc that we have selected to plot and are not intended to represent crustal blocks).
The lack of an active Wadati-Beniof Zone under the western segment of the Aleutian Arc explains why there is little current volcanism there. Active volcanism in Kamchatka is south of the Aleutian arc, driven by the subduction of the Pacific Plate under the Okhotsk Plate. There is some seismicity in Kamchatka, north of the Aleutian Arc; this does not appear to be connected to an active subduction zone, although looking at Google Maps there may be an old trench in the area.
Clearly, the western and eastern segments of the Aleutian Arc are complex junctions and deserve a closer look. We will examine this in more detail when we discuss volcanic activity.
“Volcanoes of the World”, Third Edition, Lee Siebert, Tom Simkin, and Paul Kimberly, Smithsonian Institution, 2010, University of California Press
“Cenozoic Geodynamics of the Bering Sea Region”, V. D. Chekhovich, A. N. Sukhov, O. G. Sheremet, and, M. V. Kononov, Geotectonics, 2012, Vol. 46, No. 3, pp 212-231.
“Bowers Ridge (Bering Sea): An Oligocene – Early Miocene Island Arc”, Maren Wanke, Maxim Portnyagin, Kaj Hoernle, Reinhard Werner, Folkmar Hanff, Paul van den Bogaard, and Dieter Garbe-Schönber, Geology (2012) 40 (8): 687–690.
Sadly, a 7.0 magnitude shallow earthquake occurred to the north of the Greek island of Samos on 30 October 2020. This caused a number of fatalities, injuries and property damage in both Greece and Turkey.
This prompted us to take a look at the tectonics in the region.
Activity here is driven by the collision of the north eastern moving African Plate with the Eurasian Plate. Of the microplates which have broken off the Eurasian Plate during the collision, we are interested in the Aegean Sea Plate and the Anatolian Plate.
Anatolian Plate
The African Plate subducts under the south and south west margins of the Anatolian Plate at the Hellenic and Cyprus arcs; there is a transform boundary with the Eurasian Plate on the northern edge at the North Anatolian Fault Zone (NAFZ); the western edge is a divergent boundary with the Aegean Plate; and, the eastern edge is the East Anatolian Fault which marks the transform boundary with the Arabian Plate. The plate is rotating anti-clockwise, pushed westward at a speed of 21 mm per year relative to the African Plate by the northward motion of the Arabian Plate.
The East Anatolian Fault extends from the Maras Triple Junction at the northern end of the Dead Sea Transform to the Karliova Triple Junction and North Anatolian Fault.
The North Anatolian Fault extends from the junction with the East Anatolian Fault at the Karliova Triple Junction to the Aegean Sea. This fault has produced several earthquakes of magnitudes in excess of 7.0 M, which since 1939 have been occurring along the fault in a westward pattern, until 1999. There is concern that westward trend may be resumed to continue onwards to Istanbul, itself.
Aegean Sea Plate
The African Plate subducts beneath the southern edge of Aegean Plate at the Hellenic Trench. The northern edges of the Plate are divergent boundaries with the Eurasian Plate and the Anatolian Plate. The plate is moving south westward at a speed of 37mm per year relative to the African Plate.
Samos is located in the Eastern Mediterranean on the Aegean Plate. The 7.0 M earthquake on 30 October 2020 was the result of normal faulting in the Aegean Plate as part of the north-south extension caused by the accommodation of the relative motions of the plates and trench; i.e., northward motion of the African plate, southward motion of the Hellenic Trench and westward motion of the Anatolian Plate.
Large earthquakes in the Aegean Sea are common; USGS notes that there have been 29 earthquakes over 6.0 M in the past 100 years. They highlight two damaging quakes: the July 1956 7.7 M quake and its 7.2M aftershock, which caused a large tsunami, 53 deaths, 100 injuries and damage on Amorgos and Santorini; and, a 6.6 M in July 2017 near Bodrum in Turkey which caused 2 deaths and many injuries in Turkey and neighbouring Greece.
Recent Seismicity
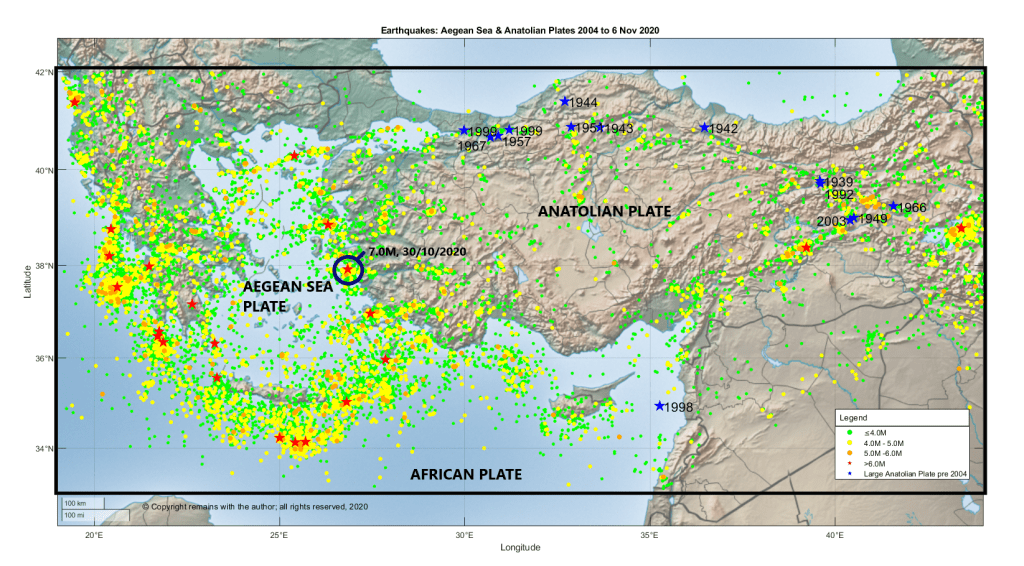
We plotted the earthquakes greater than or equal to 3.5 M between 33.0°N, 19.0°E to 42.0°N, 44.0°E (the area in the large rectangle in Fig 1) for the period 1 October 2004 to 6 November 2020 downloaded from EMSC’s earthquake search facility. In the period there were 13,034 earthquakes.
From Fig 1 above, which shows the geoscatter plot of the earthquakes, we can get a rough outline of the plate boundaries. However, some of the faults on the eastern side of the Aegean Sea Plate are accommodating the north-south extension of the plate so may not delineate the plate boundary, itself. Although our dataset goes back as far as 2004, we have added the large earthquakes of the North and East Anatolian Faults from 1939 to 2003; these are shown in blue. It is interesting to note that there have not been any large earthquakes on the North Anatolian Fault in the Anatolian Plate segments since 1999.
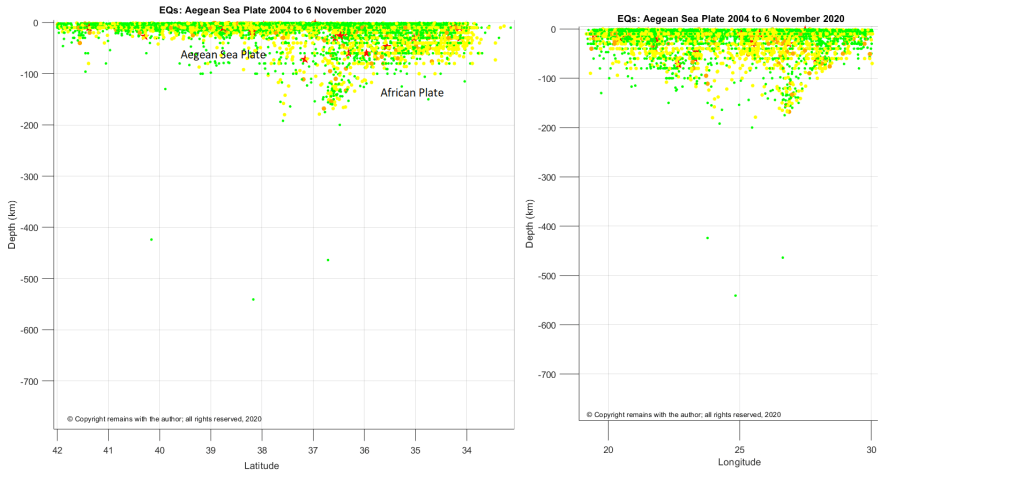
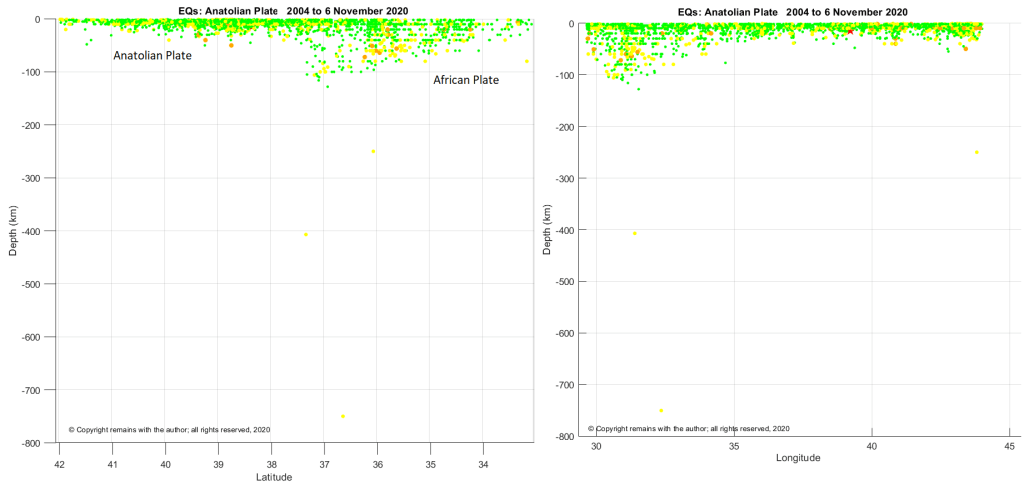
Depth plots show the subduction of the African plate under the Aegean Sea Plate (Fig 2) and the Anatolian Plate (Fig 3).
In Fig 2, we can clearly see that the descending plate under the Aegean Sea Plate reaches a depth of c. 200 km. The subduction zone feeds the Greek volcanoes, Methana, Milos, Santorini, Nisyros and Yali. There are also a few very deep earthquakes lurking in the area.
In Fig 3, we can see that the subduction zone under the Anatolian Plate does not descend as far as that under the Aegean Sea Plate. This may be why the volcanoes in western and central Turkey have not erupted in the last few thousand years, although some have erupted in the Holocene.
Our thoughts are with those impacted by the 7.0 earthquake on 30 October 2020, and, indeed, with those adversely impacted by any earthquake.
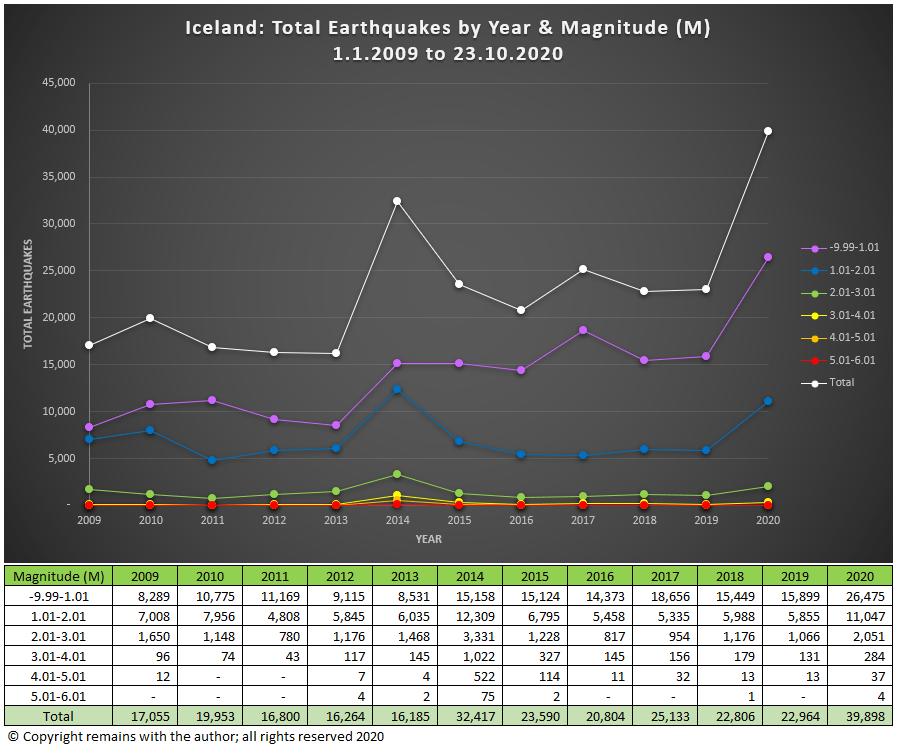
While we are waiting to see if there is any volcanic activity at Grímsvötn or her neighbours, let’s take a look at how the current seismic activity in Iceland compares to previous years.
Our database, comprised of earthquake data downloaded from IMO (see Sources below), now goes back to 29 December 2008 and extends to 23 October 2020, although we may reupload the last week soon because IMO may have been in the process of updating the record when we downloaded the data.
From our graph, we can see that the total number of earthquakes was up in 2010, 2014, 2017 and 2020. In 2010, Eyjafjallajökull erupted, in 2014, Barðarbunga erupted at the Holuhraun fissure; in 2017, there was no subaerial volcanic activity, although Katla may have had some subglacial activity, and, in 2020, there is rifting both in the Reykjanes Peninsula and Tjörnes Fracture Zone but we have yet to see what, if any, volcanic activity emerges. Interestingly, the 2011 eruption of Grímsvötn did not push the total earthquakes up in 2011.
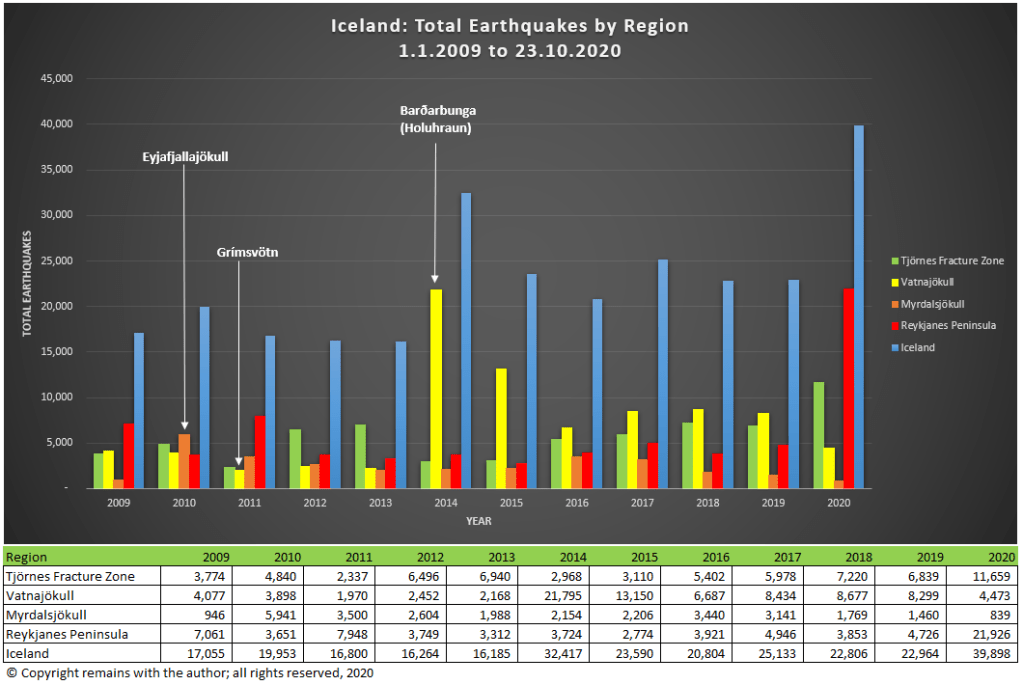
Let’s take a look at activity by region. Here we look at the four main volcanic regions: the Tjörnes Fracture Zone, Vatnajökull, Myrdalsjökull and the Reykjanes Peninsula, where there is most seismic activity.
Fig 2: Iceland Total Earthquakes by Region and Yearby the author, using data downloaded from IMO (see Sources below). Note: not all regions
We see that the eruption of Eyjafjalljokull increased the number of earthquakes in Myrdalsjökull but not to the extent that the eruption of Barðarbunga at the Holuhraun fissure and subsidence in the caldera pushed up the earthquakes for Vatnajökull in 2014 and subsequent years. In fact, the total number of earthquakes in all regions, except Myrdalsjökull, has remained elevated since Holuhraun.
Our database does not extend back far enough to draw any firm conclusions, however, it would appear that rifting events such as Holuhraun produce far more earthquakes than volcanic activity on its own.
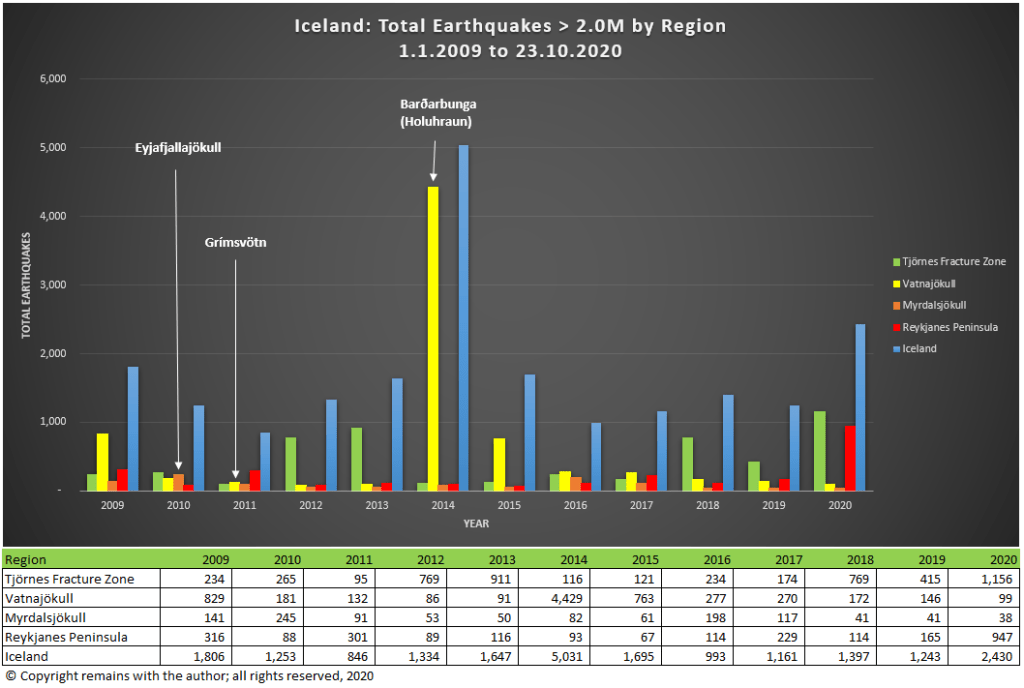
Tjörnes Fracture Zone and on the Reykjanes Peninsula
This rather begs the question as to what is happening this year with the large earthquake swarms both in the Tjörnes Fracture Zone and on the Reykjanes Peninsula. Unless our database does not go back far enough, neither the 2011 Grímsvötn nor the 2014 Barðarbunga eruption was preceded by such large earthquake swarms in other regions.
The fact that there is significantly raised activity this year in both regions suggests to us that we may be witnessing the normal plate separation on the Mid Atlantic Ridge (it is not entirely smooth), possible local magma ascent, and / or the plates accommodating an ascending blob of magma from the mantle plume, which is believed to be under the Vatnajökull icecap. There is ground deformation at several spots under the Vatnajökull icecap which points to magma ascent.
IMO have reported that there could be a magmatic intrusion at depth on the Reykjanes Peninsula; this is supported by ground deformation.
Gas measurements, ground deformation and recent seismic activity at Grímsvötn (not enough to show in our graphs but above the background levels for the volcanic system) have led to the Icelandic authorities to consider that an eruption is possible there in the not too distant future and to raise the alert level a notch (see earlier article).
It is too soon to tell whether or not the rifting events, themselves, will result in eruption(s); it is possible that it is just a coincidence that we are seeing two large rifting events at roughly the same time – both areas are seismically active. Time will tell.
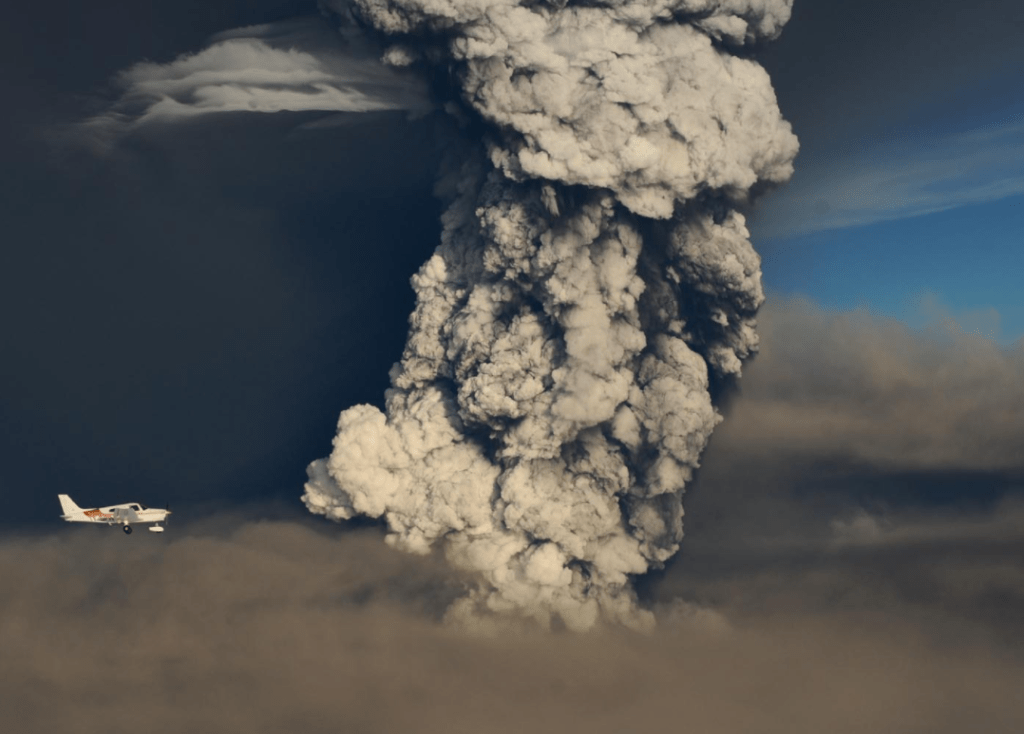
This is the third in our series on volcanic risk mitigation. Here, we cover the planning that needs to be done to mitigate the risk before our volcano really ramps up to an eruption or to deal with other volcanic related incidents.
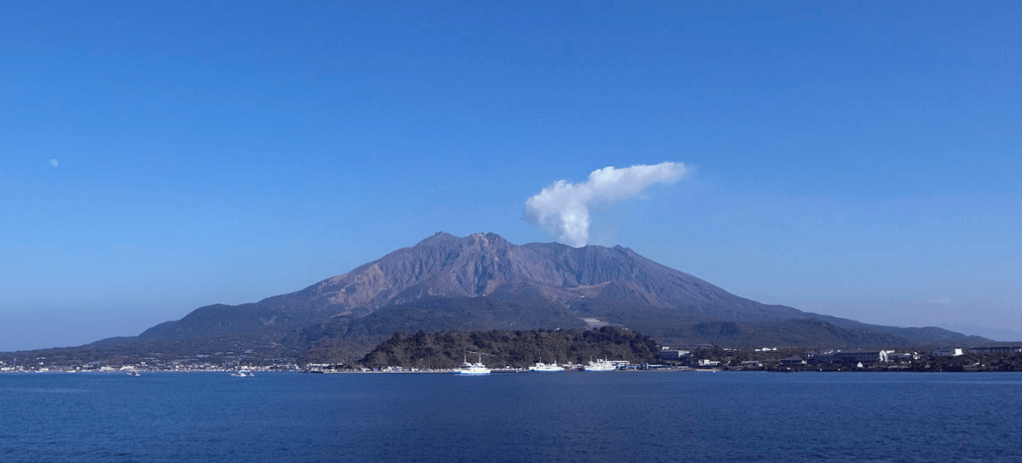
Fig 1: Sakurajima. Photo by Tanaka Juuyou, published under CC-BY-3.0
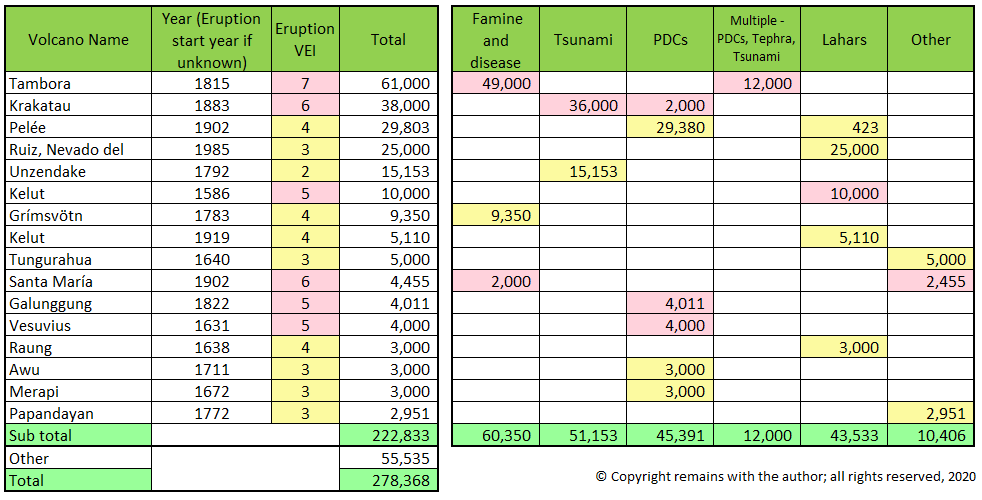
Let’s take a moment to reflect on what we are trying to prevent. In the first instance, this is loss of life, followed by loss of or significant damage to property, infrastructure, farming and other production in the zones at risk. The table below shows estimated fatalities with their cause from recent eruptions. The largest cause of death is famine and disease, followed by tsunamis, pyroclastic density currents (PDCs) and lahars. Even relatively moderate eruptions may result in a lot of fatalities.
The Volcanic Fatalities Database (see Sources below) lists many more causes, including some arising from being too close to the hazard and some others from evacuation. All of which need to be borne in mind in our disaster planning.
What Should Be in Our Disaster Management Plan?
We saw in our previous article that a lot of people are involved in risk mitigation. They all need to be on the same page when action needs to be taken. This requires planning, preparation and coordination. Like all plans, our volcanic incident management plan must cover the three “W”s – What, Who & When.
What
We cannot stop our volcano from erupting but there are few things we can do to reduce the risk, for example:
Crater lakes can be drained to remove the source of lahars (e.g. Pinatubo and Kelud).
Rivers can be widened and their banks raised (levées) to contain some lahars.
Small lava flows can be diverted.
Lakes can be agitated to release carbon dioxide and reduce the accumulation (Lake Nyos).
Some crops may be protected by sheeting.
Local planning regulations can be adapted to include reinforcement of buildings for volcanic ash and to prevent building and other activities in areas of high risk.
Organisations may opt to site critical facilities, such as datacentres, in less hazardous environments.
Some insurers may offer insurance to cover volcanic incidents; if they do, we may well have to have robust business continuity planning.
There are other hazards (e.g. pyroclastic density currents, volcanic bombs, volcanic gases, tsunamis, landslip, large lava flows) that we cannot do much about except impose exclusion zones and evacuate those in the areas at risk, when it appears likely that an eruption or other event will occur (we’ll look at “when” later). Evacuation planning includes finding suitable accommodation, food and water, and medical supplies for evacuees.
Who: Roles & Responsibilities
The “who” is based on skills and areas of responsibility.
Civil defence authorities are responsible for coordinating the response to a volcanic incident, developing and testing emergency plans and procedures, communicating with the public and media.
The volcanologists monitor volcanic activity, participate in development of volcano coordination plans, and deliver eruption updates to the civil defence authorities.
The public (businesses, non-government organisations and individuals) need to be aware of the hazards and alerts, have their own disaster recovery and business continuity management plans, and, be prepared to evacuate, if needed.
Who: Communication Protocols
Communication protocols are necessary to avoid confused messaging to the public, and should be consistent with designated roles and responsibilities. Countries have their own established protocols; in essence, these are:
Civil defence authorities advise local government / authorities, communicate with the public and the media, and issue alerts.
Volcanologists and other specialists advise the civil defence authorities. Where specialists disagree, the disagreement must be formally and openly communicated with reasons to the civil defence authorities, along with the consensus of opinion.
Volcanologists do not advise or communicate with the public, unless part of an agreed education / information program.
Volcanic Ash Alert Centres issue volcanic ash advisories for aviation.
Governments request / accept and distribute international aid with the help of aid agencies, should it be necessary.
The protocols should include designated personnel to contact, their contact details, with deputies should the initial contact not be available.
When
Judging when to take action is fraught with difficulties: evacuate too soon, people will wander back into exclusion zones to look after crops, livestock or other assets left behind; do it too late, there could be serious loss of life; or, evacuate with no ensuing eruption, the political, social and economic fall-out from what may be seen to be unnecessary disruption won’t be pretty. Timing is therefore critical.
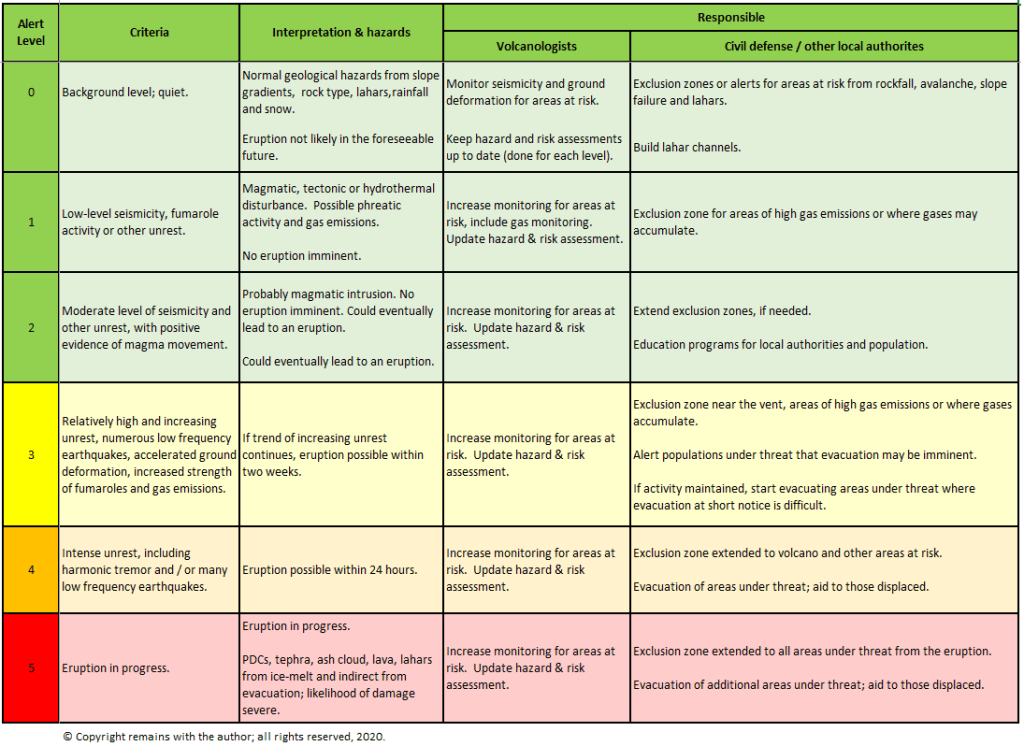
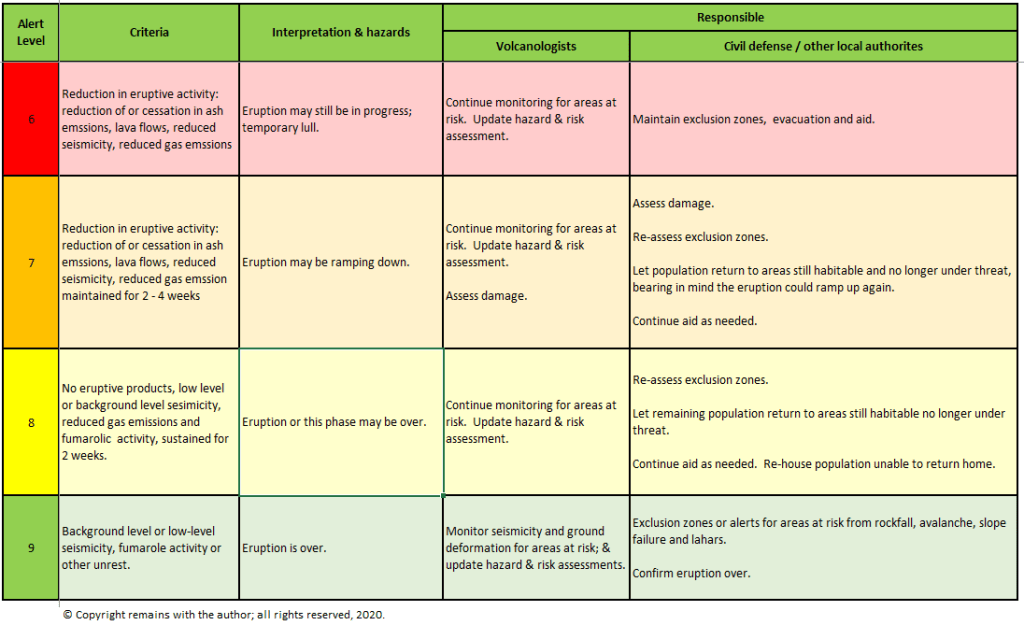
Fortunately, our volcano is unlikely to go from inactive to a full-blown eruption overnight. Various authorities have successfully used volcano activity levels to provide a system of alerts to indicate when mitigating activity should be occurring. The alert levels may be raised or lowered based on the level of unrest shown by our volcano. Countries have their own systems of alerts; we have based the alerts in our sample example of a summary plan below on those used for the eruption of Pinatubo in 1991.
The Plan
Putting all this together our plan, in summary, may look something like our theoretical sample below. This covers both ramping up to and ramping down from an eruption, and the alert levels may be changed in accordance with the level of unrest shown by our volcano. This is a theoretical sample only; your disaster management plans must be tailored to the risks posed by your volcanoes.
Note: that for each action, there will be several underlying actions. For example, building a lahar channel will require landowners’ permissions, architects, surveyors, engineers, procurement of building materials, builders, project management, etc..
Testing
OK, so now we have our plans: our alert levels, our exclusion zones, our detailed evacuation plans, our communication protocols, etc. But will they work? Testing is needed to make sure that evacuation plans work: e.g. that people can get from the area under threat to a designated evacuation centre in the relatively short space of time available, that the evacuation centre can take them, that food, water and other supplies will be available at the evacuation centre when needed.
We don’t need to get everyone in the area to participate in all the testing, desk-top “what if” scenario testing with representatives from local authorities, volcanologists and others involved in the actions can pick up obvious problems, e.g. a single road out for a population of 100,000 +. Nor do we need to wait for an eruption to solve the problem, e.g. if feasible, another road could be built to provide another exit, or we may plan to evacuate earlier.
Involving the public on a voluntary basis in testing may be a good way to get the public on board and get their cooperation, if we have the resources to manage this, not least because it provides education and information. At Sakurajima, a very active volcano in Japan, the local authorities hold an evacuation drill for the island on 12 January every year, the anniversary of a tragic eruption in 1914; this maintains awareness and means that people know what to do, should they need to evacuate for real.
Education & Information
We may have the greatest plans going but if we do not get the public on board, our plans will be less than effective. We need to have an education programme that advises the public what they need to know in time for them to take action, if required, while minimising panic. If our volcano has erupted violently in living memory, it will be easier to inform the public than if our volcano has been quiet for some time or considered dormant or extinct.
While our volcano is quiet, the public needs to know that our volcano is a volcano, the hazards and its eruptive history. They also need to know that the volcano is being monitored and that there is system of alerts in place that they may need to respond to. Organisations need to include volcanic hazards in their business continuity management plans.
When activity at our volcano ramps up, the public need to be made aware of the level of activity, its interpretation and any preparation they need to do, e.g. know the evacuation routes, have a bag packed with essentials in case they need to leave at short notice. Organisations need to know when to invoke business continuity / disaster recovery plans. Workshops, lectures and media campaigns can help to get the message across. A good example of an alert is that recently issued by the Icelandic authorities in relation of increased unrest at Grímsvötn (link: https://en.vedur.is/ & https://en.vedur.is/about-imo/news/the-aviation-color-code-for-grimsvotn-changed-from-green-to-yellow ).
When the eruption quietens down, the public need to know whether and when it is safe to return to their properties; any aid available to cover damage to property, livestock and crops; how they will be rehoused, if they are unable to return to their property; and, ultimately confirmation when the eruption is over.
Factors to Consider
Our plans have to be flexible because our volcano may have a range of eruptions sizes, for example, with an average of VEI 3, but extending to VEI 6, or our volcano may change its behaviour.
When activity starts to ramp up, volcanologists will monitor the volcano for any clues as to what our volcano will do next.
Successes
Significant loss of life has been prevented in large eruptions (Pinatubo, 1991, VEI 6) by following a disaster management process along the lines set out above. However, despite the successful evacuation of 200,000 people, 359 died from the eruption, itself, and 1,200 indirectly from disease and lahars.
Since 1991, the biggest cause of volcanic fatalities has been secondary lahars: San Cristóbal, 2,547 deaths in 1999; and, Mayon, 1,266 in 2006, although there has not been a VEI 6 or more since Pinatubo’s 1991 eruption. There have been several other fatal incidents in recent years, such as the recent eruptions of White Island, New Zealand, and Ontake-san, Japan, where visitors were caught in phreatic eruptions.
The above touches the surface of disaster management planning. Should your volcano start to ramp up, consult with the experts, such as USGS or others who have volcanoes in a similar setting to yours.
We will look at the 1991 eruption of Pinatubo and others in more detail in later articles.
“Volcanic fatalities database: analysis of volcanic threat with distance and victim classification”, Sarah K. Brown, Susanna F. Jenkins, R. Stephen J. Sparks , Henry Odbert and Melanie R. Auker, Journal of Applied Volcanology (2017) 6:15, Brown et al. (2017)
The Icelandic Met Office (IMO) has updated the aviation alert for Grímsvötn from green to yellow today (30.09.2020) because the volcano’s activity is above background level, now at a level comparable to that which preceded previous eruptions. They note:
Above average seismicity for September 2020;
Deepening cauldrons in the ice-cap round the caldera from geothermal activity;
Surface deformation exceeding that which preceded the 2011 eruption;
Magmatic gases detected in the summer of 2020.
An eruption is not considered imminent.
Water levels in the sub-glacial lake are high indicating possible jökulhlaups in the coming months. Draining of the lake by a jökulhlaup depressurised the system before the 2011 eruption, so an eruption is considered possible in the event of a jökulhlaup.
Activity may decrease without an eruption in this instance; only time will tell.
Jumping the gun a bit on our next post in the volcanic risk mitigation series, the IMO’s alert is an example of using alert levels to highlight the increased risk of an eruption to those who need to know, without being unduly alarmist – a straightforward statement of the facts supporting the current status. For the exact wording of the alert, please follow the link below.
Fig 1: Eruption column 3 hours after the onset of the 2011 eruption of Grímsvötn. Source: Sigurjónsson, O. (2011 May 21). Grímsvötn: photo 10 of 14. Retrieved from http://icelandicvolcanoes.is/?volcano=GRV
Grímsvötn is located under the Vatnajökull ice-cap in an active rift zone of the Eastern Volcanic Zone, Iceland. She erupts frequently; her last in 2011 was a large VEI 4, which impacted local farmers and livestock and aviation in Europe.
Update (02/10/2020)
Googling around a bit more, I note that Iceland’s Department of Civil Protection and Emergency Management, Almannavarnir, have reported in their 25 September 2020 bulletin that an eruption is considered likely this Autumn (use Google Translate or other tool, if you need to, as it is in Icelandic).
Our second part of our series on Volcanic Risk Mitigation covers understanding the hazards and risk posed by our own volcano.
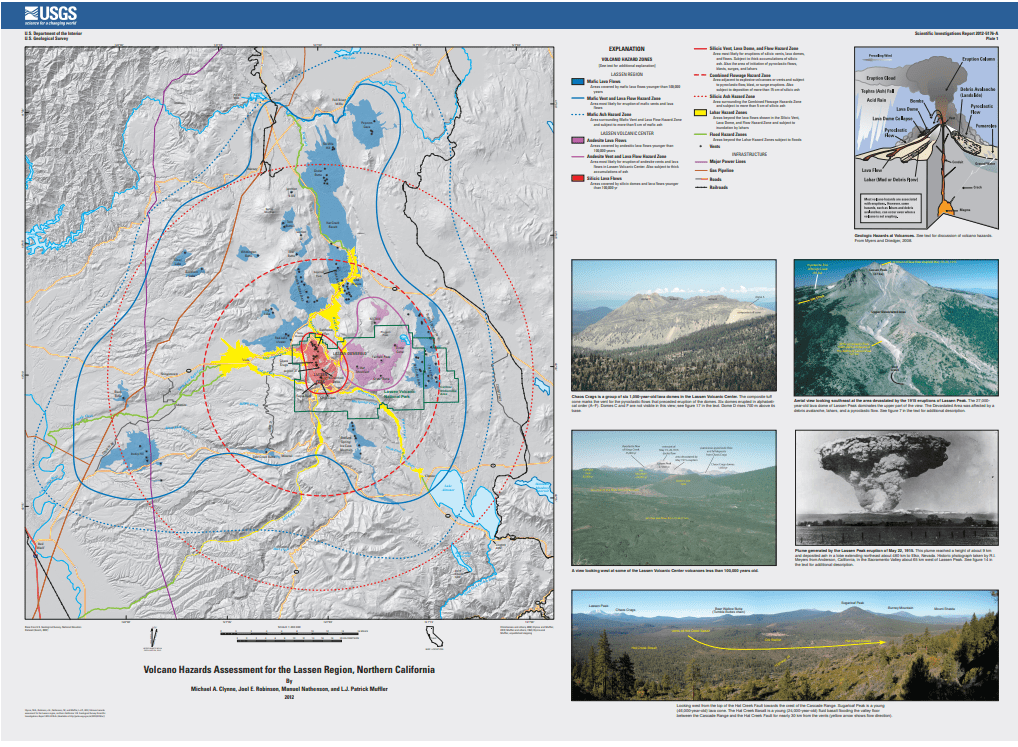
Fig 1: Lassen Peak Hazard Map, USGS, Public Domain (for full reference see Sources below). Coloured blocks indicate lava flows (mafic blue, andesite purple, silicic red) and lahars (yellow). Circles denote the extent of ash. Black dots are vents. Flood risk is also shown
Understanding our volcano is a vital part of volcanic risk mitigation. If we don’t understand our volcano and what it can do, we may not take the right action at the right time – we may call for an evacuation too soon; we may not call for an evacuation when needed; or, we may evacuate to the wrong place. If we get it wrong, the cost and disruption will be huge, and, there may be considerable preventable loss of life. We really don’t want to be at ground zero at the wrong time.
Who Needs to Know
Everyone who is likely to be impacted: the volcanologists, local authorities (government, civil defence authorities, public officials), and the general public (business, including aviation, other organisations and individuals). The following shows our roles, based on a summary published by USGS.
The volcanologists monitor volcanic activity, issue warnings to the local authorities of impending eruptions, participate in development of volcano coordination plans, and deliver eruption updates via a formalised communication protocol.
The local authorities (civil defence) develop emergency plans, provide information about local hazards and emergency procedures, and during volcanic activity, they advise residents about closures, exclusion zones, evacuation routes, and recommendations for recovery. Meteorological agencies issue volcanic ash alerts for aviation.
The public can help themselves to remain safe by learning about the hazards where they live or visit, following local recommendations to ensure households and businesses are prepared, including being able to evacuate at what could be relatively short notice (making an emergency plan and compiling an emergency kit (the essentials, like medications, that you can grab and go on the way out of the house)), and keeping out of exclusion zones.
What Can Go Wrong? Armero, 1985
Failure to understand hazards by decision makers has led to some of the worst volcanic disasters in recent history; for example, the loss of Armero and its 23,000 inhabitants from a lahar in the 1985 eruption of Nevado del Ruiz. The disaster, itself, unfolded as follows on 13 November 1985: at 15:05 a phreatic eruption started at the summit; 16:00 the local geological survey recommended evacuation of Armero; 17:00 the emergency committee met for a couple of hours (the outcome was indecisive); 19:30 the Red Cross issued an evacuation order, apparently not heeded; 21:08 the main eruption started; 22:30 an alert of an avalanche approaching Armero was issued, however, the local mayor ordered residents to stay at home; 23:35 the first lahar swept through the town, destroying it and its inhabitants.
The eruption of Nevado del Ruiz was not unexpected. There were precursors: heavy steaming occurred at the summit in November 1984; a phreatic eruption in February 1985 caused ashfall on a nearby town and a lahar that reached 27km from the volcano; earthquake swarms started on 7 November 1985 and the volcanic tremor set in by 10 November – both indicating magma was ascending.
It was known that Armero had been destroyed by lahars in 1595 and 1845, so why would the local authorities delay evacuation or be slow to order it? In addition to failure to comprehend the size, destructive power and possible reach of a lahar, the simple answers are cost, social and economic disruption, and no-one wants loss of credibility from crying wolf. An evacuation is costly in terms of moving people, providing shelter and loss of incomes.
The tragedy of Armero has led to the establishment of protocols to be followed in the event of a volcanic incident; in this instance, lessons were learned. One of the big lessons was helping local authorities and local populations understand the hazards / risks their volcano posed. Educational programmes, systems of alert levels and response protocols have been developed.
What Do We Need to Know?
To predict what our volcano may do we need to know what similar volcanoes and our volcano have done in the past. We then need to look at the impact of any eruptive activity on the local area in terms of how the following will be affected: the local inhabitants, property, the local infrastructure, farming and other economic activity.
We also need to know what baseline level of activity is so that any unusual activity which may herald an eruption is picked up early.
The Boring Bit – Definitions
We’ll get this over with quickly. The important bit is that calculating risk for hazards by location helps planners work out mitigation plans later.
A volcanic hazard is defined here as a natural process that has caused loss at a particular volcano in the past for which, based on its history, a probability can be calculated. Risk is the potential loss from a potential hazard, including loss of life, damage to property, reduction in productive capacity of the region and destruction of land, crops and habitats. Risk is used to determine, for example, the size of exclusion zones and evacuation orders. There is a formula to calculate risk:
Risk = value x vulnerability x probability of hazard.
Where value is the number of threatened assets (lives, property, farming, other commercial activity and infrastructure). Vulnerability is percentage value likely to be lost in an eruption.
Note: this formula is based on the volcano’s known history. It is a good place to start. But it has to be borne in mind that the volcano may change its behaviour so be prepared to update the risk evaluation as we get more information.
What the Volcano is Likely to Do
What type of volcano is it?
Knowing the type of volcano, its geological setting and its lavas indicates how it is likely to erupt. Our volcano is more likely to behave like others of its type in a similar geological setting than not. A shield volcano with basaltic lavas is more likely to have effusive eruptions rather than explosive eruptions. A stratovolcano or composite volcano with more viscous silicic lavas is more likely to have more explosive eruptions. Glacier, ice-caps or high rainfall may cause lahars or jökulhlaups. Proximity to large inland bodies of water or the ocean adds the risk of tsunamis.
What has the volcano has done in the past?
So we know what type our volcano is, its lavas and what similar volcanoes have done, which give some indicators of what it could do. But what has it done so far? How big have its previous eruptions been, how far did the ash travel, what precursors have there been, etc.?
Volcanologists check out the volcano’s eruptive history by looking at both historic records and the local geology. Historic records may indicate what the precursors for an eruption were, such as gas or steam emissions and earthquakes, as well as the eruptions themselves. Geological records, such as tephra layers (age, depth, composition) provide evidence of previous eruptive activity, e.g. pyroclastic flows , lahars, lava flows and lava compositions, and caldera formation. The geology can also tell us if there is ground water held in aquifers which could lead to phreatic eruptions.
Volcanologists may also check out the stability of the edifice: how quickly was it formed; what is it made of; what is it built on; and any evidence of faults.
Local Impact
Local government should have most of the data necessary to calculate the impact of a hazard at any one locations (local community, infrastructure and economic activity, etc.) from census and other activities. This should be checked out as far as is practical to make sure that it is up to date by looking at what is on the ground.
Hazard Mapping
With all this data, volcanologists calculate the volcanic risk for each hazard by geographic location using the formula above (a huge exercise, we are just skimming the surface here), collate their findings in reports and create hazard maps, which summarise the risk by location and by hazard (see Fig 1 for an example). These maps are an important means to share the risks with local civil defence authorities and will be part of the decision-making process regarding exclusion zones or evacuation plans, should our volcano stir.
Baseline levels of activity
Volcanoes in repose are not quiet; they have low levels of activity from minor internal movements of magma and degassing and tectonic movement of local faults, with associated low levels of seismicity, gas emissions, minor ground deformation (inflation and deflation).
We need to know what activity is usual for the volcano while it is in repose so that any unusual activity can be detected early. This will require seismometers, thermal imaging, tilt-meters, GPS, satellite and gas monitoring; seismometers are critical.
When Do We Need to Know It?
The short answer is the sooner the better. The geological surveys needed can take months. And, if we can get it, we need the base line data for the volcano in repose. On the other hand doing the hazard and risk assessments is costly so countries tend to focus on those volcanoes that pose most risk (e.g. are near large cities).
If the first inkling we have that our volcano is active is a seismic swarm and steam jets, the volcano is stirring so the hazard and risk assessments are critical. As time may not be on our side, we may need to call in experts from other countries to help out.
What is in Place Now?
It’s been a while since Armero, where are we now? Most countries with active volcanoes have the basics in place to monitor their known active volcanoes. The level of monitoring depends on the wealth of each country and the perceived risk those volcanoes pose. Some organisations, such as USGS and various universities, offer assistance in volcanic risk mitigation, which includes hazard identification, evaluation and mapping.
Following the Armero disaster, the International Association of Volcanology and Chemistry of the Earth’s Interior, IAVCEI, successfully created an educational video, “Understanding Volcanic Hazards”, to help decision makers and local people who had little awareness of what a volcano can do. Since then, with the advent of the internet, there is a wealth of educational material available to draw on. Many volcano monitoring organisations make some data publicly available.
There are various programs in place to study volcanic risk, including the Decade Volcano Program, set up by IAVCEI, the Yokohama strategy, the biennial Global Assessment of Risk (GAR) report published by the United Nations Office for Disaster Risk Reduction (UNISDR), the EU has also started major research programs dealing with risk assessment.
Data bases have been set up by various bodies describing volcanoes, their eruptive history and known hazards, such as the Global Volcano Model, the Smithsonian Institute’s Global Volcanism Program and Icelandic Volcanoes – the latter two have been referred to in this blog on many occasions.
Hopefully, we will know our volcano before she wakes up fully and be prepared for the crisis management mode if an eruption ensues.


