Updated earthquake density video added (uses satellite image as background). 12.04.2021
Good Morning!
Geldingadalur – Where Are We at Now?
Since we last wrote, the new volcano at Geldingadalur has continued to erupt with a lava output rate between 5 m3 per second and 10 m3 per second, filling the Geldingadalur valley with more lava. The University of Iceland has confirmed that the early lava erupted has a magnesium content of 8.5%, a low titanium dioxide content and is more depleted in rare earth elements (low HREE to LREE ratio) than earlier historic lavas, indicating that it is a more primitive lava sourced from the lithospheric mantle at a depth of between 17 km and 20 km.
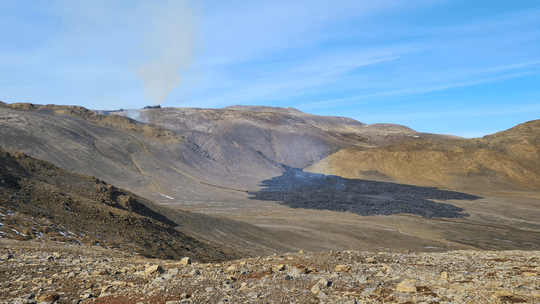
On 5 April 2021 at around midday, a new fissure opened up about 700 m north east of the original eruption site. The fissure, spotted by a sightseeing helicopter, was quickly confirmed by the RUV.is webcam monitoring Geldingadalur. Fortunately, no-one was in the vicinity at the time due to bad weather and sheer good luck; the site had been open to visitors at the time. The fissure is around 200 m long. Lava from the fissure is flowing into the Meradalir valley.
Fig 1: New fissure on 05.04.2021 in the foreground with lava flowing to Meradalir on the left of the image. The original Geldingadalur eruption is on the right of the image. Photo IMO.
Fig 2: Lava from the first new fissure entering Meradalir at 15:00 06.04.2021. The fissure itself is on the ridge in the background (Photograph: Public Protection/Björn Oddsson).
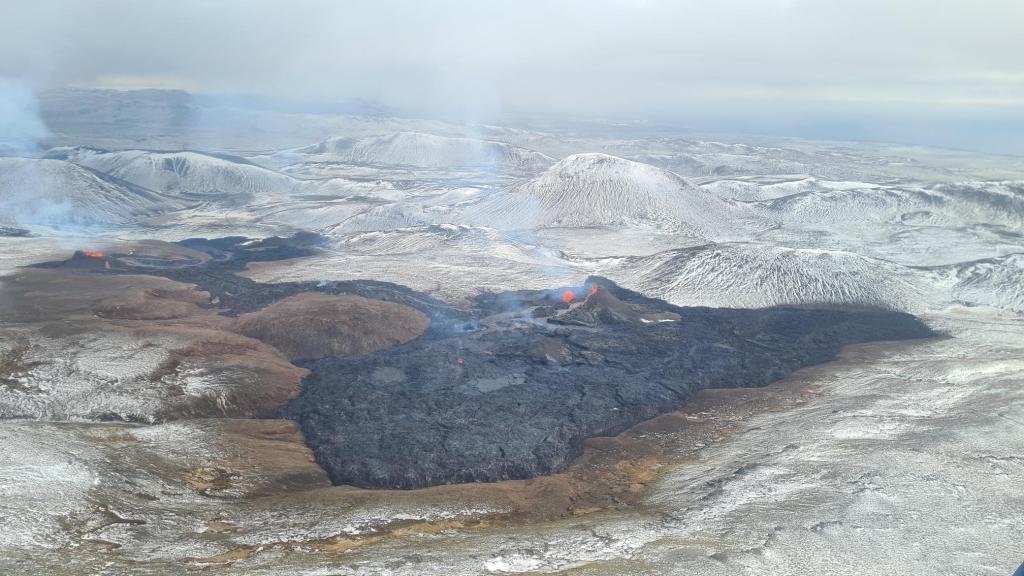
At around midnight on 6 April 2021, a second fissure opened up between the earlier fissure and the original eruption site. This had been preceded by a landslip earlier in the day. Lava from this fissure is now flowing into both the Geldingadalur and Meradalir valleys, linking the eruption sites. It is believed that the three eruption sites belong to the same fissure.
Fig 3: Photograph from Public Protection/Björn Oddsson showing the three eruption sites and lava flows.
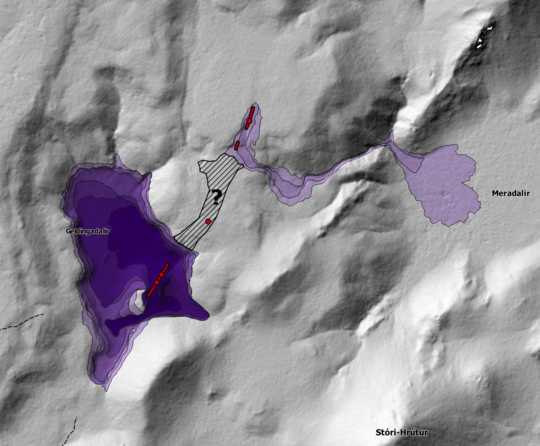
Fig 4: Map showing the location of the three eruption sites from IMO. The fissures are shown as red lines and dots; and, lava flows are based on photography.
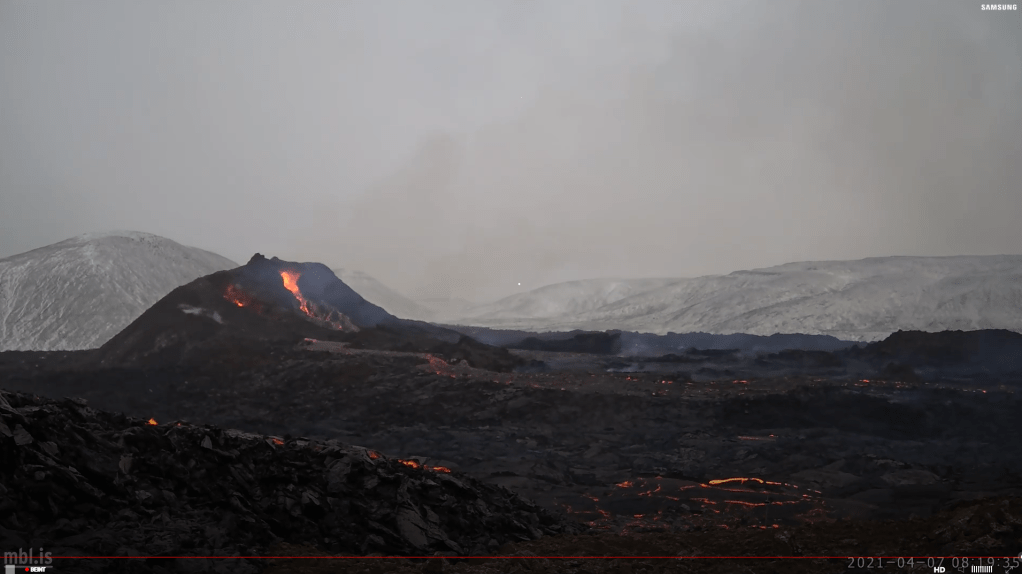
Unfortunately, one of the webcams set up by mbl.is to monitor the Geldingadalur cones was lost; its last image is shown below. We thank mbl.is for providing the webcam; we viewed its images with a lot of interest.
Fig 5: Screenshot from the mbl.is webcam.is set up to monitor the cones at Geldingadalur. This may be this webcam’s last image. The lava flow to the lower left of the image is from the newest fissure.
Like the original eruption site, neither fissure opening was heralded by an increase in seismicity in the immediate vicinity.
Seismicity Post the Initial Eruption
We have updated our earthquake plots for the period 19.03.2021 to 06.04.2021. We can confirm that there is very little earthquake activity in the vicinity of Geldingadalur. The fissures are not giving any seismic warning; seismic activity near Keilir dominates. It is perhaps surprising that magma has not made its way to the surface north east of Fagradalsfjall; does magma finds it easier to make its way through older fault-ridden Pleistocene rock that has not been covered in tougher historic lavas?
We have also tried our hand at making a video of the earthquake density plots by month from 2008 to 6 April 2021. Months are numbered from January 2008 (Month 1) to April 2021 (Month 160, which only has 6 days). If you make it all the way through, you will see that Fagradalsfjall has had several swarms, albeit much smaller than the current one. Enjoy!
The eruption at Geldingalur, Reykjanes, Iceland, which started on 19.03.2021 at 20:25, is continuing unabated as I write. The volcano is happily bubbling away building somewhat unstable but impressive looking cones and covering the Geldingadalur valley floor with lava.
Fig 1: Cones of Geldingadalur, cropped from an image by Berserkur, published under CC BY-SA 4.0
The eruption is steadily increasing at the time of writing; it has a lava output of 5 -7m3 per second. IMO have estimated that the valley would fill enough for lava to overflow into the neighbouring valley, Meradalir, in a matter of days at the current eruption rates.
Fig 2: Image by IMO. Expected path of the lava over the next few days at the current eruption rate.
Scientists at the University of Iceland are analysing the lava. To date, they have reported that the lava is a primitive one (i.e. little magma evolution in the crust), indicative of a mantle source at a depth of 17 km to 20 km.
Geological Setting
The Reykjanes Peninsula lies on oceanic crust created by the Mid Atlantic Ridge. The Peninsula, itself, straddles the Ridge. The crust here is 15 km thick, which is unusual so close to a spreading ridge. However, Iceland is a basaltic plateau overriding a mantle plume. Both the mantle plume and the Mid Atlantic Ridge influence formation of the crust. There are no magma chambers / reservoirs in the crust on the Peninsula; magma tends to ascend directly from the mantle.
The Peninsula is made up of lava shields, móberg hills, table mountains and fissure-fed lava flows and crater rows. The shield volcanoes on the Peninsula formed at the beginning of the Holocene between 10,000 and 7,000 years ago. Shield volcanoes form from hot picrite or olivine tholeiitic basaltic lava flows with rates of c . 5m3 per second. The móberg hills formed from submarine fissure eruptions and consist of pillow lavas, breccias and tuffs. The table mountains were formed from subglacial activity, which had the activity not been constrained by the ice cap, would have resulted in shields. Later Holocene activity has comprised effusive tholeiitic fissure eruptions which formed crater rows and produced large lava flows that now cover some of the earlier formations. Historic activity has been between 940 AD and 1340 AD, including the Reykjanes Fires of 1210 AD to 1240 AD; and, the Krýsuvík Fires of 1151 AD to 1188 AD.
Geldingadalur, itself, is a small valley to the south east of the summit of Fagradalsfjall, a 385m high hyaloclastite subglacial Pleistocene table mountain formed during the Weichselian glacial period, with a subaerial lava cap on its northwest part. It is currently classified as part of the Krýsuvík Volcanic System.
The Fagradalsfjall area is seismically very active, with large earthquake swarms, notably in 1998, 2000, and 2004, and again now as part of the new volcano-tectonic episode on the Reykjanes Peninsula that started in December 2019. Various studies from previous seismic activity have noted extensive faulting under the south west part of Fagradalsfjall; these faults strike N-S and NE -SW. In addition, there are two clusters of faults under the eastern part.
Earlier swarms in the current volcano-tectonic episode have resulted in magma intrusions, such as the one at Mt Þorbjörn which we discussed last year, but no eruption. The latest earthquake swarm which started on 22 February 2021 is the only one to result in an eruption at the time of writing.
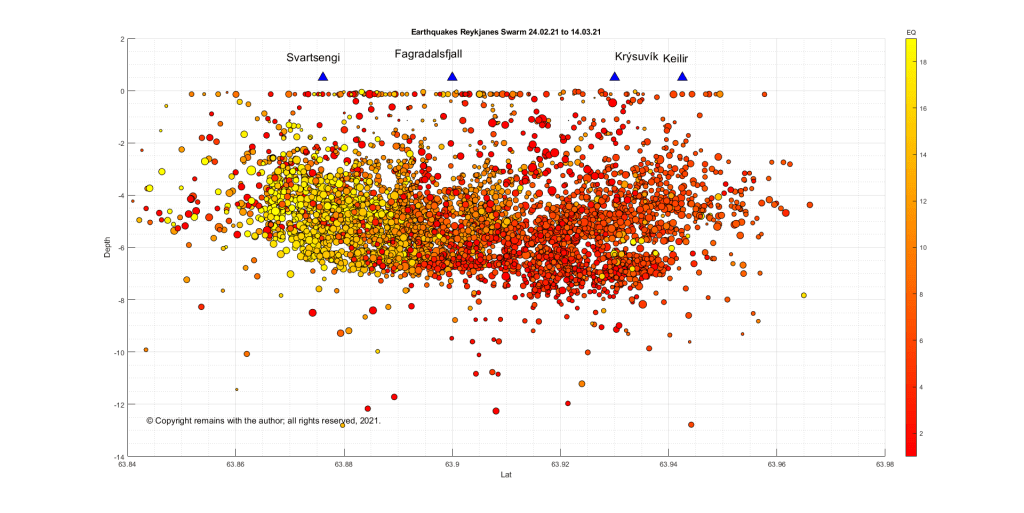
Seismicity in the Current Swarm
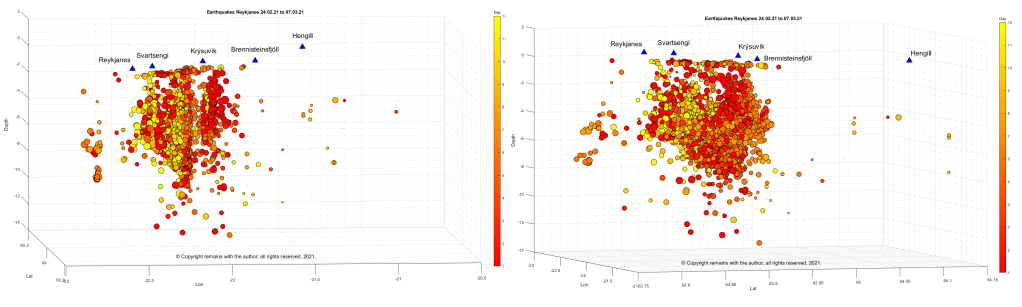
We have updated our plots for the Reykjanes Peninsula and dividing them between the run up to the eruption on 19 March 2021 at 20:45 and after the eruption to 26 March 2021 15:55.
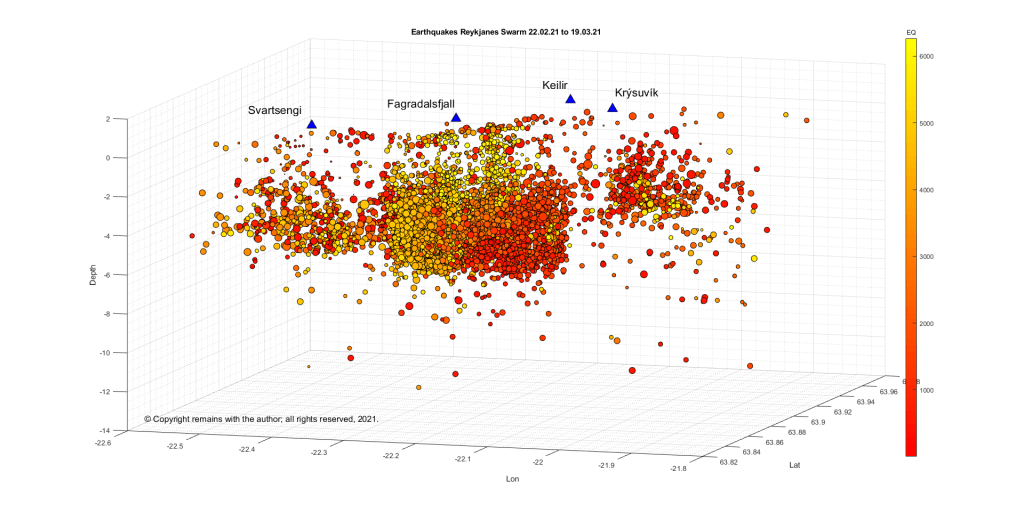
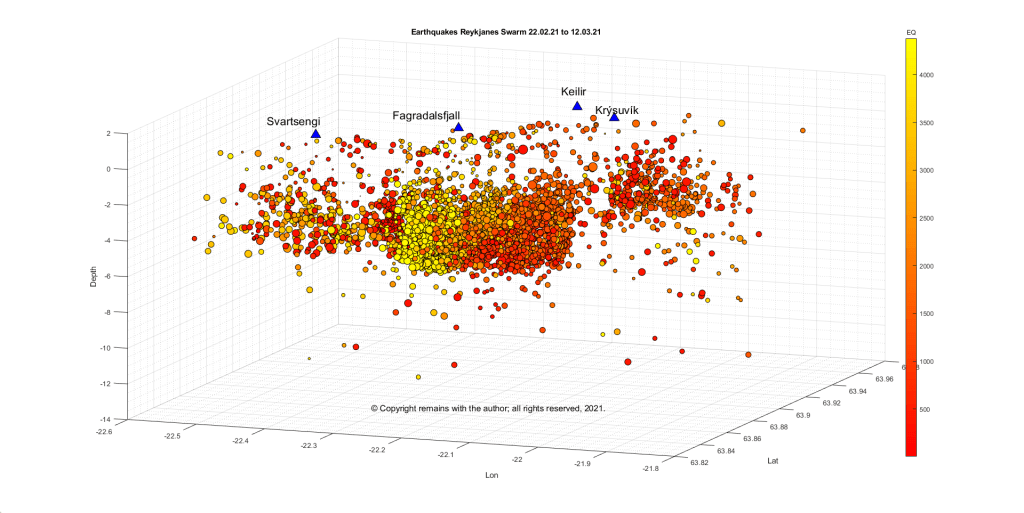
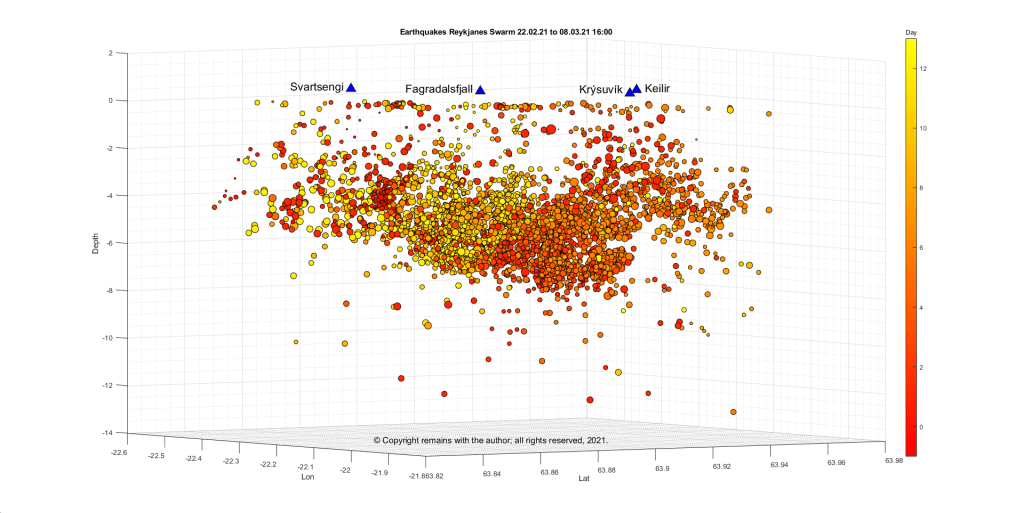
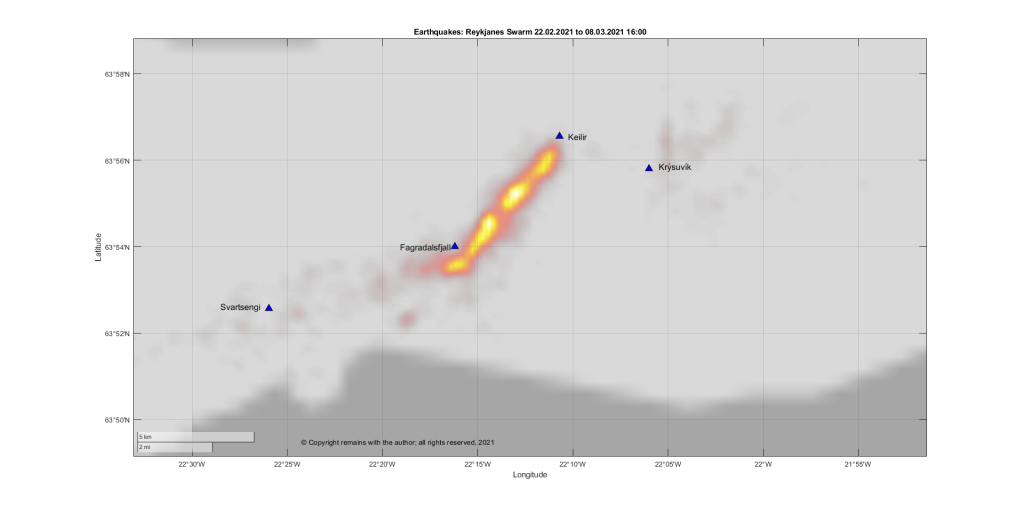
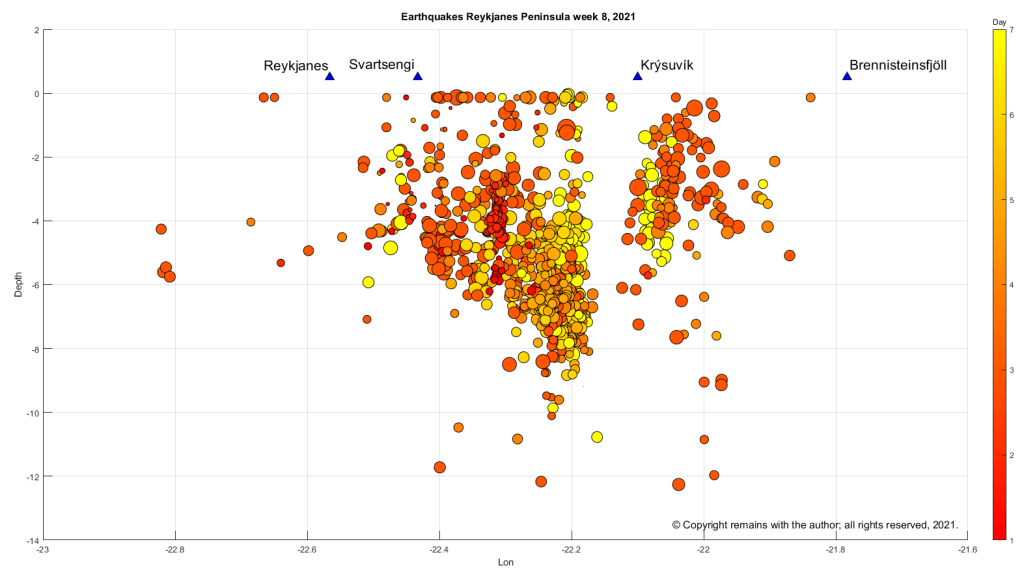
The plots preceding the eruption repeat the ones shown earlier so we are just showing the geodensity plot for comparison. You will note that the earthquakes do not reach down to 15 km in the current swarm to date. However, there were one or two deeper earthquake in some of the earlier episodes.
The plots for the period after the onset of the eruption (19.03.2021 20:45 to 26.03.2021 15.55) show that activity is concentrated on Geldingadalur and two spots north east of Fagradalsjall. Seismic activity has also extended further south.
Fig 1: The eruption at Geldingalur earlier today, 20.03.2021. Image from IMO.
For this update, our information comes from IMO and the Department for Civil Defence. We will update our earthquake plots later on.
The eruption which started yesterday on a ridge in Geldingadalur has been assessed as a minor one, contained in the valley; the eruptive fissure is around 500m to 700m long; and, there is no ash or tephra. Levels of S02 are low, except near the eruption site; gases can accumulate in the valley or other depressions. The main road to Keflavík from Reykjavík has been opened. However, the road between Grindavík and Þorlákshöfn is closed. The aviation code has been lowered to orange.
The eruption may change without notice. The Department of Civil Defence warn of the potential for new fissures opening either at the current site or elsewhere from the dyke near Fagradalsfjall. Large earthquakes are considered unlikely at the eruption site but the risk for a magnitude 6.5 still remains for Brennisteinfjöll. At the moment seismicity on the Reykjanes Peninsula is much reduced.
Fig 2: Map of earthquakes in the last 48 hours on the Reykjanes Peninsula by IMO.
Hazards for those visiting the site are getting too close to the lava flow and not being able to outrun any lava that breaks off it; the craters are unstable and may break, releasing a lava flow; and explosions where hot lava meets water-logged ground. The Department of Civil Defence advises observers to keep to the hills surrounding the site. Not that it is easy to get to without a helicopter!
Local webcams have been set up from which the rest of us can watch; one is:
This was going to be a post with an update on the earthquake swarm on the Reykjanes Peninsula, but the magma beat me to it! IMO has just confirmed that a volcanic eruption is underway near Fagradalsfjall at Geldingadalur. The eruption started at 20:45 19.03.2021. It has been named as Geldingadalsgos, after the valley. At the time of writing, the eruption is a small fissure eruption; the fissure is c. 0.5km long.
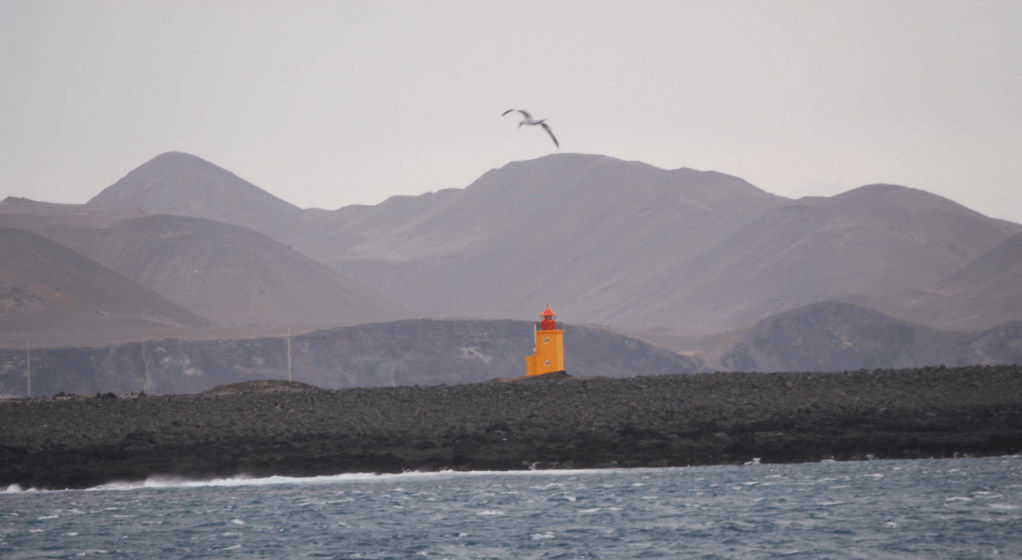
Fig 2: Hópsnes Lighthouse, Grindavik looking towards the Fagradalsfjall system. Image cropped from one by Martin Morris, published under CC-BY-SA 2.0
The public have been advised not under any circumstances go close to the eruption site or on Reykjanesbraut. First responders need to be able to drive freely to assess the situation. Scientists are working on assessing the eruption, the site and possibilities.
People living nearby in Þorlákshöfn have been instructed to stay indoors, close windows and turn up their heating to avoid exposure to any volcanic gases. The Reykjanesbraut has been closed – the main road from the capital region to Reykjanesbær and the international airport at Keflavík.
Fig 3: Aviation code red; source IMO.
Fig 4: IMO’s confirmation of the eruption (third warning down). This is an extract from a screenshot of the page.
Here are the updated earthquake plots by the author, anyway. The raw earthquake data has been obtained from IMO; this is confirmed earthquakes to date (19.03.2021 15:00). IMO’s page above gives the more recent earthquakes.
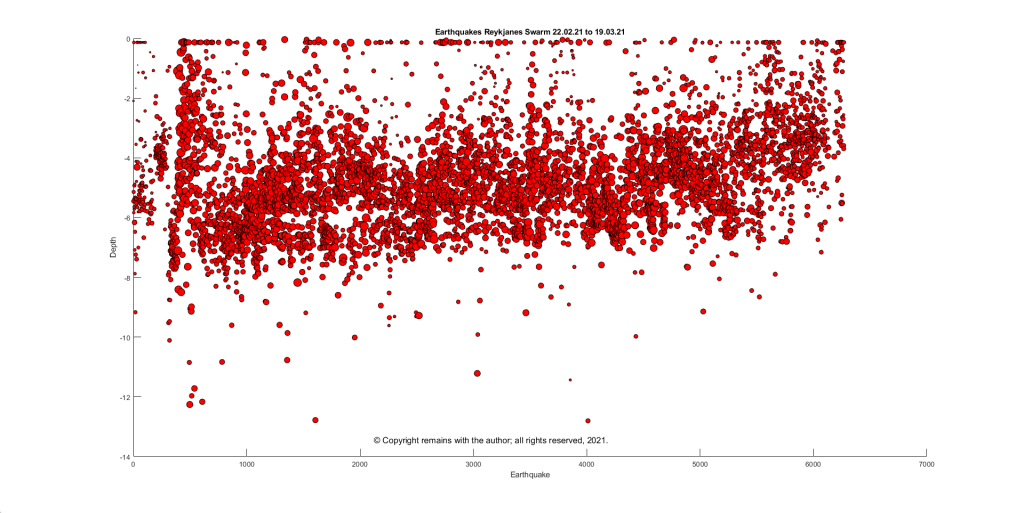
What we see from the plots is that seismic activity has now extended beyond Reykjanes to the west and the swarm is still active. Activity in the swarm is densest to the NE and SW of Fagradalsfjall. The depth plot shows that earthquakes in the swarm are tending to be smaller and shallower.
Extension of the swarm to the west is in keeping with the swarms which have occurred since December 2019.
14.03.2021: The magma intrusion on the Reykjanes Peninsula appears to be edging further southward. The longer this continues, the more likely an eruption. New plots added (Figs 13 – 15).
Update 14.03.2021
We have moved updates to the beginning of this post. The original post from 9 March 2021 and the earlier update are below.
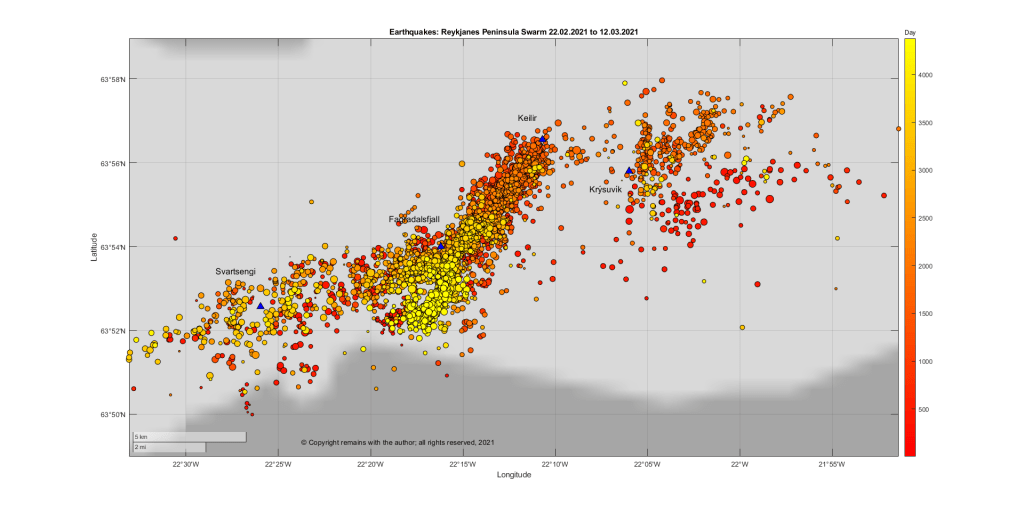
We have updated our plots to 14.03.2021 17:46 for the area between 63.83314°N, 22.55148°W to 63.96605°N, 21.8566°W . Here are the results; the magma intrusion appears to be edging slowly further southwards, if we use the Department of Civil Protection’s line that the earthquake locations are the best indicator at the moment of where the magma is.
For the current status and advice, please consult IMO.
The Armchair Volcanologist
Update 12.03.2021
Since we wrote [our original post], the earthquake swarm continues unabated with several thousand more earthquakes and some more tremor pulses.
The Department of Civil Protection report today includes the following:
“Earthquake activity now reaches up to the Nátthagi valley south of Fagradalsfjall, which suggests that the southernmost end of the magma path lies there.
The magma path continues to expand although there is some uncertainty regarding the pace of the magma flow. Data has indicated that the magma path has been moving towards the south coast in the last few days, but latest surveys do not indicate that the path has moved notably in the last 24 hours.
With view of the eruption history and geological research, a volcanic fissure opening south of Fagradalsfjall and reaching the ocean is unlikely. Given the current circumstances, an undersea eruption with associated ash eruption is therefore unlikely.
As has been stated earlier in the Science Board’s notifications, while the magma path continues to expand it must be assumed that an eruption may occur in the area. The longer the current situation lasts, the more likely an eruption becomes. “
They also note that gas measurements are being taken in the area.
Our updated plots show the seismic activity moving further southward, notably the geodensity plot in Fig 12. There is also some parallel activity further west on a much smaller scale.
For the current status and advice, please consult IMO.
The Armchair Volcanologist
09.03.2021
An eruption considered likely; magma c. 1km below the surface.
Good Afternoon!
Despite the earlier tremor pulses, the Krýsuvík Volcanic System has not yet erupted. However, as seismicity continues to be intense, with well over 34,000 earthquakes recorded by Iceland’s SIL system now since 24 February 2021, it is thought that an eruption is likely.
The latest report from Iceland’s Civil Protection Service Council on March 8, 2021, states that if an eruption occurs, the most likely scenario is still a fissure eruption between Fagradalsfjall and Keilir. A magma intrusion (they use the term tunnel) is forming in the region, with most recent activity at its southern end. Magma has now reached an upper depth of c. 1 km. GPS and satellite readings indicate that the magma flow has decreased in the past week. If the intrusion continues to grow, further surges in seismic activity can be expected.
The earthquakes trending westward from the vicinity of the magma intrusion are thought to be the result of the crust accommodating the intrusion. No other magma movement has been detected during this swarm.
So where are Fagradalsfjall and Keilir? Here is a map (with directions on how to drive from one to the other, not that we would recommend that at the moment).
Fig 1: Extract from Google Maps showing the location of Fagradalsfjall and Keilir.
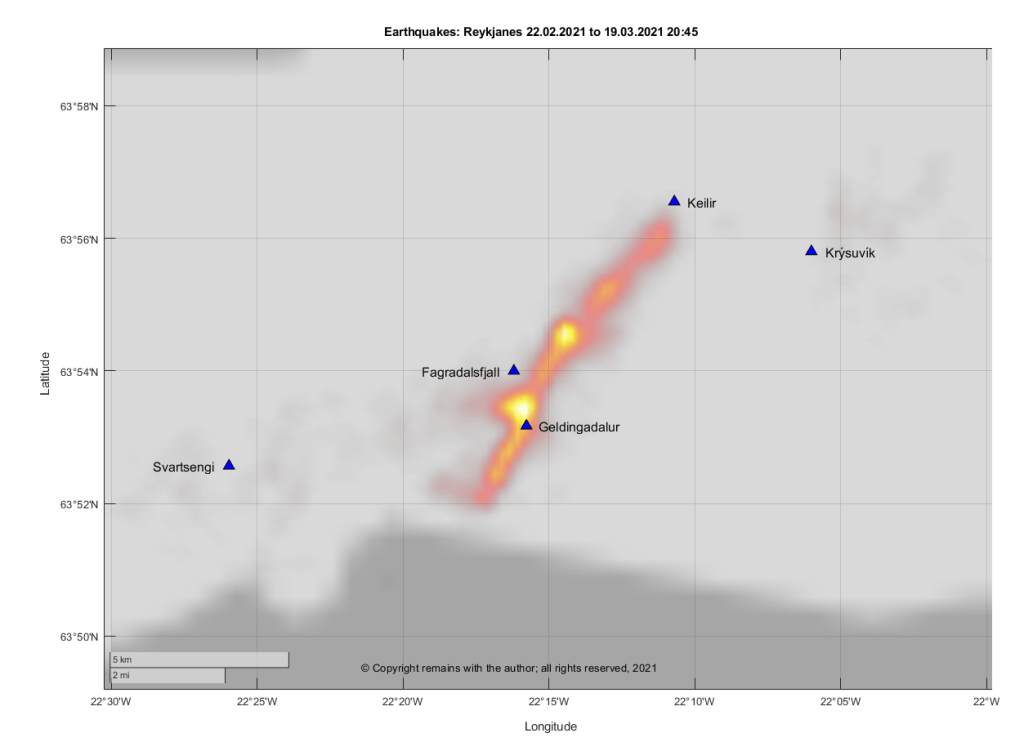
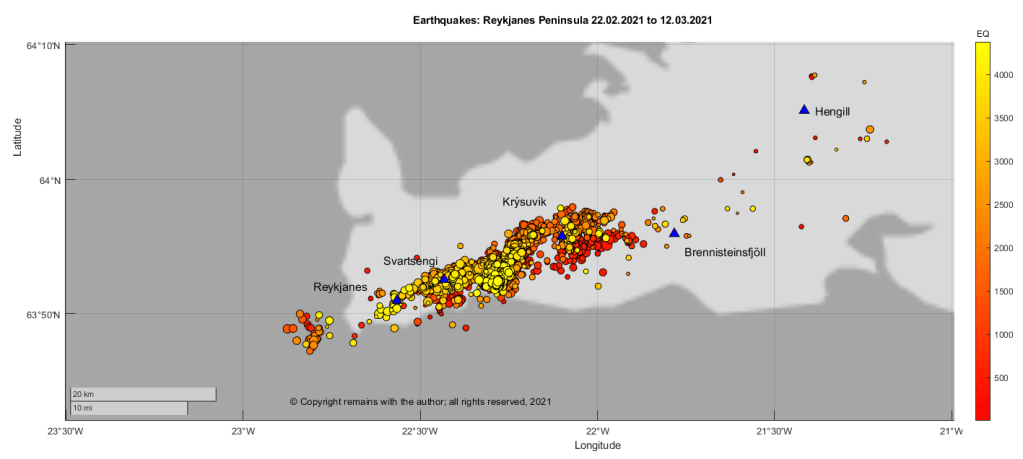
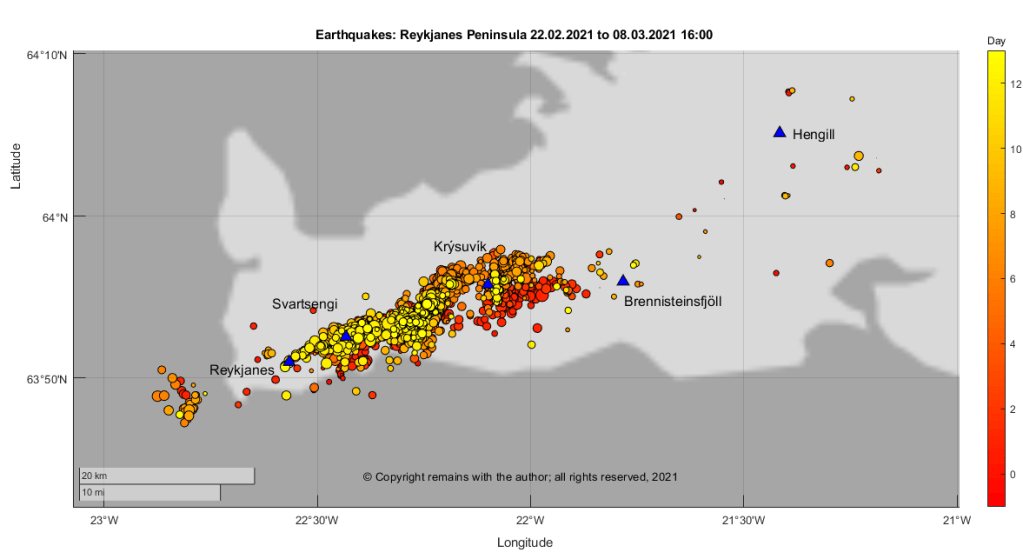
We have plotted the confirmed earthquakes for week 8 and week 9 2021, plus a few hours of yesterday, between 63.7°N, 21.0°W to 64.4°N, 23.0°W download from IMO’s site. Here are the latest plots for the Reykjanes Peninsula, 63.7°N, 21.0°W to 64.4°N, 23.0°W:
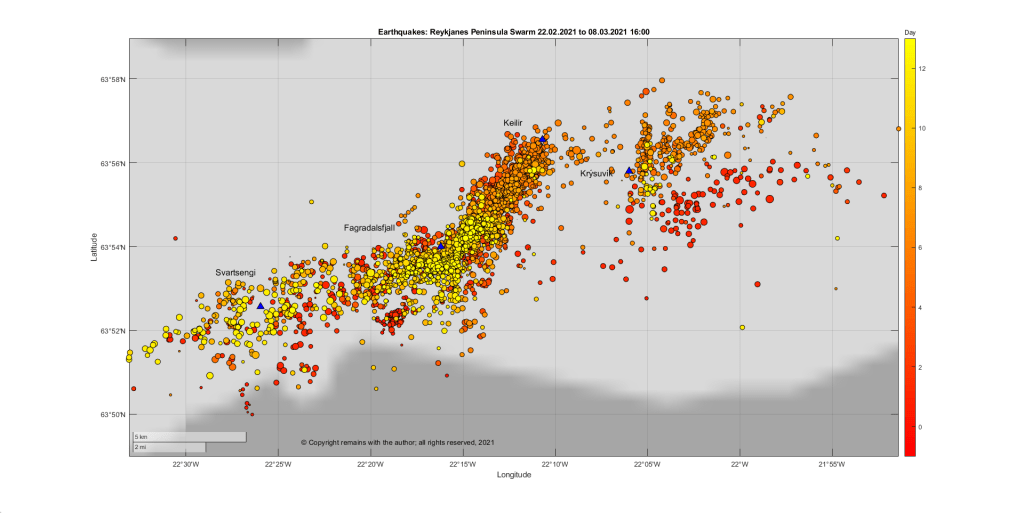
If we zoom in on the area between 63.83314°N, 22.55148°W to 63.96605°N, 21.8566°W we can take a closer look at the intrusion, itself, (or the earthquakes magma movement is causing). The area was selected to take in Svartsengi, Fagradalsfjall, Keilir and Krýsuvík.
Since we downloaded the data for the above plots, IMO have reported another short-lived burst in seismic activity at 05:20 this morning with a seismic tremor Mt. Fagradalsfjall, south of the intrusion.
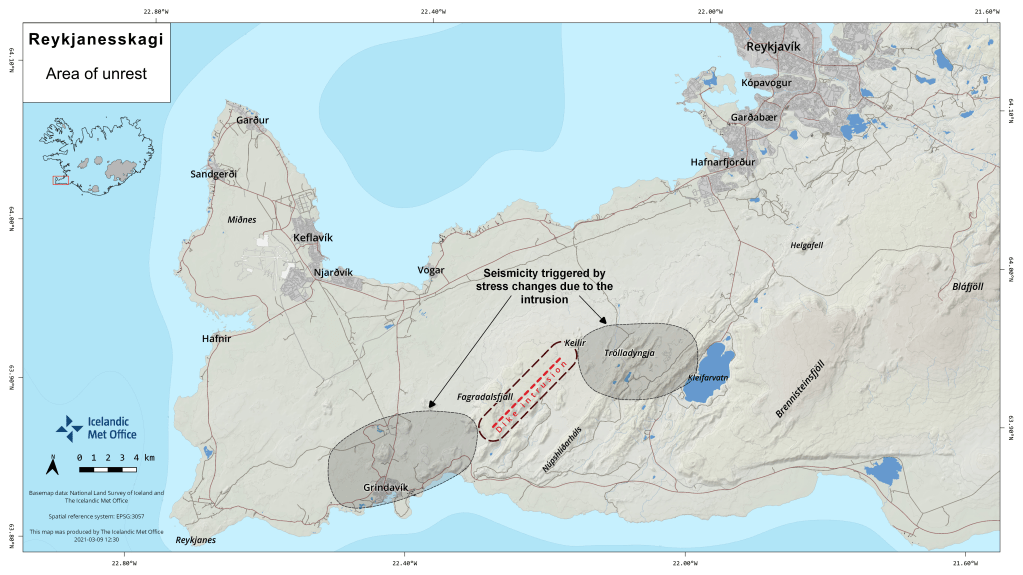
IMO have produced a map of the dike intrusion and the areas of seismic activity that are arising due to the increased tension in the crust caused by the intrusion.
Fig 8: Map by the Icelandic Met Office showing the dike intrusion and the areas of stress.
For the current status and advice, please consult IMO.
3 March 2021 (Updated 07.03.2021 – new plots added).
The earthquake swarm which started on 24 February 2021 between Kleifarvatn and Svartsengi on the Reykjanes Peninsula is continuing.
Fig 1: Keilir. Image cropped from one taken by Michal Klajban, published under CC BY-SA 4.0. Keilir is the dark cone in the background; Spákonuvatn lake is in the foreground.
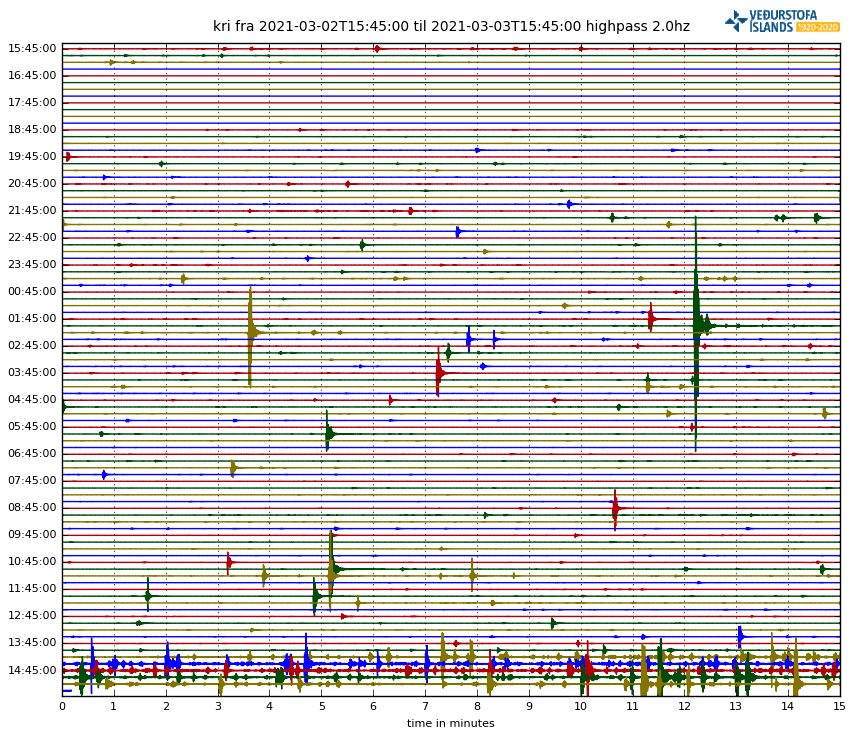
IMO have raised the aviation code for Krýsuvík to Orange and report a tremor pulse south of Keilir. At the time of writing, no eruption has been confirmed; however, visibility of the area is hampered by weather.
Fig 2: Drumplot showing the onset of the tremor pulse. Source: IMO.
If magma does reach the surface, the most likely scenario is a fissure eruption, which would produce effusive basaltic lava flows and toxic gases, rather than an explosive ashy eruption. If lava meets a significant amount of water, some tephra may be produced.
The likely impact from any eruption is expected to be disruption of air traffic and also road traffic access to and from Keflavík International Airport, if lava flows cross the access road.
Keilir, itself, is a subglacial mound near Krýsuvík formed during the Pleistocene during a fissure eruption. The mound is built of tephra formed when melting ice met magma, topped by lava. Fagradalsfjall, another location associated with the earthquake swarm, is a Pleistocene table-mountain. As lava prefers to take the easy route out, it is unlikely to emerge via these two volcanoes whose lavas would be fairly solid – hence the expectation of a new fissure swarm.
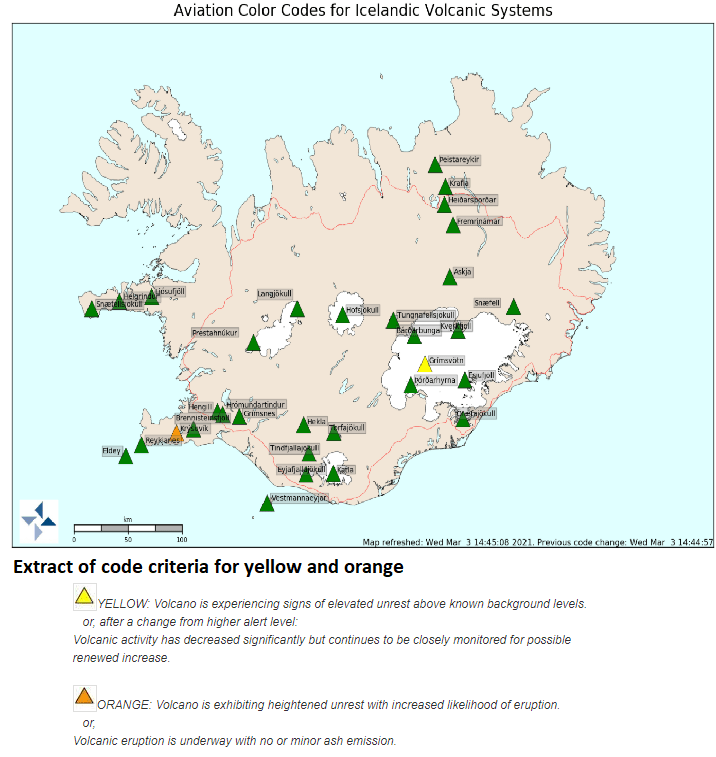
Fig 3: Current aviation codes for Iceland. Source: IMO.
For status updates, please consult IMO.
A local news service that is also providing updates in English is the Reykjavik Grapevine.
Life is not easy for the research scientists monitoring events. Two had to be rescued after having been separated from the main party while studying gas emissions. Spare a thought for the risks they take.
The public have been advised to stay clear of the area at least until it is known where and how lava emerges and where it would be safe to observe the eruption.
In our excitement at the thought of a possible eruption we overlooked the very real risk of larger earthquakes, if the intensity of the swarm continues: up to 6.0 M near Fagradalsfjall and up to 6.5 M in the Brennisteinfjöll range. Be careful if you are in the area.
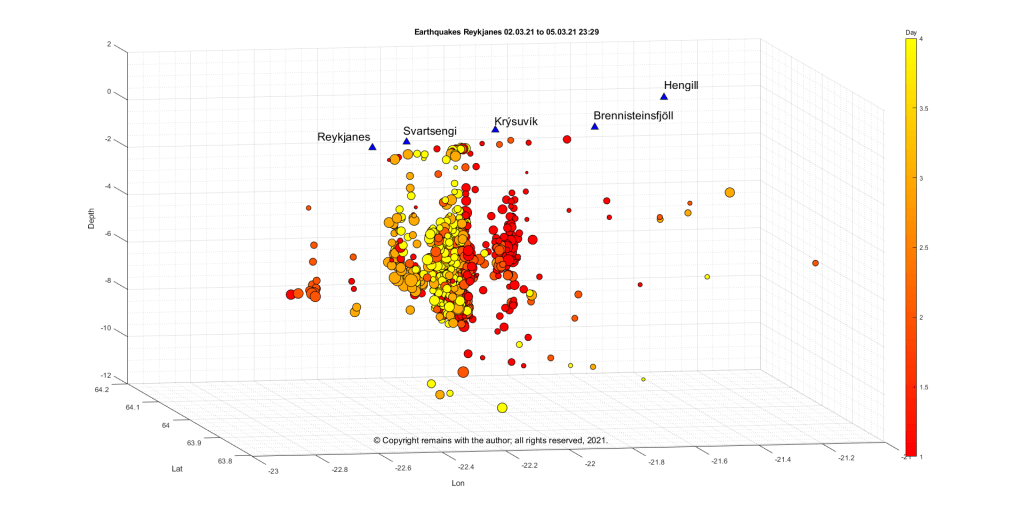
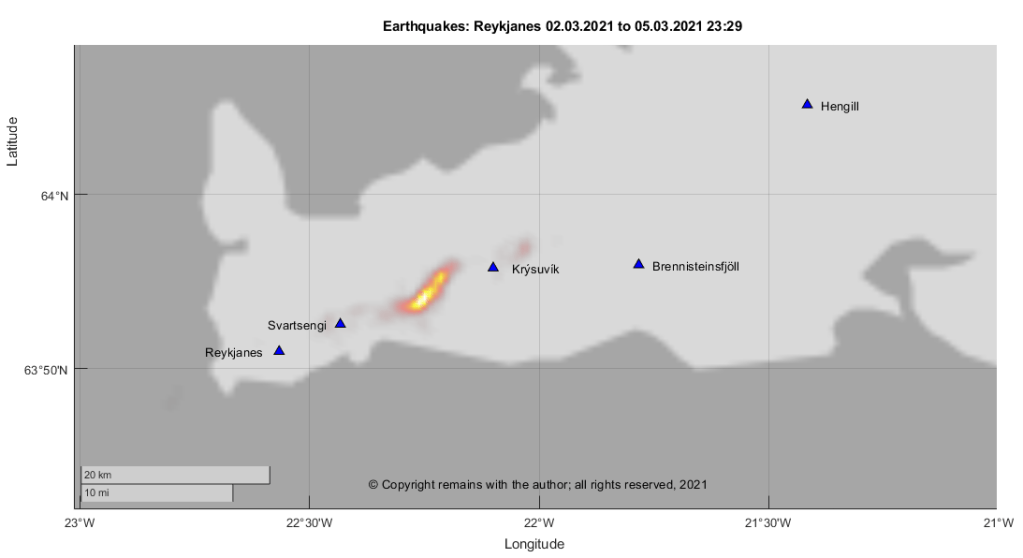
Update 05.03.2021 23:29
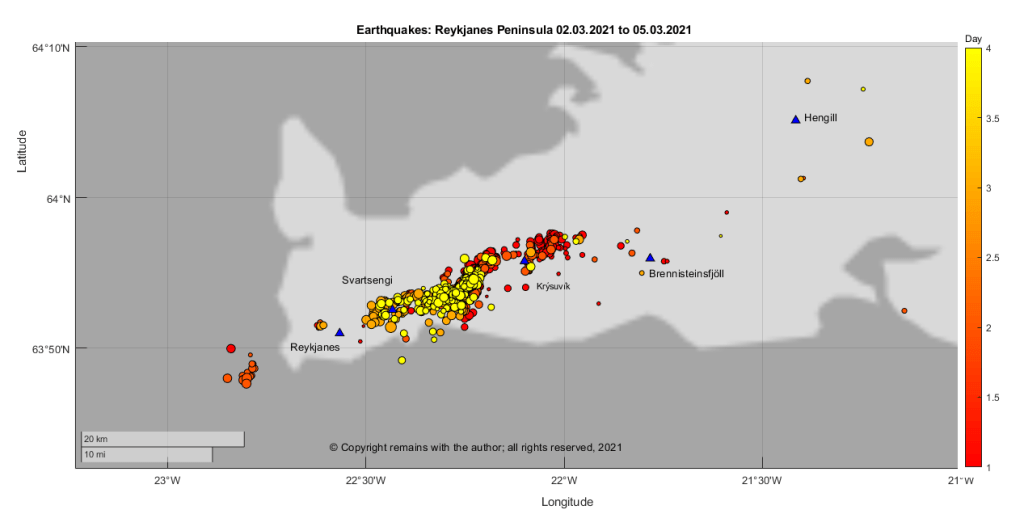
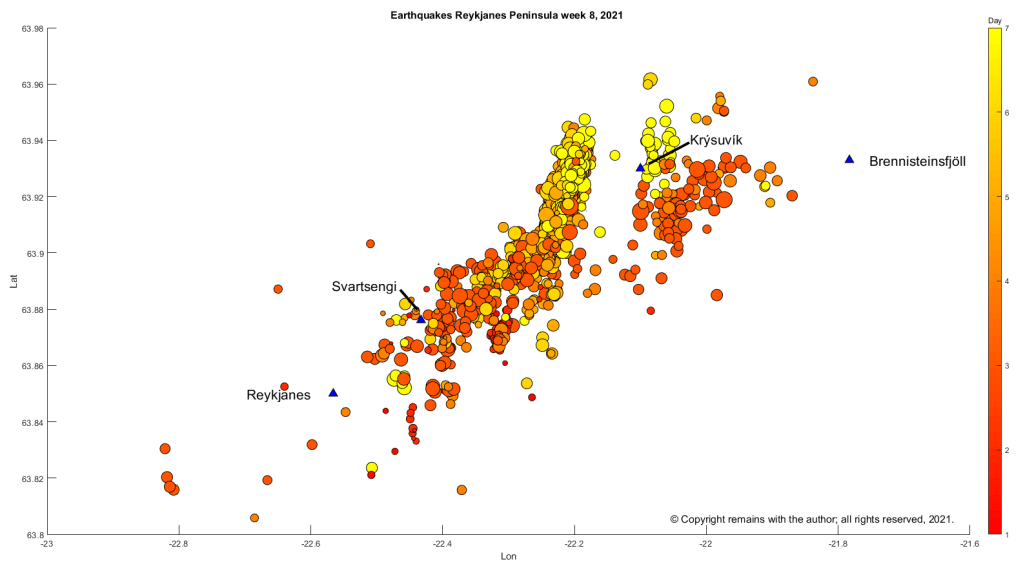
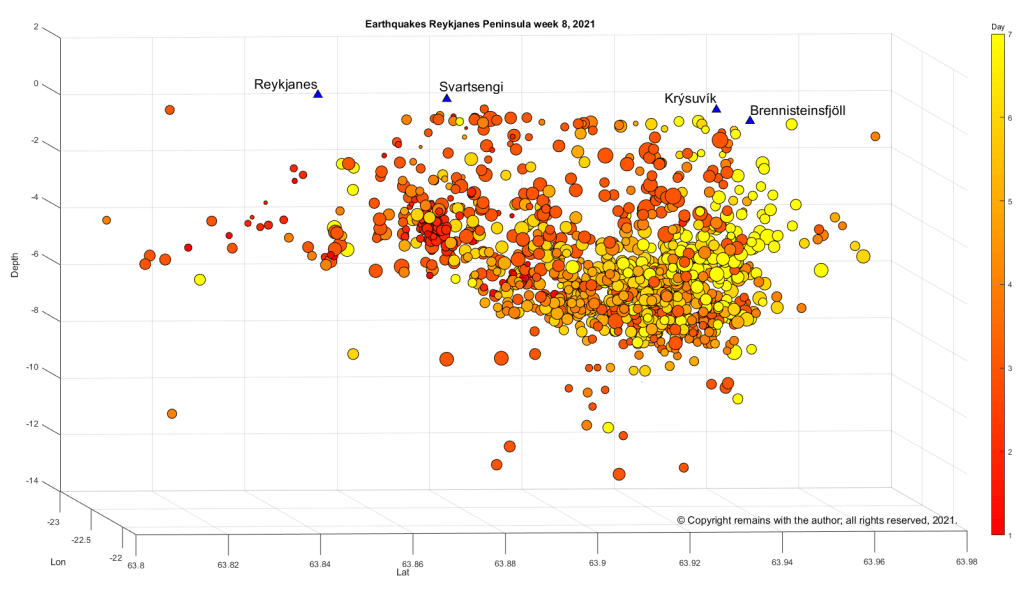
We have plotted the earthquakes with a quality of 99.0 from IMO’s page showing the earthquakes for the last 48 hours for the Reykjanes Peninsula for the period 2 March 2021 to 5 March 2021 (23:29) (we were too slow to capture 1 March 2021). Here are the results. Colour coding in the scatter plots is by day and size reflects magnitude. The geodensity plot is weighted by magnitude.
28 February 2021 (updated 2 March 2021 with the addition of earthquake plots showing rifting / dike formation)
Good Evening!
A large earthquake swarm started on 24 February 2021 on the Reykjanes Peninsula in the vicinity of the Krýsuvík volcanic system between Kleifarvatn and Svartsengi. At the time of writing the swarm is still ongoing with over 7,200 earthquakes record by Iceland’s SIL system. Three earthquakes of 5.0M or more have been recorded: 5.7M and 5.0M on 24 February and a 5.2 on 27 February 2021.
The alert level for the Krýsuvík volcanic system has been raised to yellow following sightings of steam jets in geothermal areas in the region after the 5.7M and 5.0M.
The Icelandic Met Office have attributed this swarm to the recent re-awakening of volcano-tectonic activity on the Peninsula.
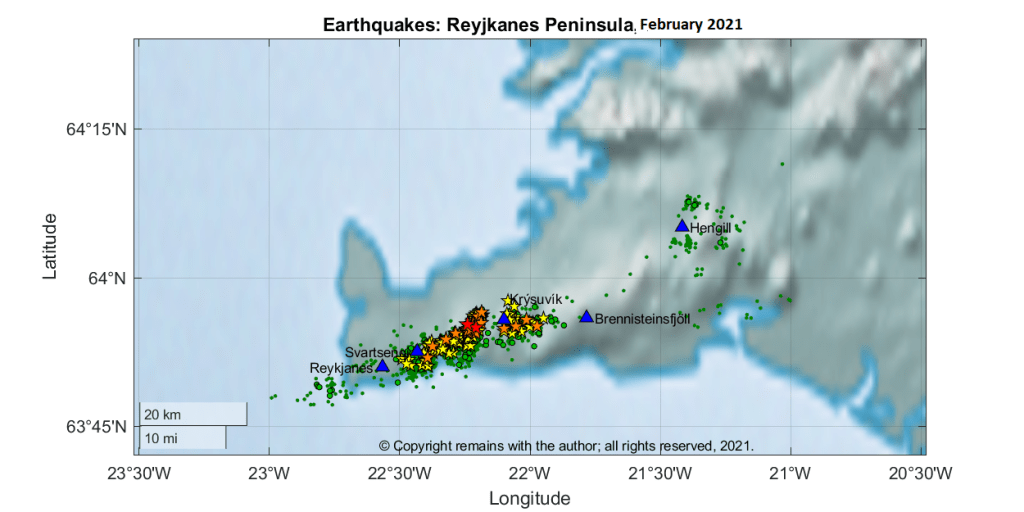
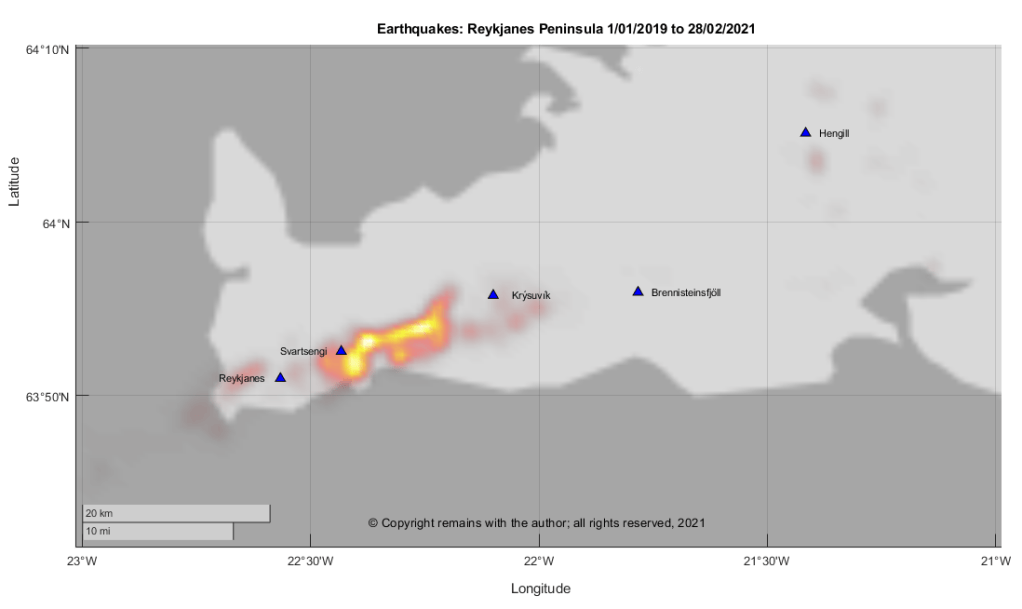
We downloaded the confirmed earthquakes from IMO’s site to take a look. We plotted earthquake density for Week 8, 2021, earthquake locations for February 2021 and earthquakes by month from January 2009 to February 2021.
From our plots we can see the awakening of the volcano-tectonic activity with the upkick in number of earthquakes from December 2019. The current swarm is part of this activity.
At the time of writing, it is not possible to predict whether or not this activity will result in a local eruption in the near future. Only time will tell.
Update 1 & 2 /03/2021
Since writing the swarm has continued, with more than 15,000 earthquakes since it began last week.
The Department for Civil Protection has advised on 1 March 2021, that satellite images show deformation in the area has increased more than expected, indicating possible magma inflow.
We can see from the local GPS stations that there has been significant uplift near Krýsuvík.
Fig 5: Composite GPS plots for KRI, SENG and THOB.
We have also produced scatter plots by day for the swarm in week 8, 2021 which show possible rifting or dike formation.
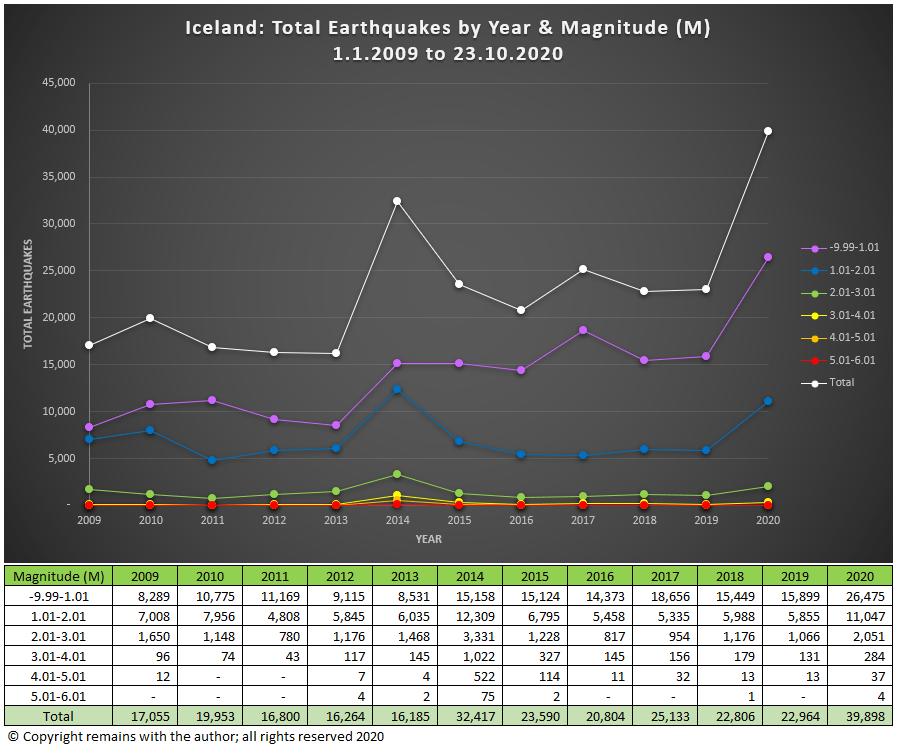
While we are waiting to see if there is any volcanic activity at Grímsvötn or her neighbours, let’s take a look at how the current seismic activity in Iceland compares to previous years.
Our database, comprised of earthquake data downloaded from IMO (see Sources below), now goes back to 29 December 2008 and extends to 23 October 2020, although we may reupload the last week soon because IMO may have been in the process of updating the record when we downloaded the data.
From our graph, we can see that the total number of earthquakes was up in 2010, 2014, 2017 and 2020. In 2010, Eyjafjallajökull erupted, in 2014, Barðarbunga erupted at the Holuhraun fissure; in 2017, there was no subaerial volcanic activity, although Katla may have had some subglacial activity, and, in 2020, there is rifting both in the Reykjanes Peninsula and Tjörnes Fracture Zone but we have yet to see what, if any, volcanic activity emerges. Interestingly, the 2011 eruption of Grímsvötn did not push the total earthquakes up in 2011.
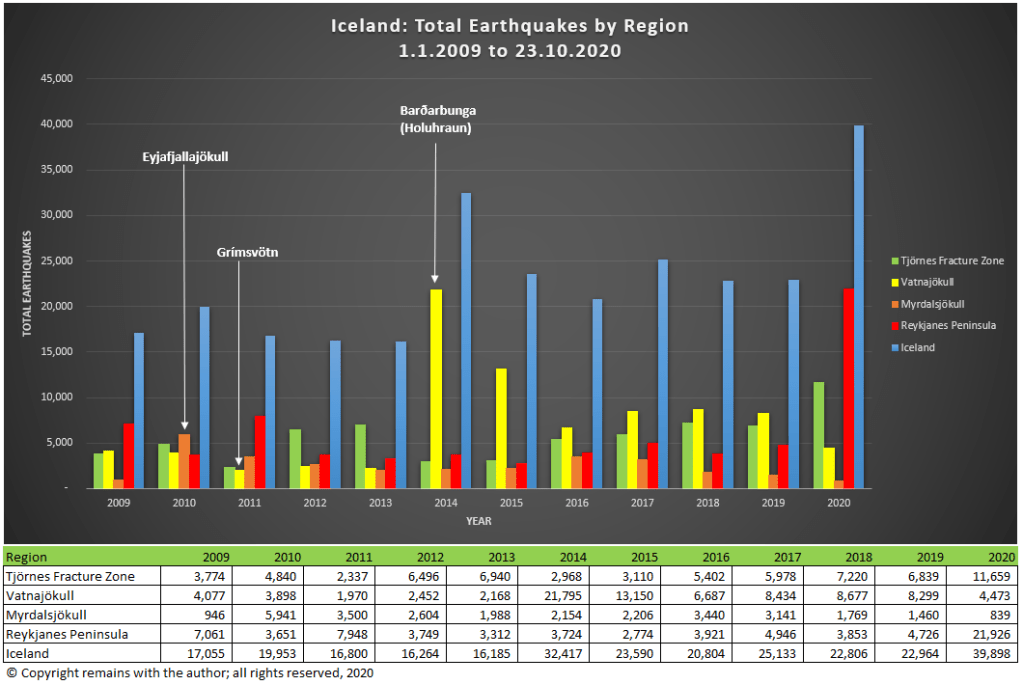
Let’s take a look at activity by region. Here we look at the four main volcanic regions: the Tjörnes Fracture Zone, Vatnajökull, Myrdalsjökull and the Reykjanes Peninsula, where there is most seismic activity.
Fig 2: Iceland Total Earthquakes by Region and Yearby the author, using data downloaded from IMO (see Sources below). Note: not all regions
We see that the eruption of Eyjafjalljokull increased the number of earthquakes in Myrdalsjökull but not to the extent that the eruption of Barðarbunga at the Holuhraun fissure and subsidence in the caldera pushed up the earthquakes for Vatnajökull in 2014 and subsequent years. In fact, the total number of earthquakes in all regions, except Myrdalsjökull, has remained elevated since Holuhraun.
Our database does not extend back far enough to draw any firm conclusions, however, it would appear that rifting events such as Holuhraun produce far more earthquakes than volcanic activity on its own.
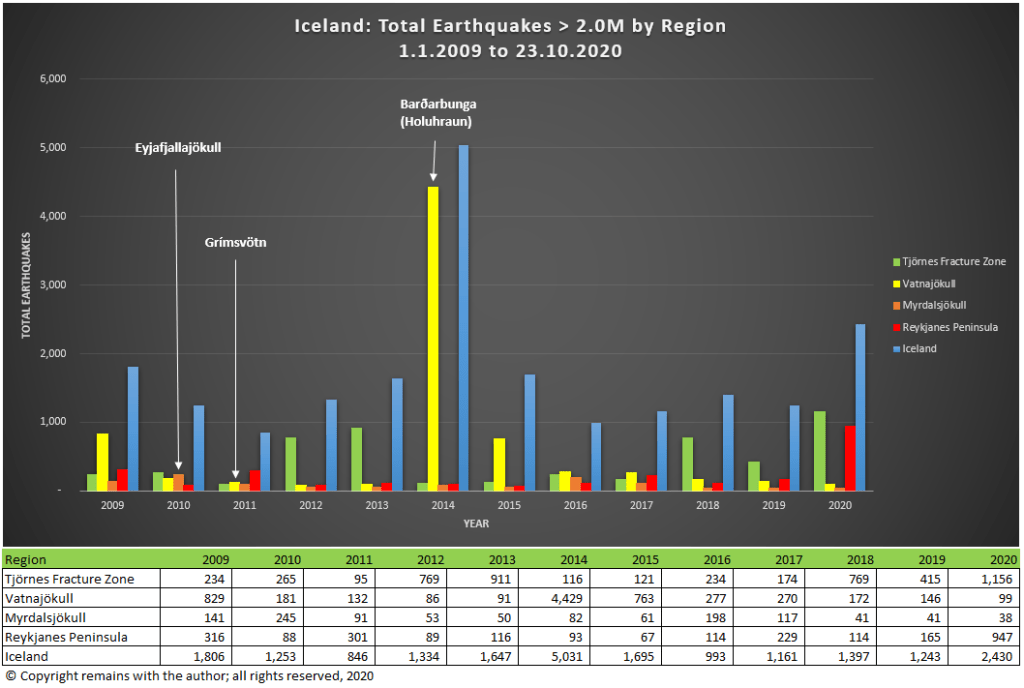
Tjörnes Fracture Zone and on the Reykjanes Peninsula
This rather begs the question as to what is happening this year with the large earthquake swarms both in the Tjörnes Fracture Zone and on the Reykjanes Peninsula. Unless our database does not go back far enough, neither the 2011 Grímsvötn nor the 2014 Barðarbunga eruption was preceded by such large earthquake swarms in other regions.
The fact that there is significantly raised activity this year in both regions suggests to us that we may be witnessing the normal plate separation on the Mid Atlantic Ridge (it is not entirely smooth), possible local magma ascent, and / or the plates accommodating an ascending blob of magma from the mantle plume, which is believed to be under the Vatnajökull icecap. There is ground deformation at several spots under the Vatnajökull icecap which points to magma ascent.
IMO have reported that there could be a magmatic intrusion at depth on the Reykjanes Peninsula; this is supported by ground deformation.
Gas measurements, ground deformation and recent seismic activity at Grímsvötn (not enough to show in our graphs but above the background levels for the volcanic system) have led to the Icelandic authorities to consider that an eruption is possible there in the not too distant future and to raise the alert level a notch (see earlier article).
It is too soon to tell whether or not the rifting events, themselves, will result in eruption(s); it is possible that it is just a coincidence that we are seeing two large rifting events at roughly the same time – both areas are seismically active. Time will tell.
The Icelandic Met Office (IMO) has updated the aviation alert for Grímsvötn from green to yellow today (30.09.2020) because the volcano’s activity is above background level, now at a level comparable to that which preceded previous eruptions. They note:
Above average seismicity for September 2020;
Deepening cauldrons in the ice-cap round the caldera from geothermal activity;
Surface deformation exceeding that which preceded the 2011 eruption;
Magmatic gases detected in the summer of 2020.
An eruption is not considered imminent.
Water levels in the sub-glacial lake are high indicating possible jökulhlaups in the coming months. Draining of the lake by a jökulhlaup depressurised the system before the 2011 eruption, so an eruption is considered possible in the event of a jökulhlaup.
Activity may decrease without an eruption in this instance; only time will tell.
Jumping the gun a bit on our next post in the volcanic risk mitigation series, the IMO’s alert is an example of using alert levels to highlight the increased risk of an eruption to those who need to know, without being unduly alarmist – a straightforward statement of the facts supporting the current status. For the exact wording of the alert, please follow the link below.
Fig 1: Eruption column 3 hours after the onset of the 2011 eruption of Grímsvötn. Source: Sigurjónsson, O. (2011 May 21). Grímsvötn: photo 10 of 14. Retrieved from http://icelandicvolcanoes.is/?volcano=GRV
Grímsvötn is located under the Vatnajökull ice-cap in an active rift zone of the Eastern Volcanic Zone, Iceland. She erupts frequently; her last in 2011 was a large VEI 4, which impacted local farmers and livestock and aviation in Europe.
Update (02/10/2020)
Googling around a bit more, I note that Iceland’s Department of Civil Protection and Emergency Management, Almannavarnir, have reported in their 25 September 2020 bulletin that an eruption is considered likely this Autumn (use Google Translate or other tool, if you need to, as it is in Icelandic).
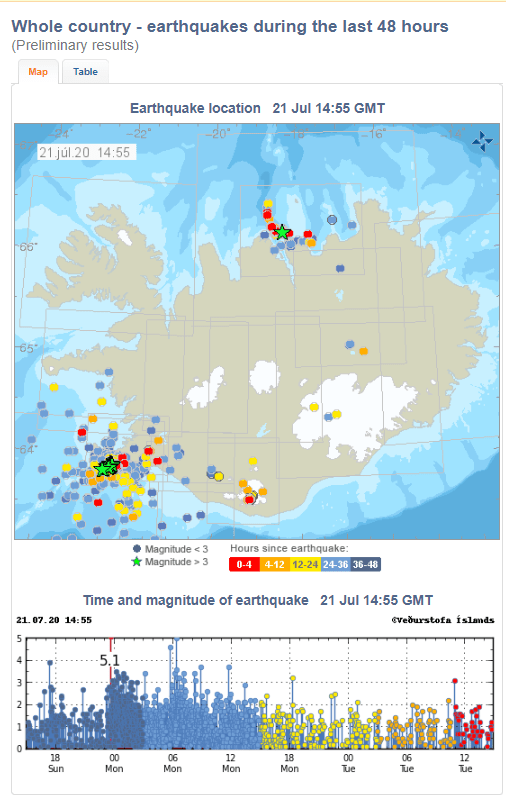
A large earthquake swarm started on the morning of 19 July at around 1:30 am at Fagradalsfjall on the Reykjanes Peninsula. The largest earthquake had a magnitude of 5.1M. At the time of writing, there had been 1,635 earthquakes in the last 48 hours recorded on IMO’s website (note that not all of these have been confirmed). IMO’s map and breakdown of the swarm are shown below:
Fig 1: Map of earthquakes in Iceland over the past 48 hours. Source: IMO
Close up of the Reykjanes Peninsula:
Fig 2: Map of earthquakes in the Reykjanes Peninsula over the past 48 hours. Source: IMO
Magnitude
Number
< 1.0
720
1.0-2.0
723
2.0 -3.0
162
>3.0
30
Fig 3: Breakdown of earthquakes by magnitude
This swarm is occurring on the east side of the swarms on the Reykjanes Peninsula which started late last year. IMO have reported that these swarms (still ongoing) are associated with multiple magma intrusions. The aviation code for the area is still green (IMO). IMO are in the process of evaluating the Fagradalsfjall swarm.
The swarm at the Tjörnes Fracture Zone is still ongoing.
The eagle-eyed amongst you will note that there is some seismic activity at Katla. Whether this will result in anything is anyone’s guess at the moment.
We have not yet updated our earthquake data-set for the current swarm. We will wait until IMO has had a chance to confirm more earthquakes
Update 24 July 2020
The swarm at Reykjanes is now less intense. In the meantime, Katla produced a shallow 3.0 M. IMO have remarked that earthquakes in the summer at Katla are not uncommon.
From memory, Katla was seismically active before the intense swarms started in August 2014 at Barðarbunga in the run up to the eruption at Holuhraun. This may have been a coincidence.
Fig 4: Map of earthquakes in Iceland over the past 48 hours. Source: IMO


