Good evening
Update 17/11/2023 17:30
The earthquake swarm is continuing as we write, although he magnitude of earthquakes has reduced. As the uncertainty continues, our thoughts are with those required to evacuate Grindavík, those supporting them, the Department of Civil Defence, and the scientists and others monitoring the activity.
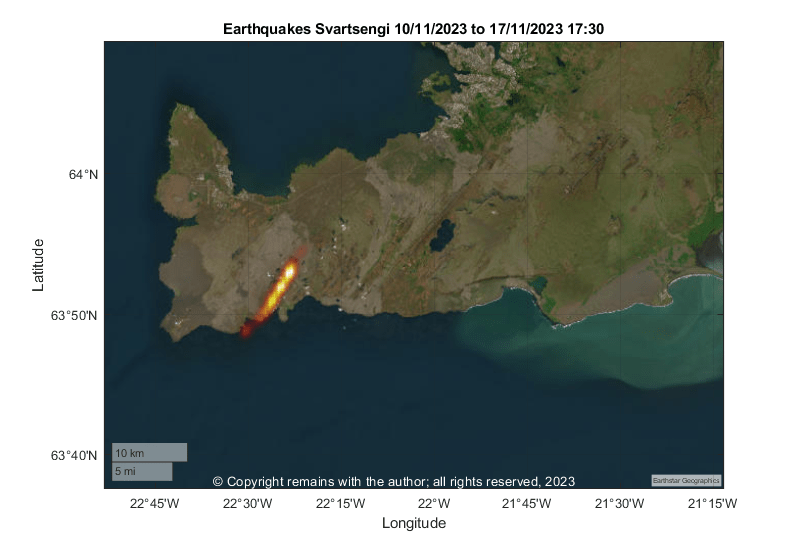
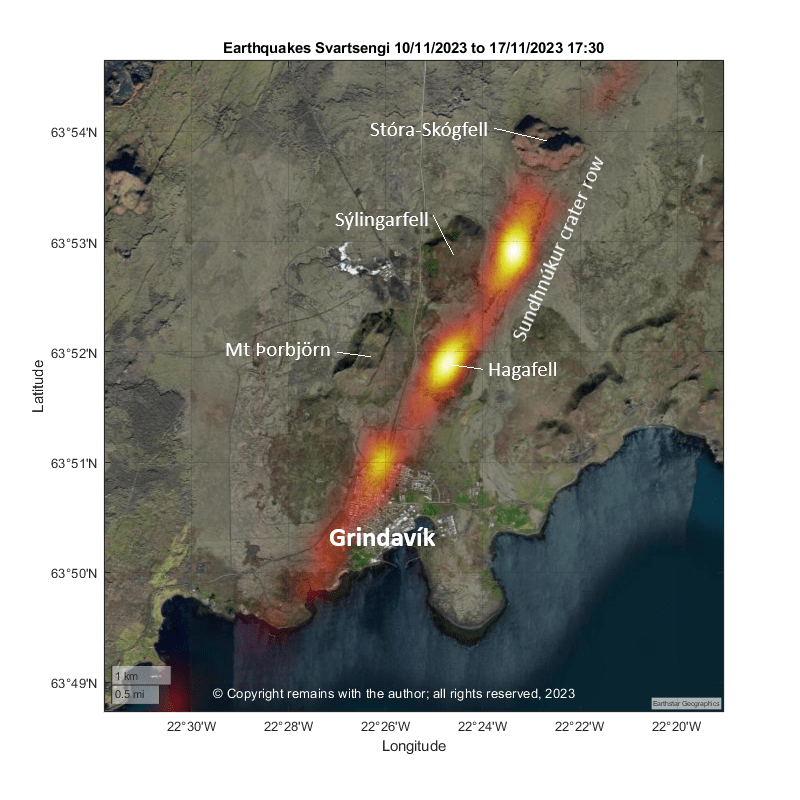
According to IMO, ground deformation is continuing at a slower rate. It is thought that if an eruption occurs, it is most likely to be in the region of Hagafell. Yesterday, sulphur dioxide was detected in a borehole at Svartsengi located north of Mt Þorbjörn. The borehole extends eastwards towards the Sundhnúkur crater row, close to the where the magma intrusion is. This is considered evidence of magma north of Hagafell. The possibility of an eruption is still considered high.
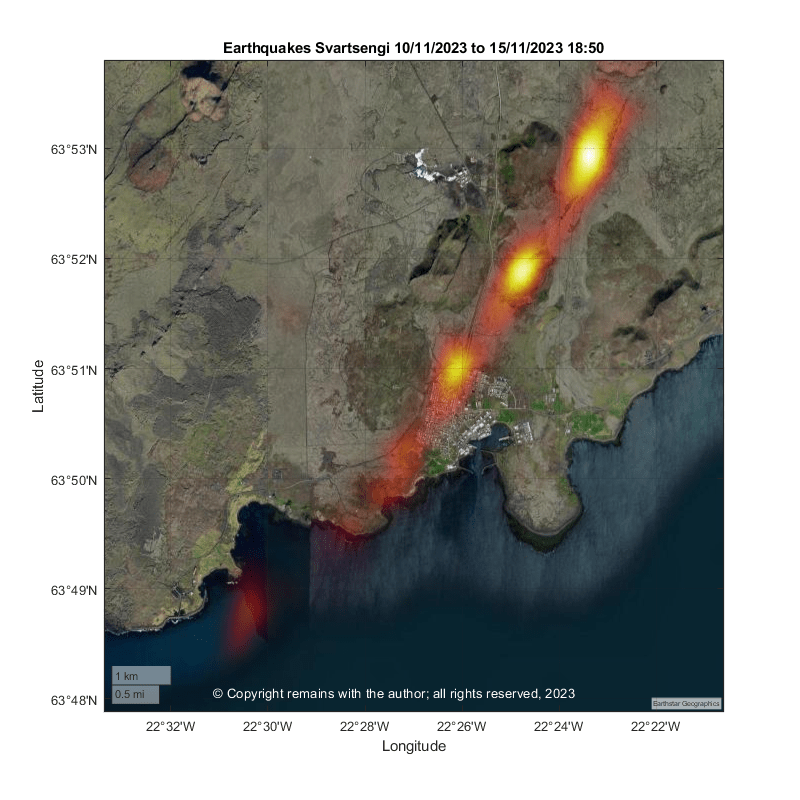
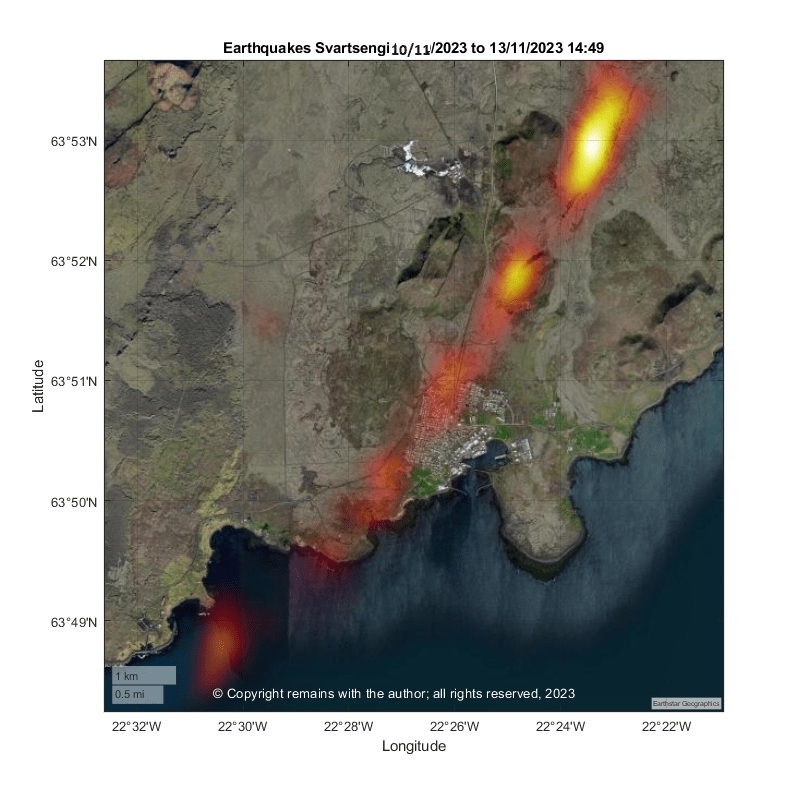
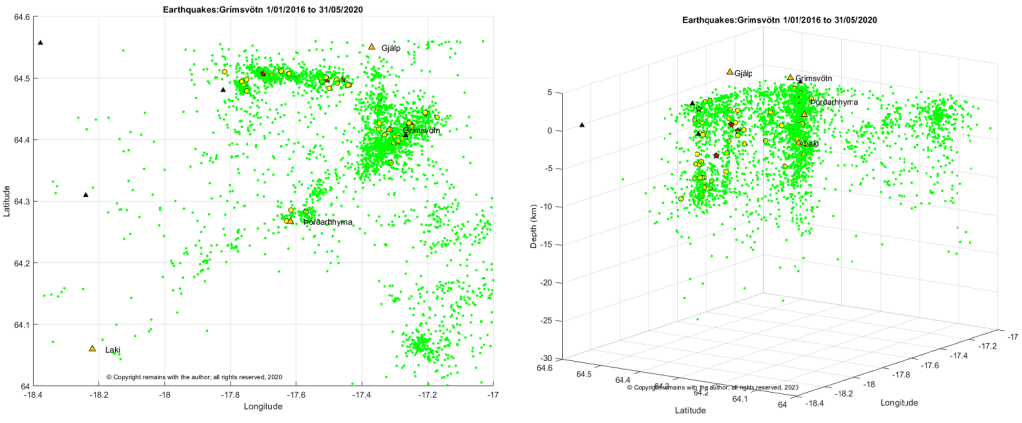
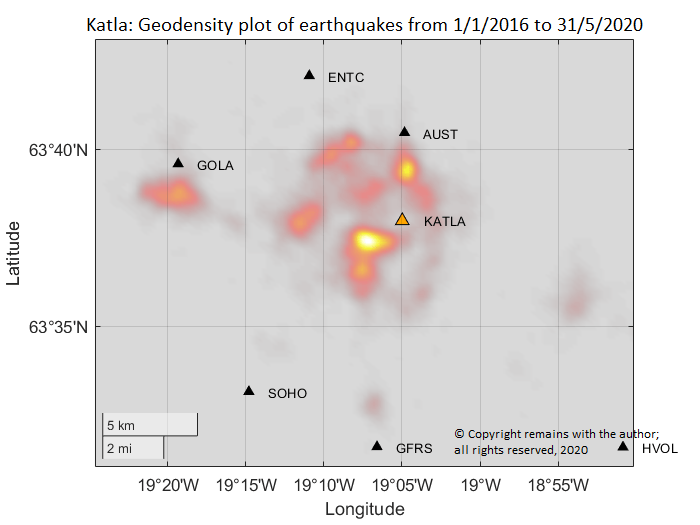
If we ccompare the locations to our geodensity plots (ref. Fig 31 below), the areas of most seismic activity are located at the Sundhnúkur crater row, Hagafell and northwest Grindavík. The geodensity plots are often good predictors of where an eruption will occur. However, with three current seismic hot spots, the situation is not clear at the moment. If an eruption occurs, the precise location(s) will depend on where weak spots allow magma through.
Our updated earthquake plots are below. The data source is as below.
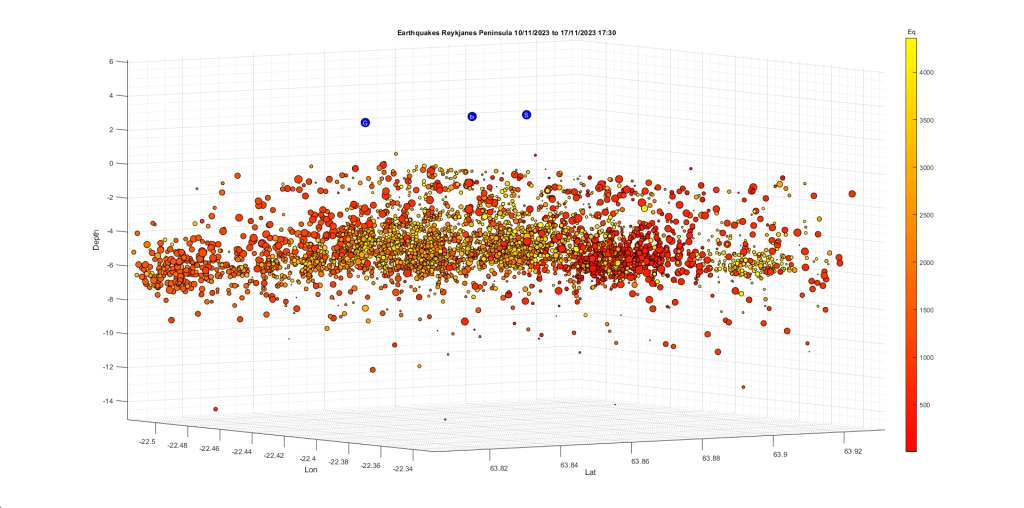
Seismic activity is occurring along the dike and also at Krýsuvík.
Reykjanes Peninsula
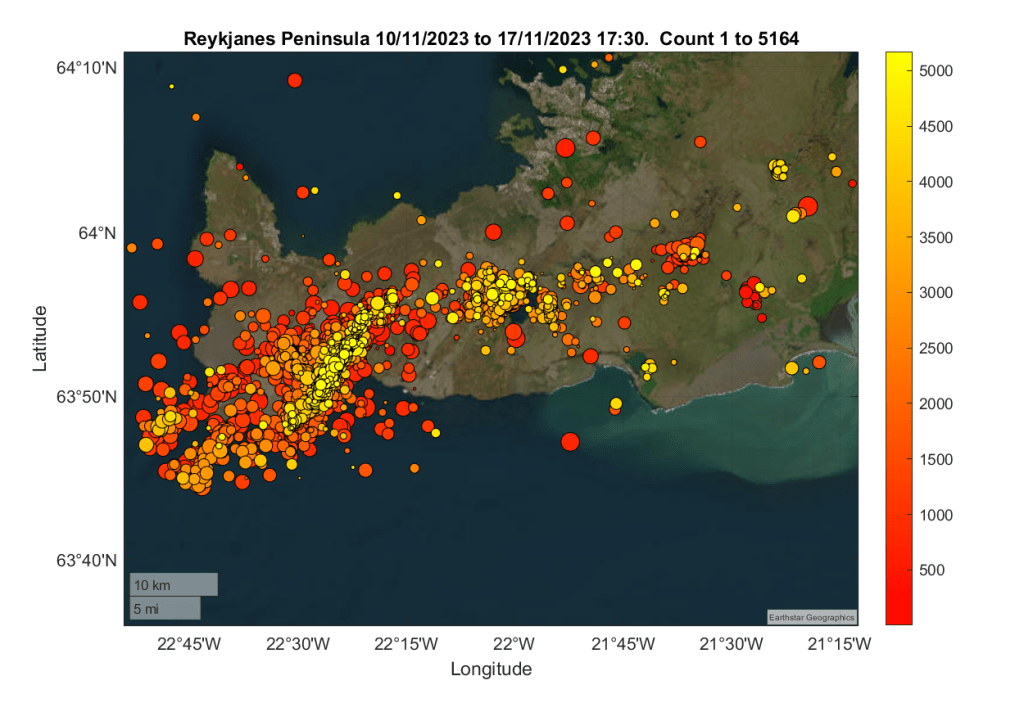
Area 63.746°N, 22.631°W to 63.996°N, 22.211°W
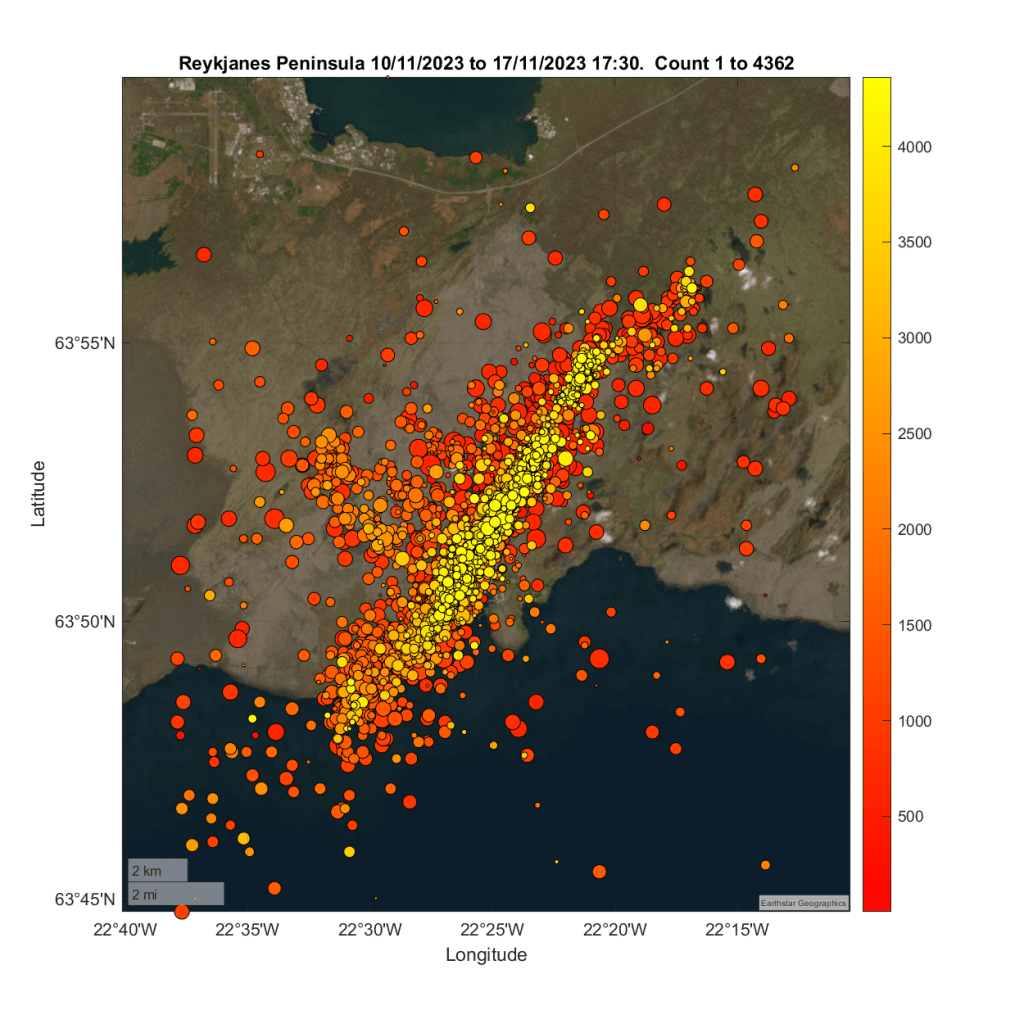
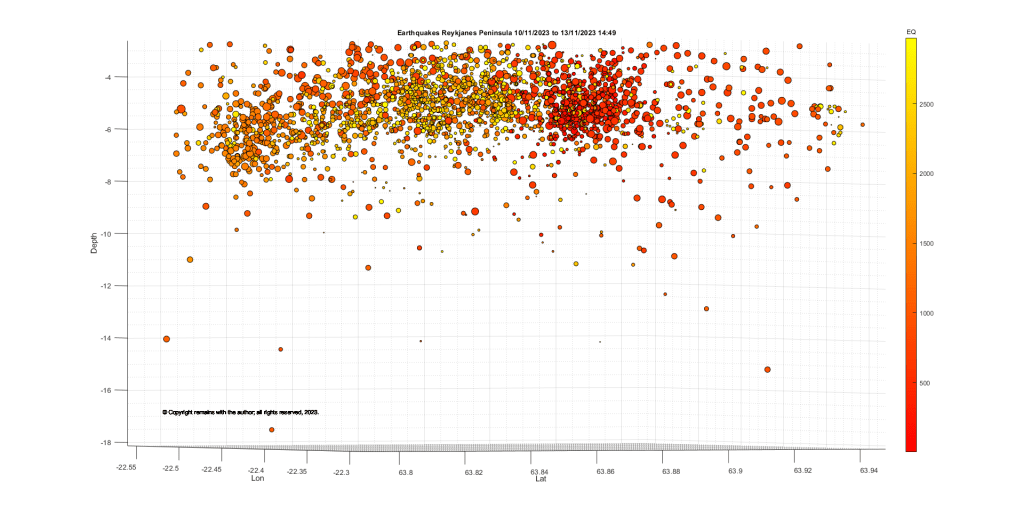
These show the activity near the dike in more detail.
For more recent updates, please consult the relevant authorities, such as IMO.
Armchair Volcanologist
© Copyright remains with the author; all rights reserved, 2023
Sources as below.
Update 15/11/2023 18:50
The earthquake swarm continues as we write. The intensity has lessened, and the size of the earthquakes decreased. The probability of an eruption is still considered high.
According to IMO, most monitoring is focussing on the dike formation and Grindavík. Ground deformation is consistent with magma flowing into the dike. Part of the magma may be solidifying at the edges of the dike. Magma inflow is thought to be near Sundhnúk. SO2 measurements show fluctuating degassing associated with the dike. Magma may have come within 500m of the surface. The sink hole which opened in Grindavík continues to widen.
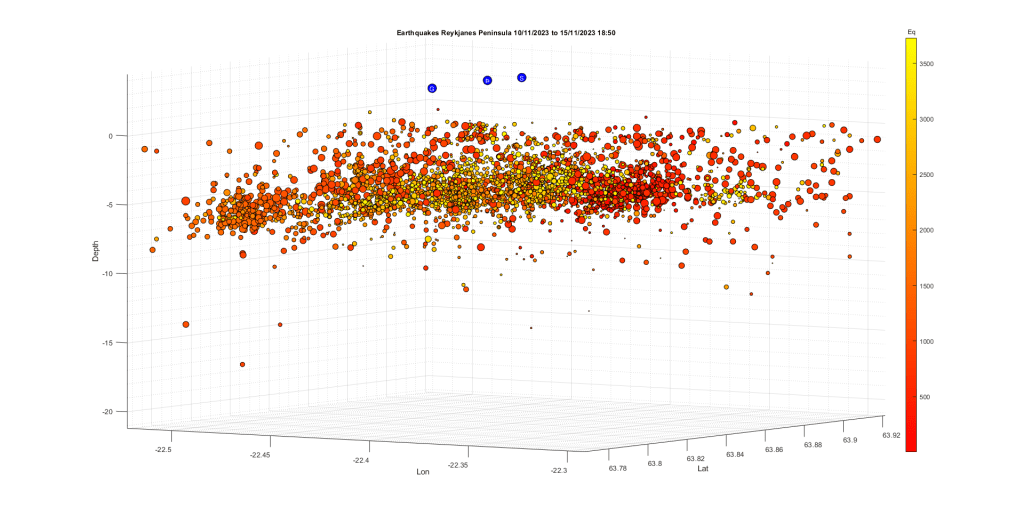
We have updated our earthquake plots to 18:50 today.
The most recent earthquakes occur along the dike, and at Krýsuvík. We do not understand the relationship between Fagradalsfjall and activity further west, other we have observed than activity at Krýsuvík usually precedes activity west of it. Frustrating not to be a geologist!
Plots for the Reykjanes Peninsula
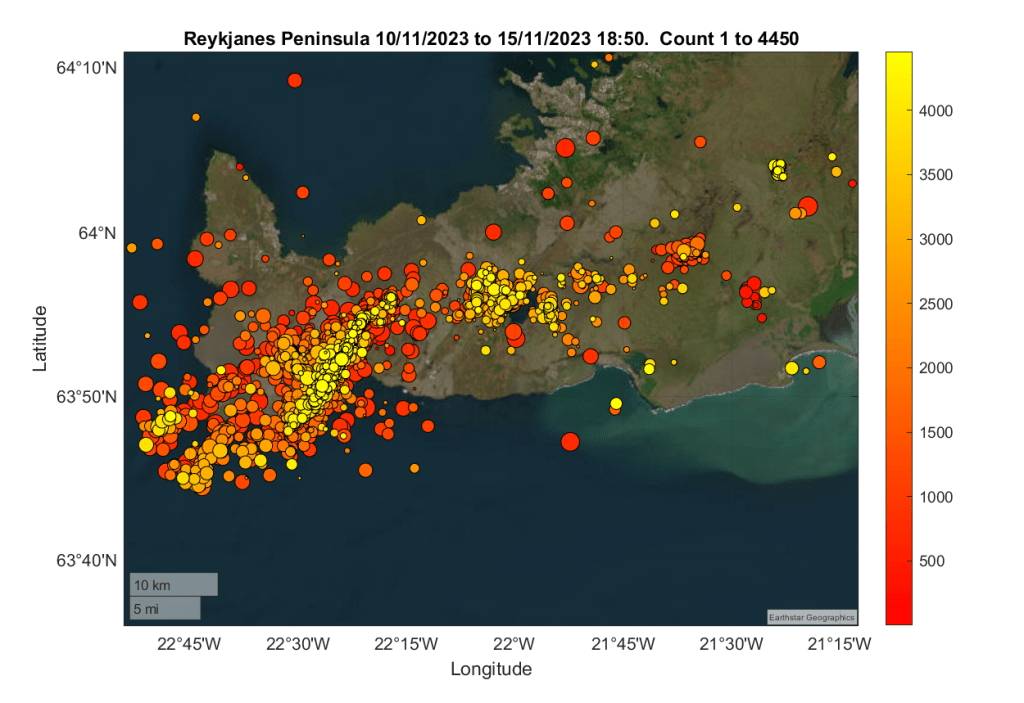

Plots for the area 63.746°N, 22.631°W to 63.996°N, -22.211°W
These show the activity near the dike in more detail.

For more recent updates, please consult the Icelandic authorities, such as IMO (link below).
Armchair Volcanologist.
© Copyright remains with the author; all rights reserved.
Sources: information and raw earthquake data, Home-page – Icelandic Meteorological Office | Icelandic Meteorological office (vedur.is)
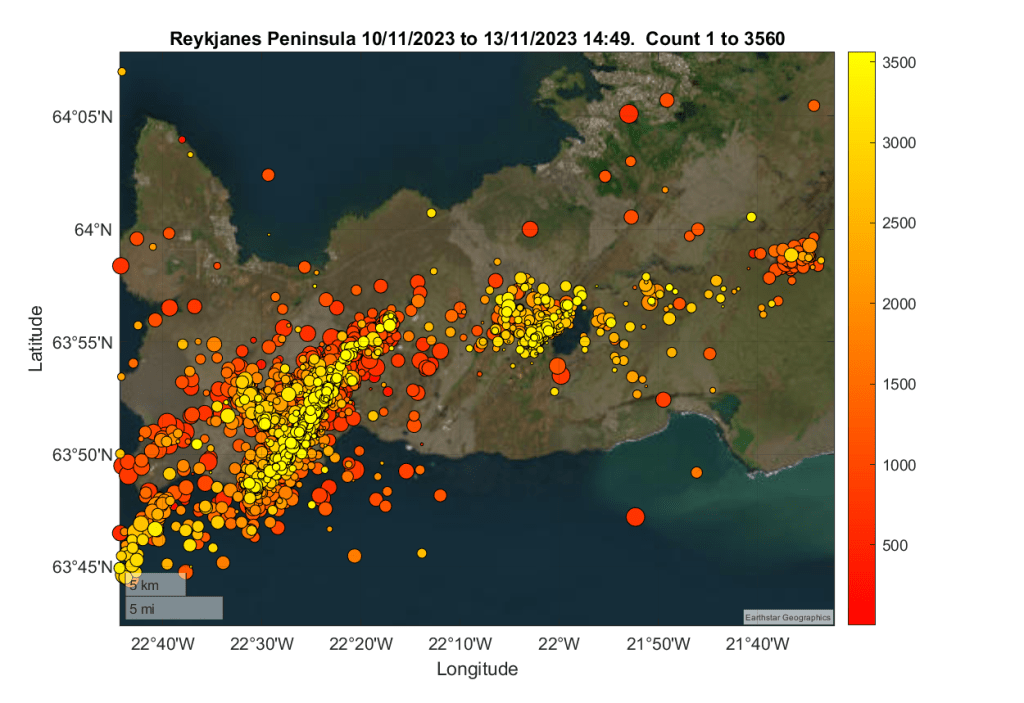
Update 13th November 2023, 14:49
Correction: Fig 20 is for the period 10th November to 13th November (Error was in the image title, not the caption. The plot, itself, is unchanged). Apologies for any inconvenience.
The earthquake swarm continues as we write. The intensity has lessened, and the size of the earthquakes decreased, most probably reflecting the fact that magma has reached less brittle rock layers nearer the surface. Scientists have said the magma inflow has lessened, seismic activity is between depths of 2km and 5km but there is no change in the assessment of the likelihood of an eruption.
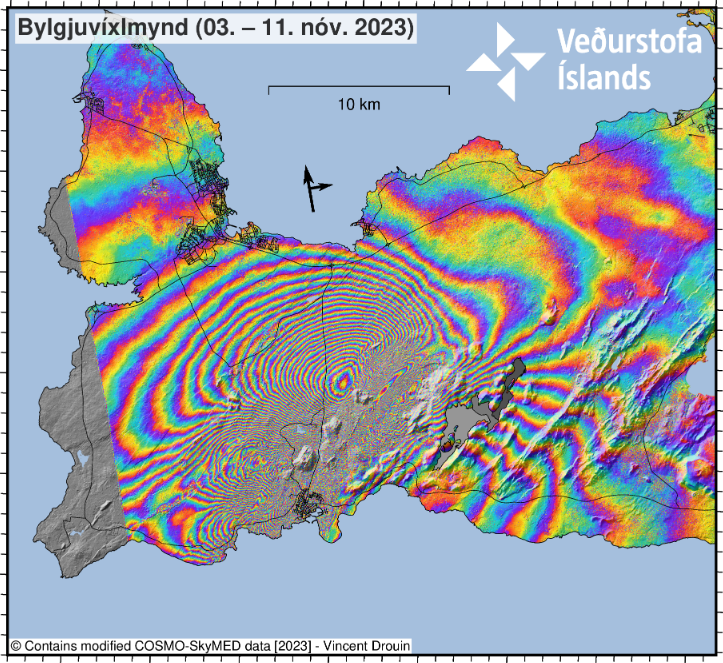
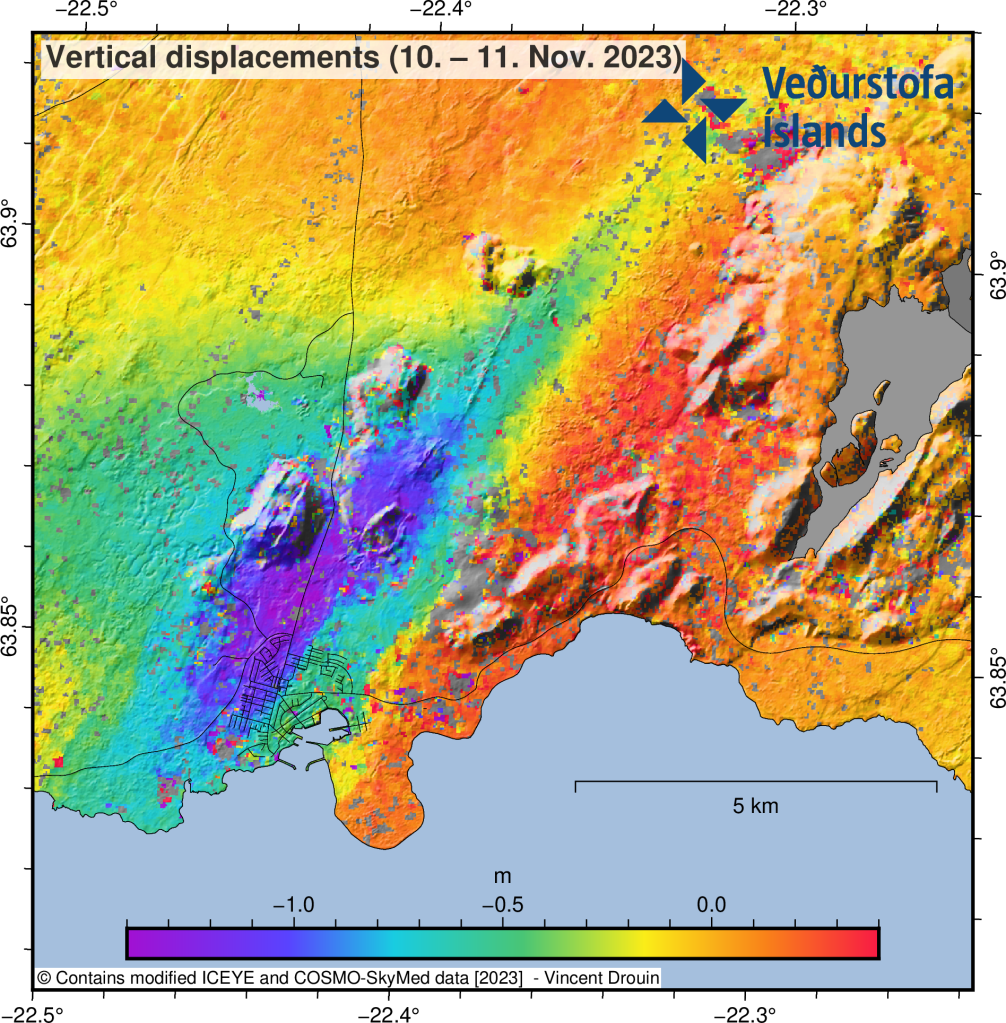
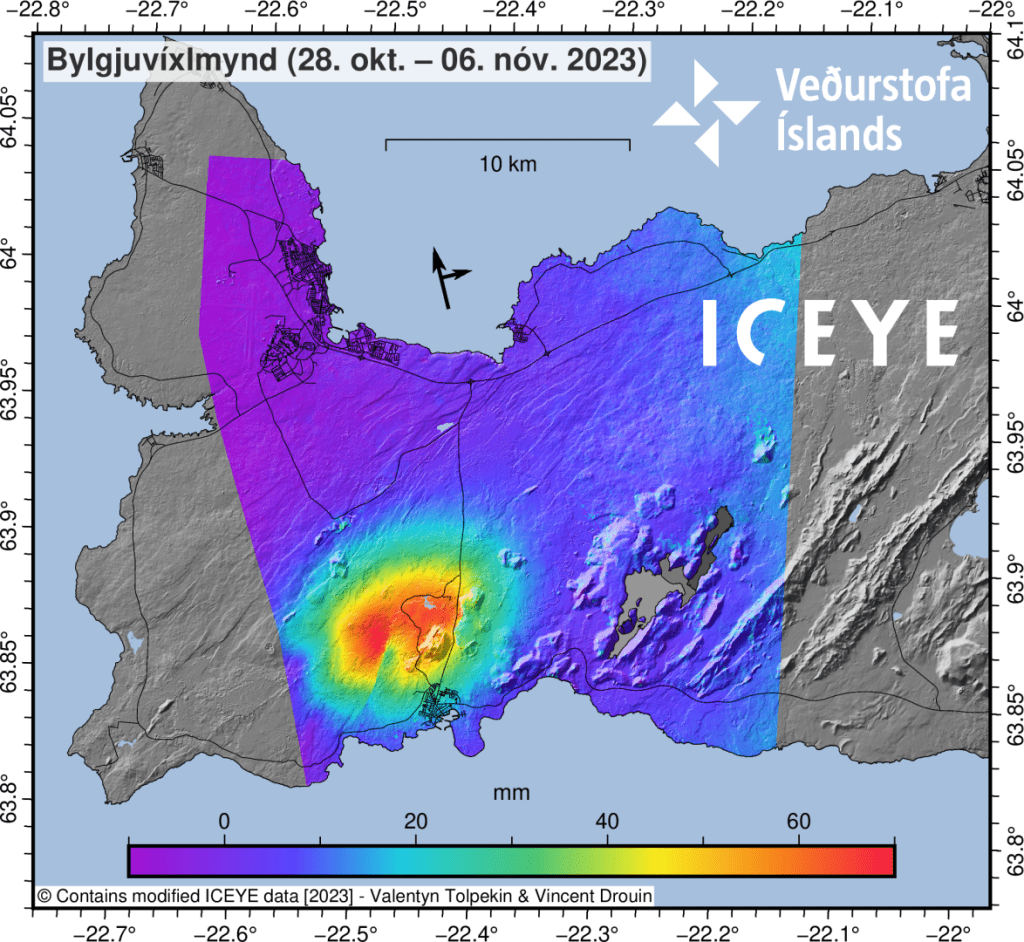
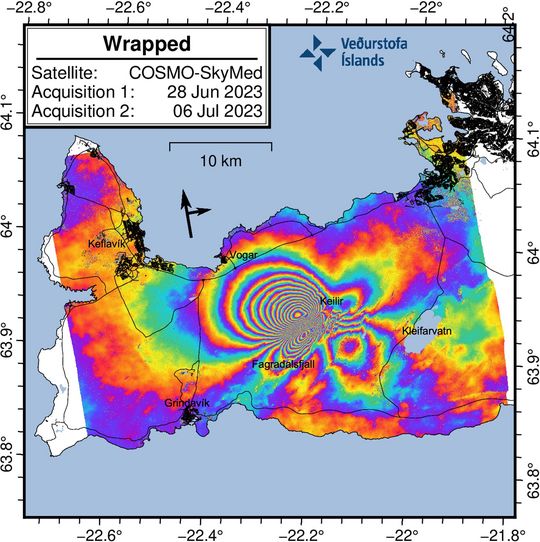
The InSAR image showing the formation of the possible graben running through part of Grindavík has been published on IMO’s site today. The sudden formation of the graben on Friday night led to the evacuation of Grindavík. Local news sources have images of the damage done to roads and property.
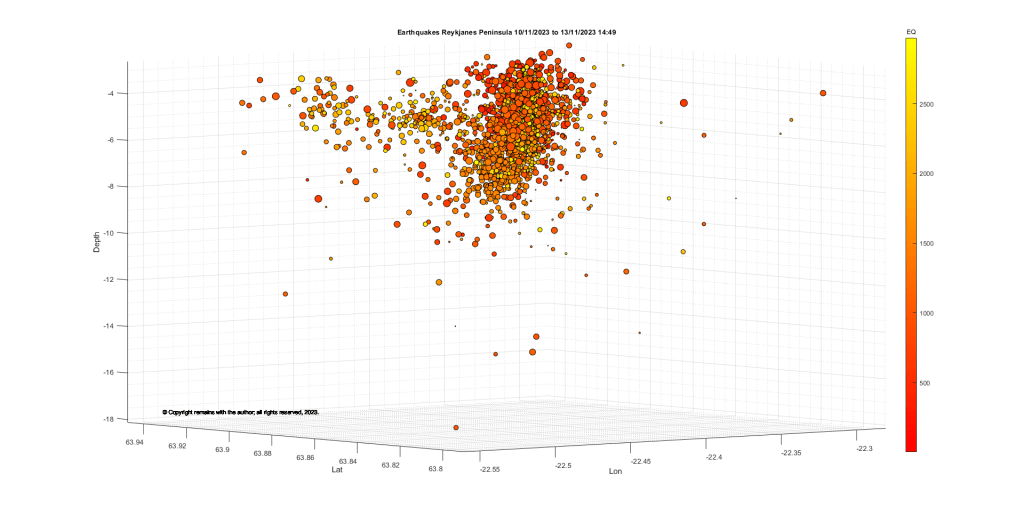
We have updated our earthquake plots for the swarm from 10th November 2023 to 13th November 2023 14:49. We used the earthquakes published on Whole Country (vedur.is) for the Reykjanes Peninsula with a quality of over 90%., a total of 3,560 earthquakes. We may have picked up some ghosts and other errors (confirmed earthquakes have a quality of 99%) but we believe that this will give a rough idea of what is going on.

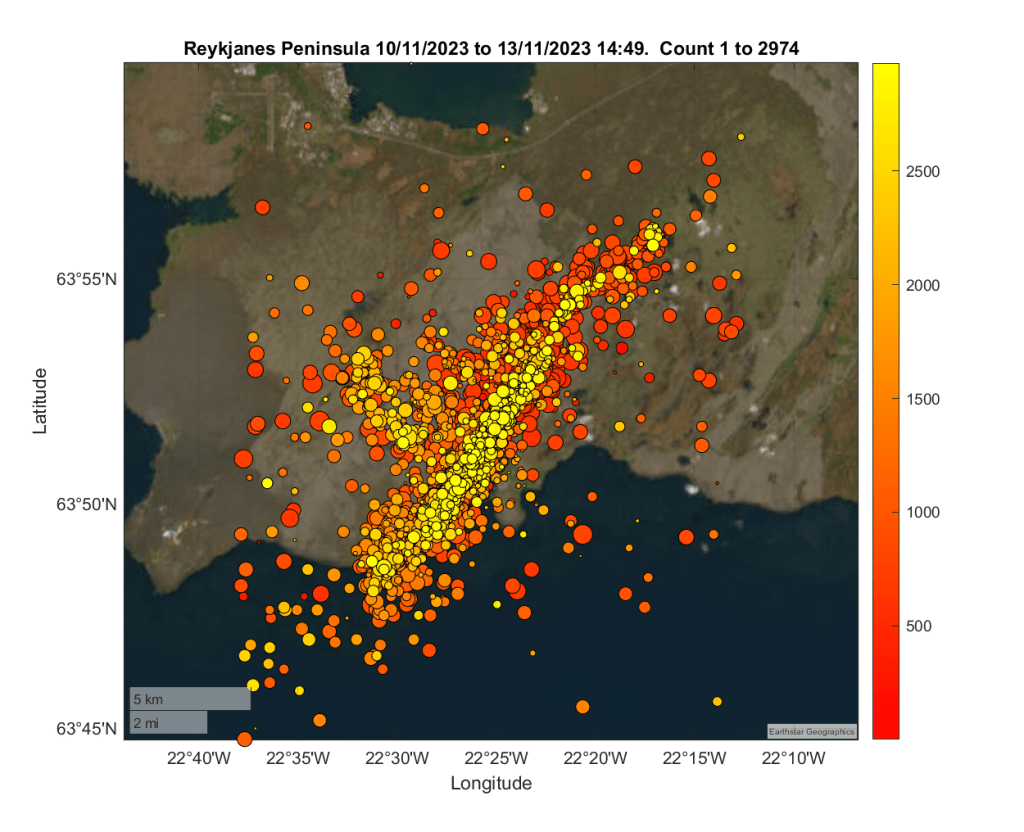
Our 3D scatter plots for the above seismic activity covered too big an area to look at the formation. We extracted earthquakes between 63.746°N, 22.211°W and 63.996°N, 22.631°W, a total of 2,974 earthquakes. For the 3D scatter plots only we removed a small earthquake with a depth of more than 40 km from the data set as it distorted the scale of the plots too much.
For more recent updates, please consult the Icelandic authorities, such as IMO (link below).
Armchair Volcanolgoist
© Copyright remains with the author; all rights reserved.
Source for inform,ation and raw earthquake data: Icelandic Meteorological office (vedur.is)
Update 11th November 2023 ,18:01
IMO reported this evening that there is a significant likelihood of a volcanic eruption in the coming days.
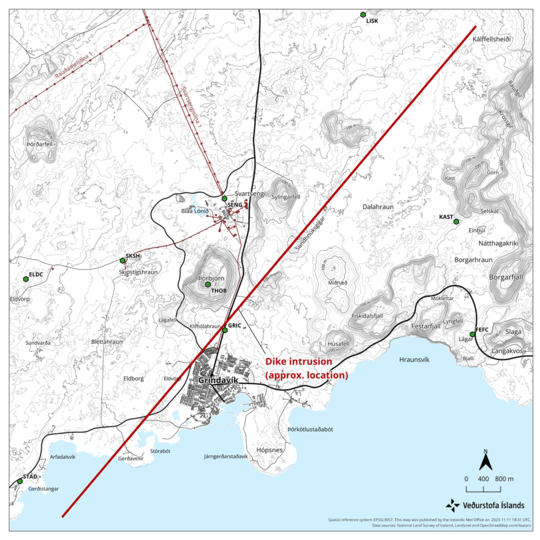
Modelling based on ground deformation and seismicity by scientists at IMO and the University of Iceland shows that there is a 15km long magma intrusion located northwest of Grindavík. The intrusion stretches from Kálffellsheiði, northeast of Grindavík, to offshore southwest of Grindavík.
Magma has ascended to 800m below the surface. Where and when an eruption will occur cannot be predicted now – other than to say that it would most likely be in the vicinity of the intrusion, if it occurs.
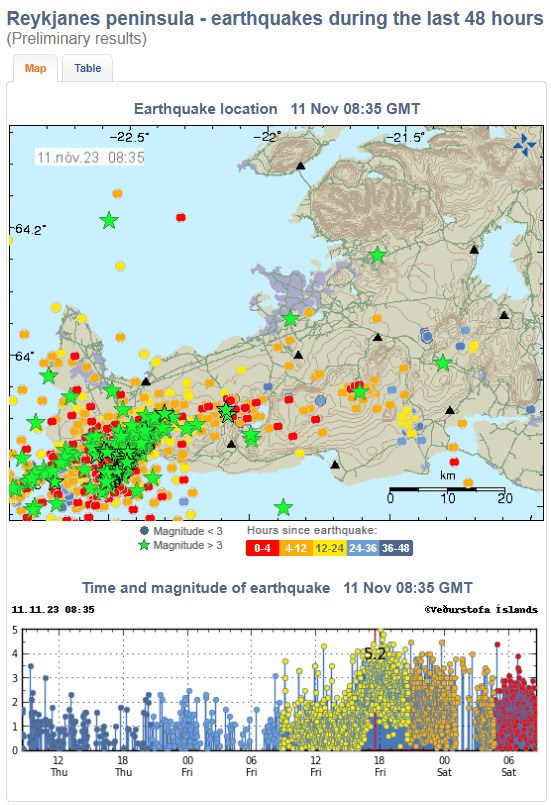
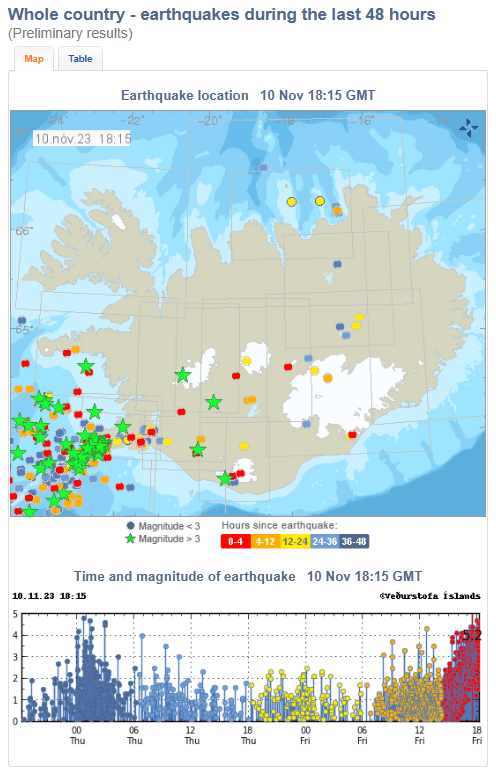
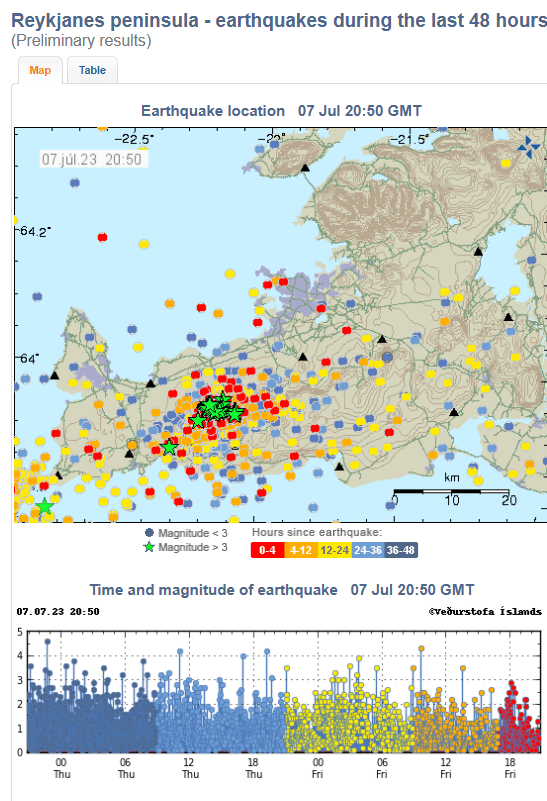
We have updated our earthquake plots for the swarm to 18:01, this time using those with more than 90% quality from IMO’s Reykjanes peninsula – earthquakes during the last 48 hours (Preliminary results) | Reykjanes peninsula | Icelandic Meteorological office (vedur.is). The reduced quality may mean that we have picked up a few ghosts and other errors in the plots but it is reasonable enough to give an idea of what’s going on. A total of 2,334 earthquakes were recorded at the time of our download.
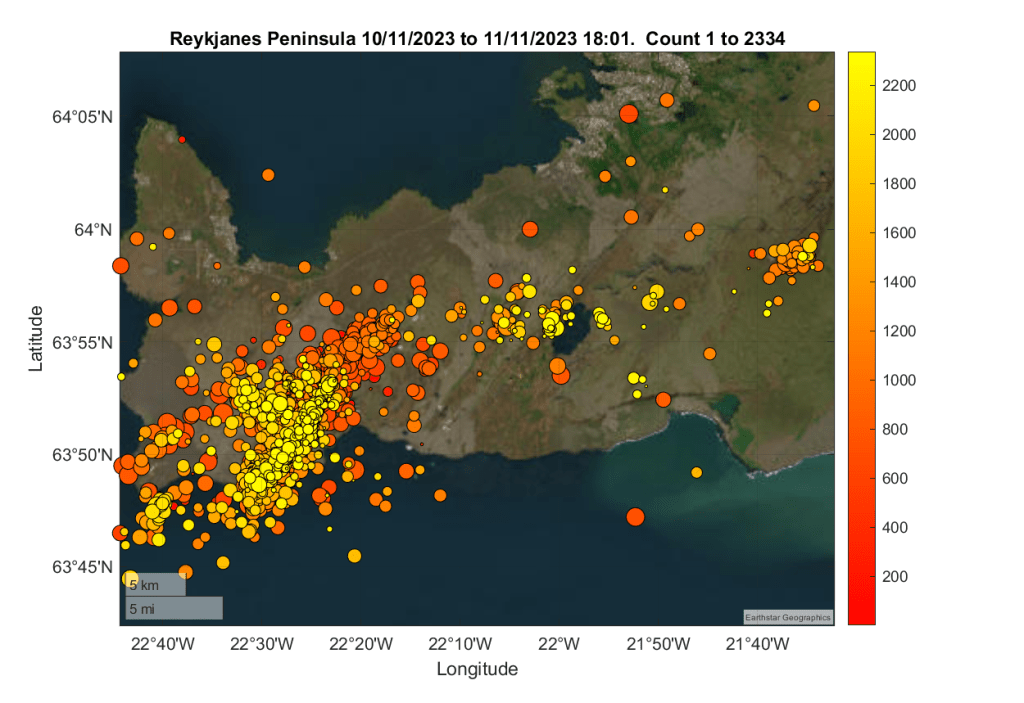
The geoscatter plot has picked up the magma intrusion and faults moving to accommodate the intrusion.
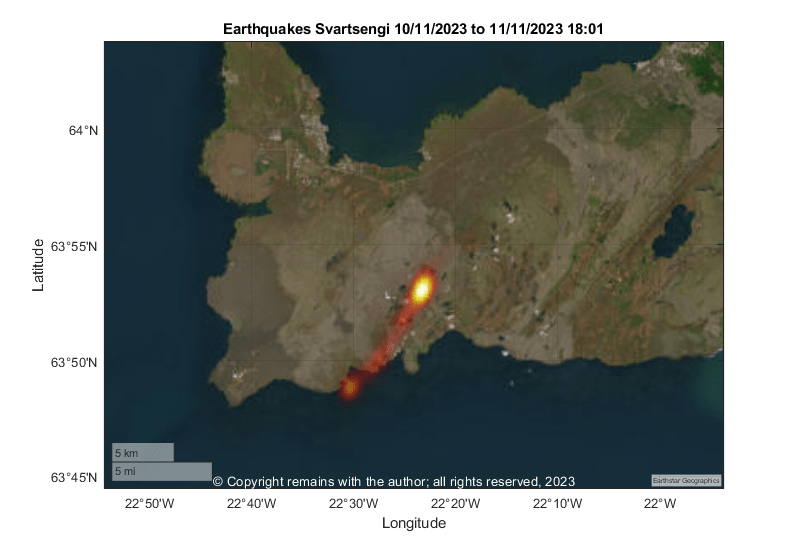
The geodensity plot shows that most earthquake activity occurring is from the magma instrusion.
Armchair Volcanologist
© Copyright remains with the author; all rights reserved, 2023.
Source for the update and raw earthquake data as before: Icelandic Meteorological office (vedur.is)
Good morning
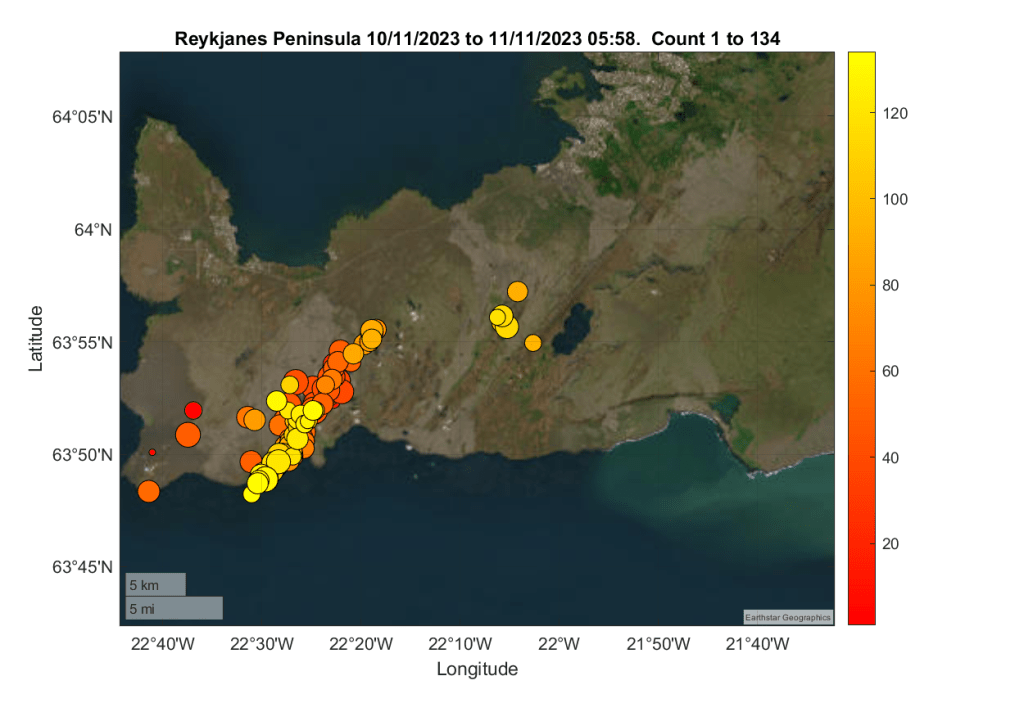
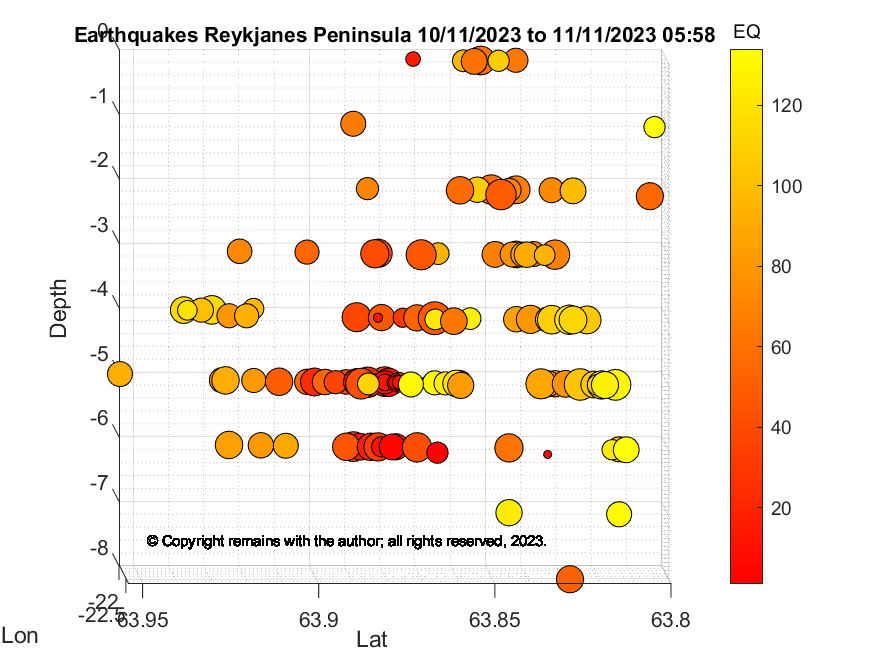
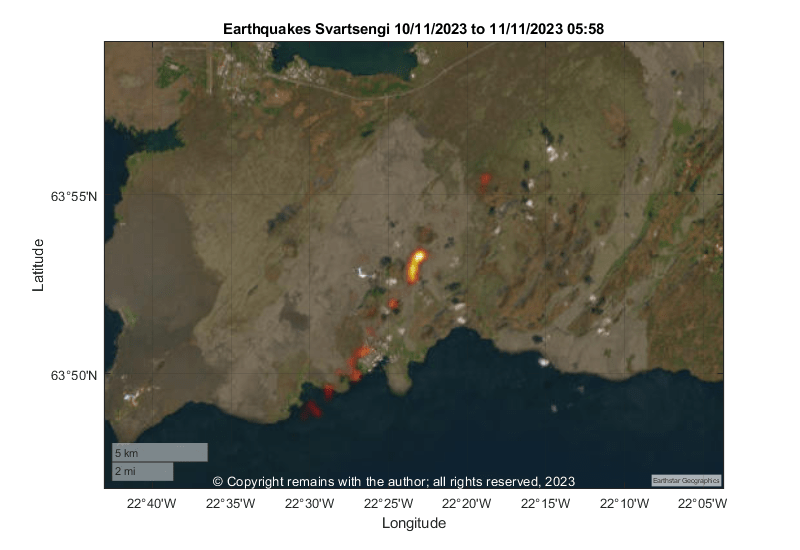
Update 11th November 2023 , 05:58
Since our original post below, events have moved on. The town of Grindavík was evacuated overnight when it became apparent that a dike could be forming under the town. The Svartsengi Power Plant will be operated remotely.
The swarm has continued relentlessly since yesterday.
We have plotted the activity from 10th November 2023 to 11th November 2023 05:58 using the confirmed earthquakes reported on Skjálfta-Lísa (vedur.is), a total of 134 earthquakes. Our plots show the possible dike formation.
It is not possible to predict when and where an eruption may occur. For updates, please consult the Icelandic Authorities, for example, IMO.
Armchair Volcanologist
© Copyright remains with the author; all rights reserved, 2023.
Source for raw earthquake data as before: Icelandic Meteorological office (vedur.is)
Original Post 10/11/2023
Good evening,
A large earthquake swarm started north of Grindavík, Iceland, on 24th October 2023 in the vicinity of the Svartsengi Geothermal Plant and Mount Þorbjörn. This is the fifth time such a swarm has occurred during the volcano-tectonic episode which started on the Reykjanes Peninsula in December 2019, including the three eruptions of Fagradalsfjall. Earlier today (10th November 2023), the swarm intensified. The aviation code for the Reykjanes – Svartsengi system has been raised to orange.
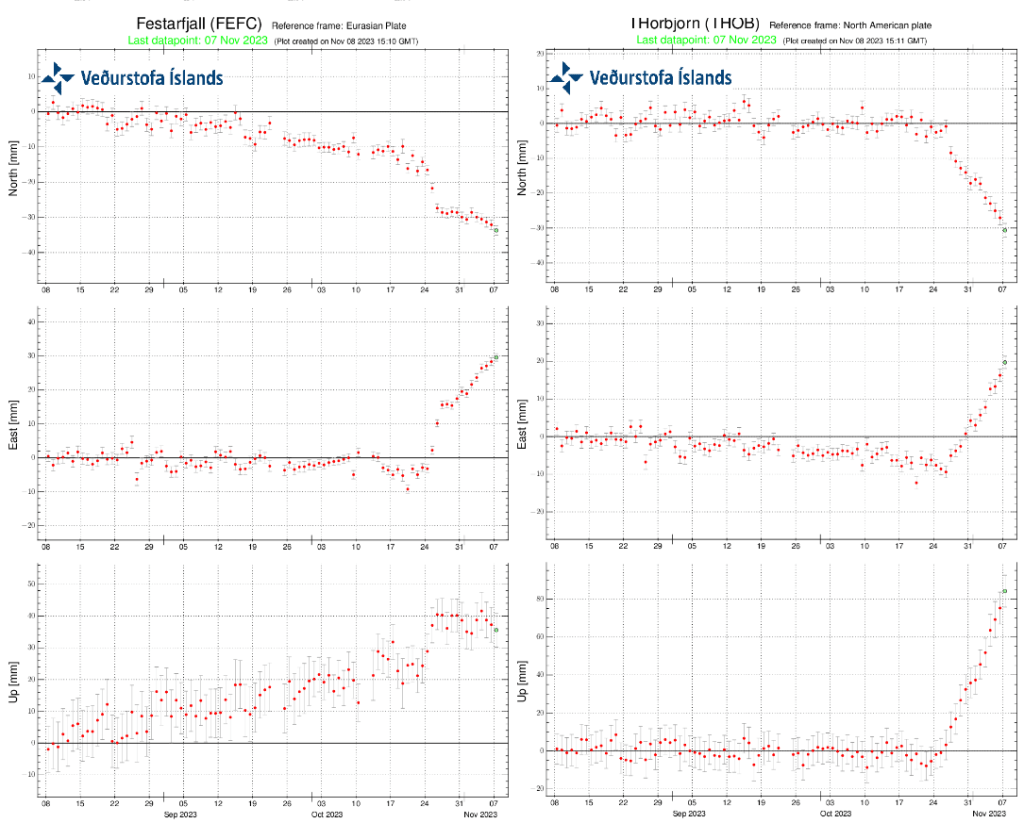
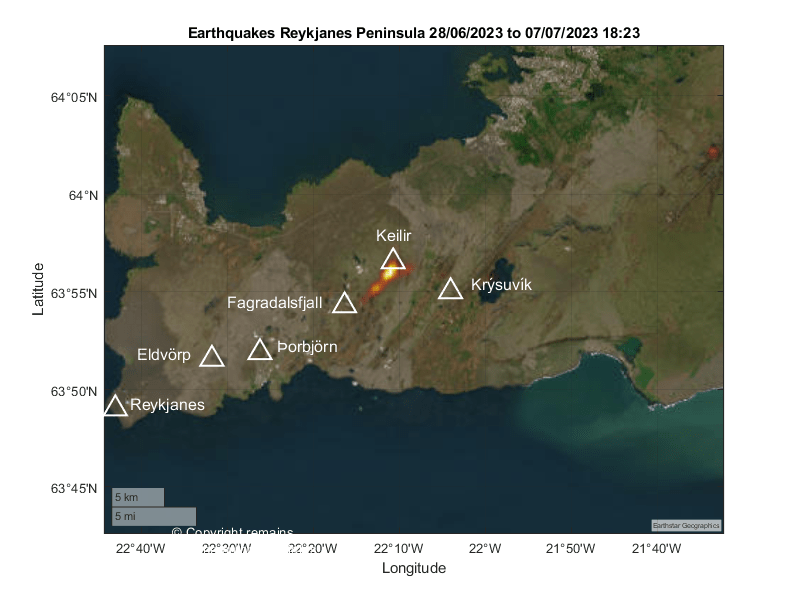
Because this activity started near Fagradalsfjall, it was initially thought that the swarm was caused by magma movement associated with Fagradalsfjall and the earthquakes to the west were triggered earthquakes (faults moving to accommodate the magma). This was born out by initial ground deformation showing at station FEFC, southwest of Fagradalsfjall. However, this has been followed by consistent uplift at the stations near Mt Þorbjörn, raising concerns that there is magmatic activity there. It is believed that magma is accumulating in a sill at a depth of 5km. Since then, there have been seven earthquakes with a magnitude greater than 4.0M in the area (as of 9th November 2023).
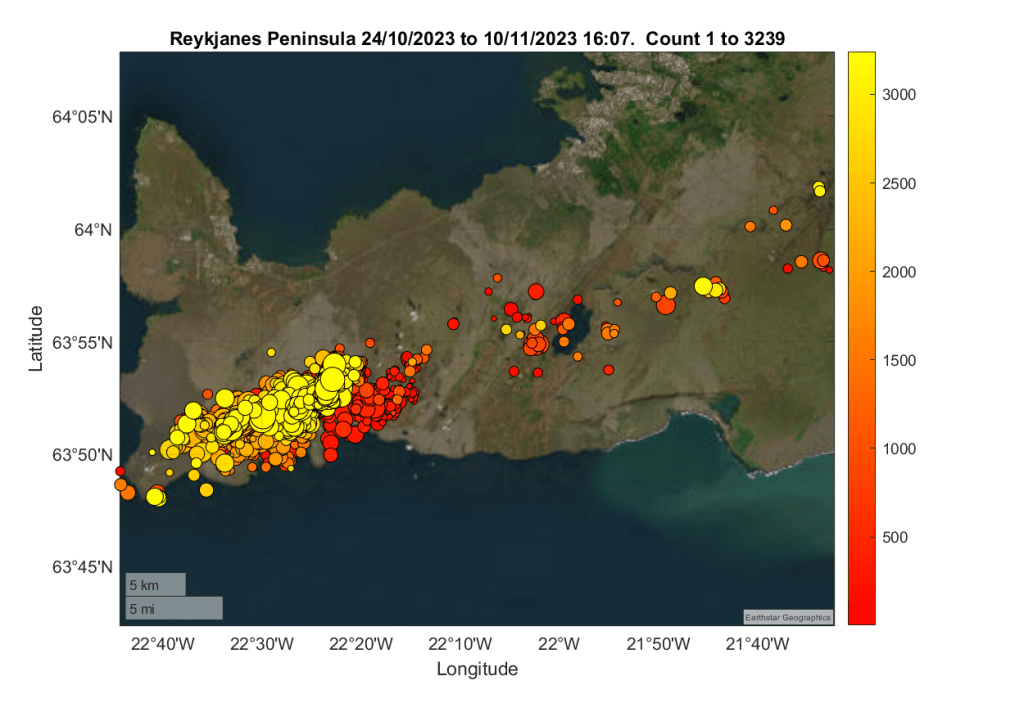
We have plotted the earthquakes reported on Skjálfta-Lísa (vedur.is) for the Reykjanes Peninsula for the period 24th October 2023 to 10th November 2023 (16:07) to see what is going on. 3,239 earthquakes have been recorded, although many more have occurred.
The geoscatter plot shows the initial seismic activity southwest of Fagradalsfjall, followed by its migration westward.
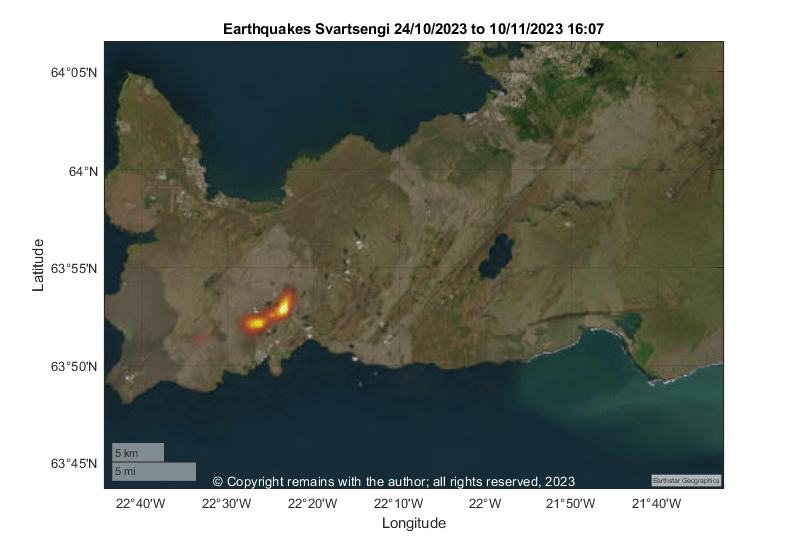
The earthquake density plot shows most activity in the vicinity of Mt Þorbjörn
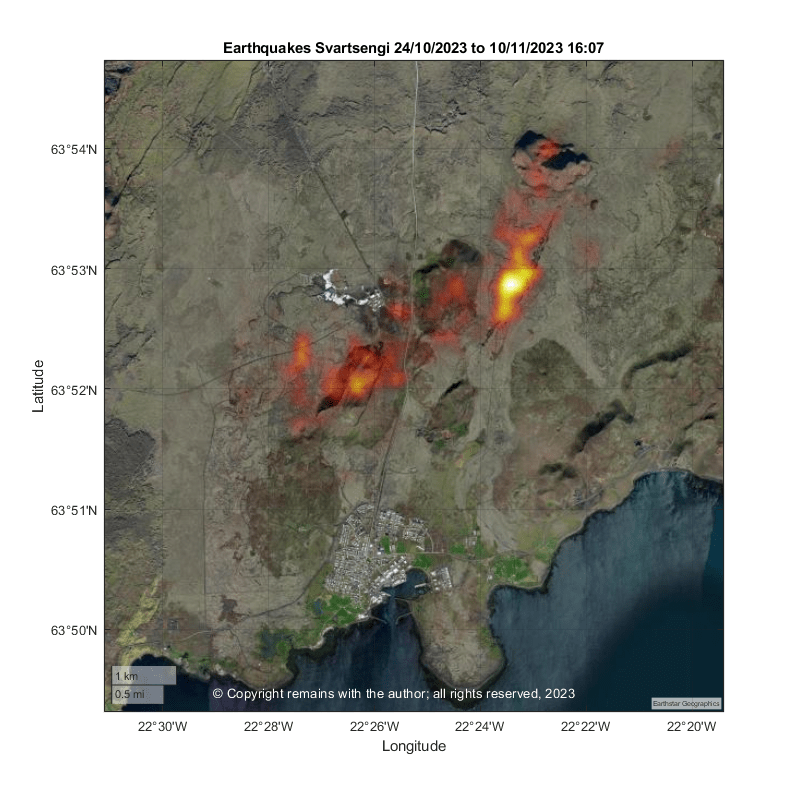
Time will tell whether an eruption ensues. But as a precautionary measure the Blue Lagoon is now closed to visitors and the residents of Grindavík have been advised of evacuation plans.
Our plot do not include the larger recent earthquakes, including the 5M. When we get more data, we will update our plots.
Armchair Volcanologist
© Copyright remains with the author; all rights reserved, 2023.
Source: Raw earthquake data: Icelandic Meteorological office (vedur.is)


#/media/File:Keilir_distance.jpg)