Good Afternoon!
This is the third in our series on volcanic risk mitigation. Here, we cover the planning that needs to be done to mitigate the risk before our volcano really ramps up to an eruption or to deal with other volcanic related incidents.
Let’s take a moment to reflect on what we are trying to prevent. In the first instance, this is loss of life, followed by loss of or significant damage to property, infrastructure, farming and other production in the zones at risk. The table below shows estimated fatalities with their cause from recent eruptions. The largest cause of death is famine and disease, followed by tsunamis, pyroclastic density currents (PDCs) and lahars. Even relatively moderate eruptions may result in a lot of fatalities.
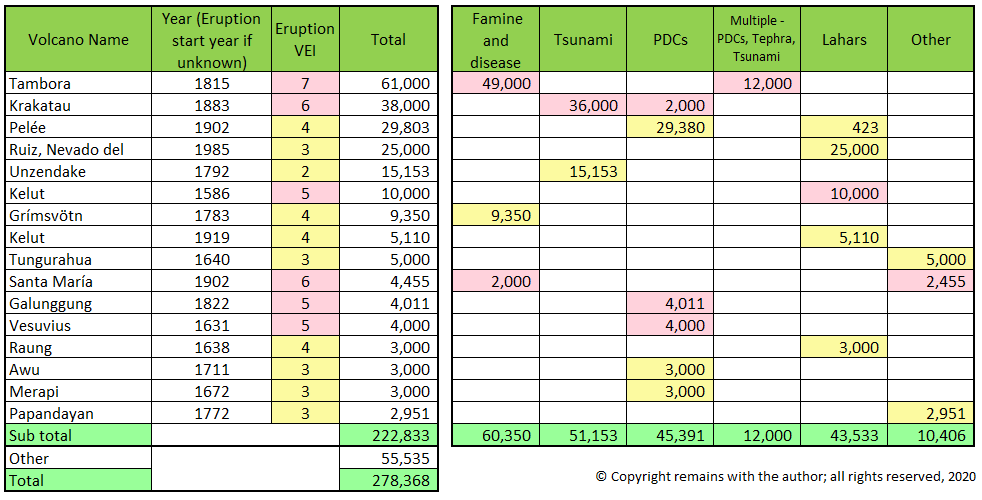
The Volcanic Fatalities Database (see Sources below) lists many more causes, including some arising from being too close to the hazard and some others from evacuation. All of which need to be borne in mind in our disaster planning.
What Should Be in Our Disaster Management Plan?
We saw in our previous article that a lot of people are involved in risk mitigation. They all need to be on the same page when action needs to be taken. This requires planning, preparation and coordination. Like all plans, our volcanic incident management plan must cover the three “W”s – What, Who & When.
What
We cannot stop our volcano from erupting but there are few things we can do to reduce the risk, for example:
- Crater lakes can be drained to remove the source of lahars (e.g. Pinatubo and Kelud).
- Rivers can be widened and their banks raised (levées) to contain some lahars.
- Small lava flows can be diverted.
- Lakes can be agitated to release carbon dioxide and reduce the accumulation (Lake Nyos).
- Some crops may be protected by sheeting.
- Local planning regulations can be adapted to include reinforcement of buildings for volcanic ash and to prevent building and other activities in areas of high risk.
- Organisations may opt to site critical facilities, such as datacentres, in less hazardous environments.
- Some insurers may offer insurance to cover volcanic incidents; if they do, we may well have to have robust business continuity planning.
There are other hazards (e.g. pyroclastic density currents, volcanic bombs, volcanic gases, tsunamis, landslip, large lava flows) that we cannot do much about except impose exclusion zones and evacuate those in the areas at risk, when it appears likely that an eruption or other event will occur (we’ll look at “when” later). Evacuation planning includes finding suitable accommodation, food and water, and medical supplies for evacuees.
Who: Roles & Responsibilities
The “who” is based on skills and areas of responsibility.
Civil defence authorities are responsible for coordinating the response to a volcanic incident, developing and testing emergency plans and procedures, communicating with the public and media.
The volcanologists monitor volcanic activity, participate in development of volcano coordination plans, and deliver eruption updates to the civil defence authorities.
The public (businesses, non-government organisations and individuals) need to be aware of the hazards and alerts, have their own disaster recovery and business continuity management plans, and, be prepared to evacuate, if needed.
Who: Communication Protocols
Communication protocols are necessary to avoid confused messaging to the public, and should be consistent with designated roles and responsibilities. Countries have their own established protocols; in essence, these are:
- Civil defence authorities advise local government / authorities, communicate with the public and the media, and issue alerts.
- Volcanologists and other specialists advise the civil defence authorities. Where specialists disagree, the disagreement must be formally and openly communicated with reasons to the civil defence authorities, along with the consensus of opinion.
- Volcanologists do not advise or communicate with the public, unless part of an agreed education / information program.
- Volcanic Ash Alert Centres issue volcanic ash advisories for aviation.
- Governments request / accept and distribute international aid with the help of aid agencies, should it be necessary.
The protocols should include designated personnel to contact, their contact details, with deputies should the initial contact not be available.
When
Judging when to take action is fraught with difficulties: evacuate too soon, people will wander back into exclusion zones to look after crops, livestock or other assets left behind; do it too late, there could be serious loss of life; or, evacuate with no ensuing eruption, the political, social and economic fall-out from what may be seen to be unnecessary disruption won’t be pretty. Timing is therefore critical.
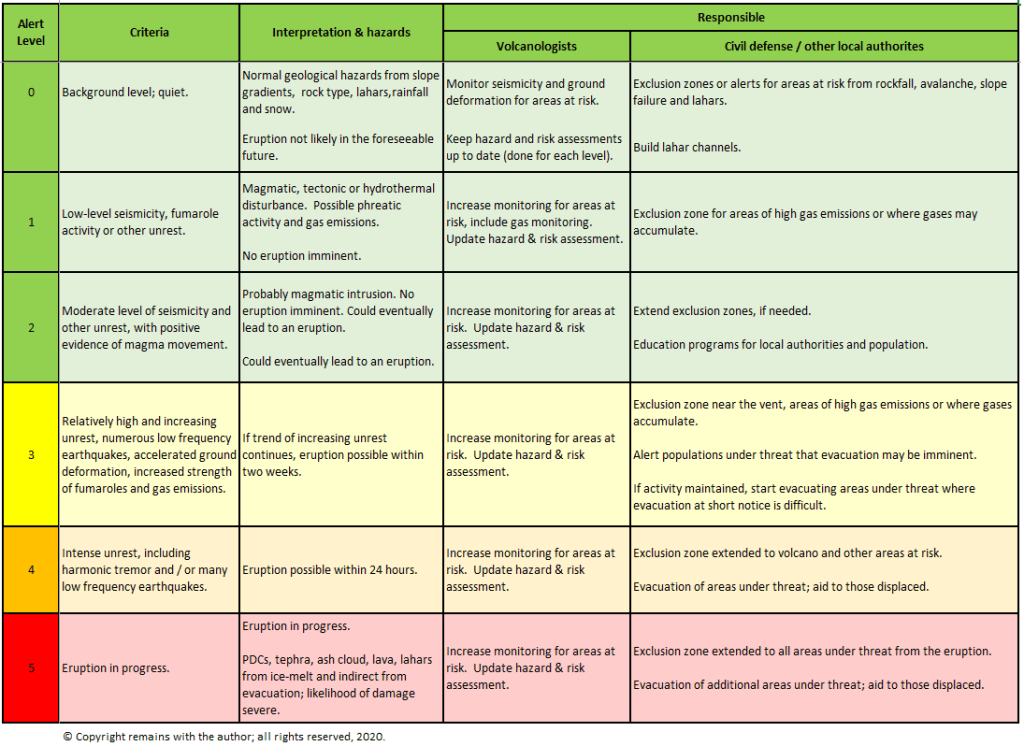
Fortunately, our volcano is unlikely to go from inactive to a full-blown eruption overnight. Various authorities have successfully used volcano activity levels to provide a system of alerts to indicate when mitigating activity should be occurring. The alert levels may be raised or lowered based on the level of unrest shown by our volcano. Countries have their own systems of alerts; we have based the alerts in our sample example of a summary plan below on those used for the eruption of Pinatubo in 1991.
The Plan
Putting all this together our plan, in summary, may look something like our theoretical sample below. This covers both ramping up to and ramping down from an eruption, and the alert levels may be changed in accordance with the level of unrest shown by our volcano. This is a theoretical sample only; your disaster management plans must be tailored to the risks posed by your volcanoes.
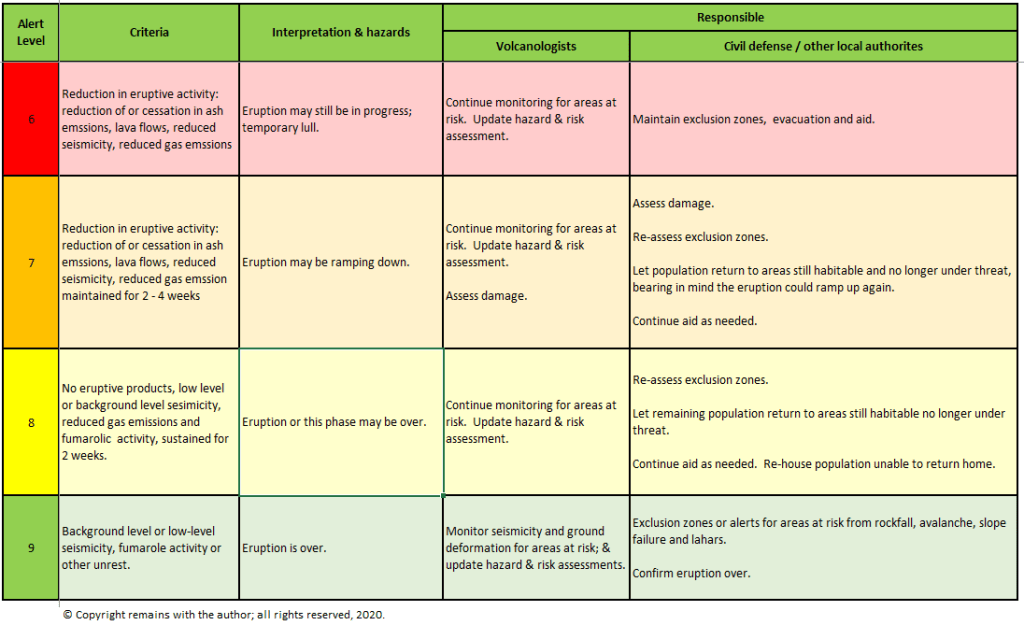
Note: that for each action, there will be several underlying actions. For example, building a lahar channel will require landowners’ permissions, architects, surveyors, engineers, procurement of building materials, builders, project management, etc..
Testing
OK, so now we have our plans: our alert levels, our exclusion zones, our detailed evacuation plans, our communication protocols, etc. But will they work? Testing is needed to make sure that evacuation plans work: e.g. that people can get from the area under threat to a designated evacuation centre in the relatively short space of time available, that the evacuation centre can take them, that food, water and other supplies will be available at the evacuation centre when needed.
We don’t need to get everyone in the area to participate in all the testing, desk-top “what if” scenario testing with representatives from local authorities, volcanologists and others involved in the actions can pick up obvious problems, e.g. a single road out for a population of 100,000 +. Nor do we need to wait for an eruption to solve the problem, e.g. if feasible, another road could be built to provide another exit, or we may plan to evacuate earlier.
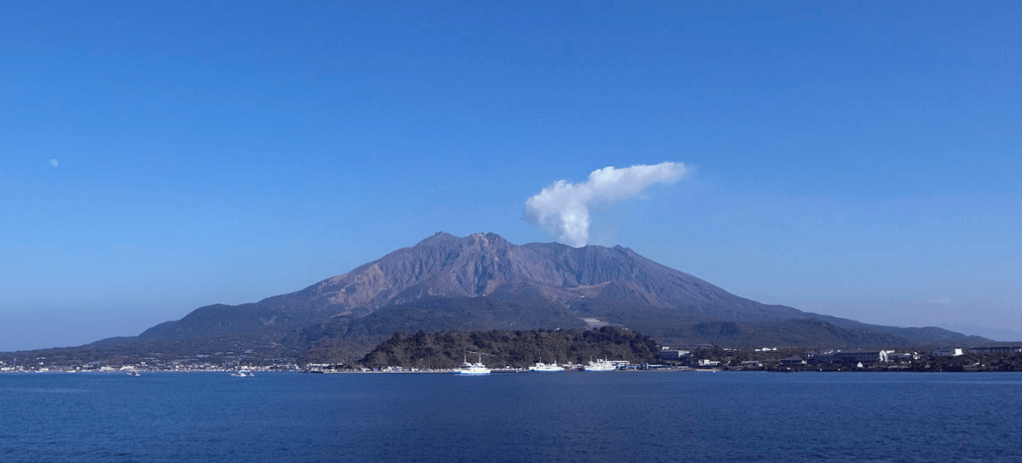
Involving the public on a voluntary basis in testing may be a good way to get the public on board and get their cooperation, if we have the resources to manage this, not least because it provides education and information. At Sakurajima, a very active volcano in Japan, the local authorities hold an evacuation drill for the island on 12 January every year, the anniversary of a tragic eruption in 1914; this maintains awareness and means that people know what to do, should they need to evacuate for real.
Education & Information
We may have the greatest plans going but if we do not get the public on board, our plans will be less than effective. We need to have an education programme that advises the public what they need to know in time for them to take action, if required, while minimising panic. If our volcano has erupted violently in living memory, it will be easier to inform the public than if our volcano has been quiet for some time or considered dormant or extinct.
While our volcano is quiet, the public needs to know that our volcano is a volcano, the hazards and its eruptive history. They also need to know that the volcano is being monitored and that there is system of alerts in place that they may need to respond to. Organisations need to include volcanic hazards in their business continuity management plans.
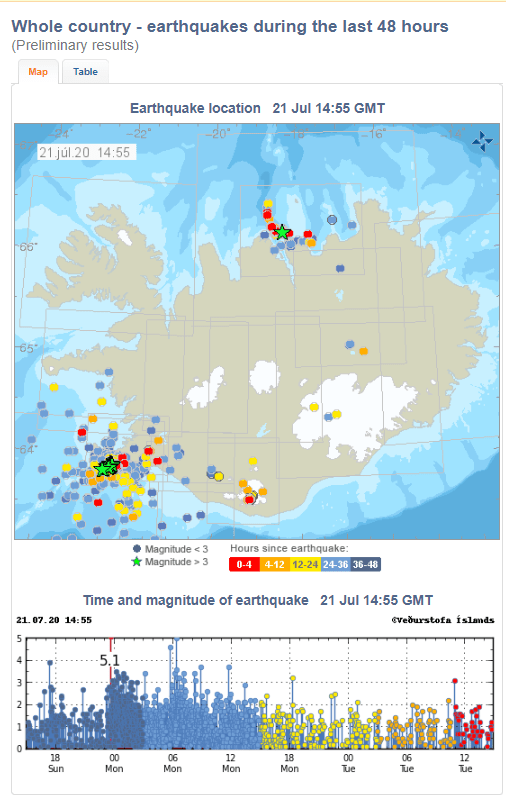
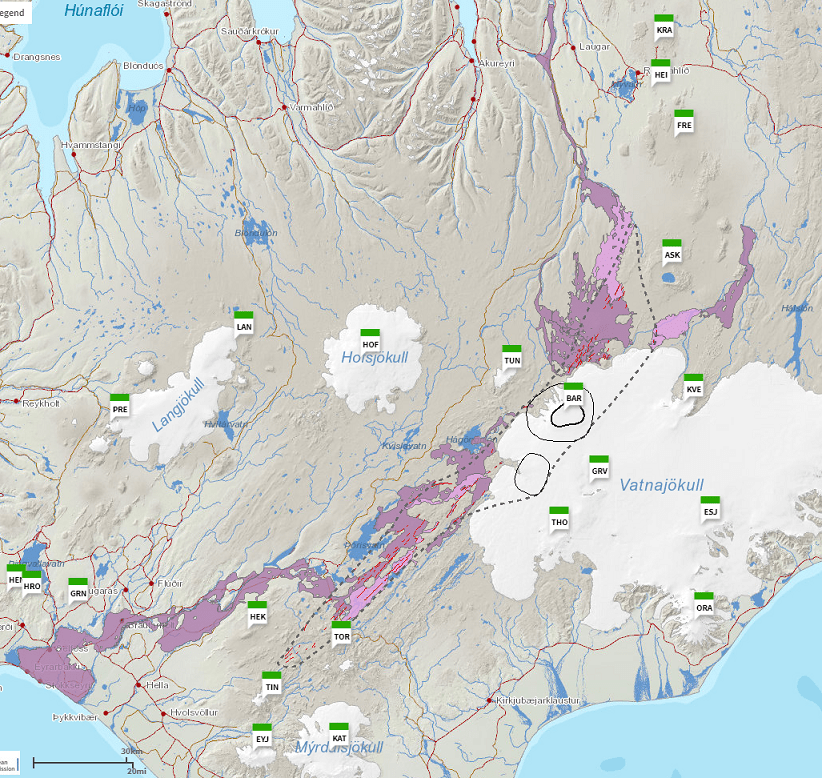
When activity at our volcano ramps up, the public need to be made aware of the level of activity, its interpretation and any preparation they need to do, e.g. know the evacuation routes, have a bag packed with essentials in case they need to leave at short notice. Organisations need to know when to invoke business continuity / disaster recovery plans. Workshops, lectures and media campaigns can help to get the message across. A good example of an alert is that recently issued by the Icelandic authorities in relation of increased unrest at Grímsvötn (link: https://en.vedur.is/ & https://en.vedur.is/about-imo/news/the-aviation-color-code-for-grimsvotn-changed-from-green-to-yellow ).
When the eruption quietens down, the public need to know whether and when it is safe to return to their properties; any aid available to cover damage to property, livestock and crops; how they will be rehoused, if they are unable to return to their property; and, ultimately confirmation when the eruption is over.
Factors to Consider
Our plans have to be flexible because our volcano may have a range of eruptions sizes, for example, with an average of VEI 3, but extending to VEI 6, or our volcano may change its behaviour.
When activity starts to ramp up, volcanologists will monitor the volcano for any clues as to what our volcano will do next.
Successes
Significant loss of life has been prevented in large eruptions (Pinatubo, 1991, VEI 6) by following a disaster management process along the lines set out above. However, despite the successful evacuation of 200,000 people, 359 died from the eruption, itself, and 1,200 indirectly from disease and lahars.
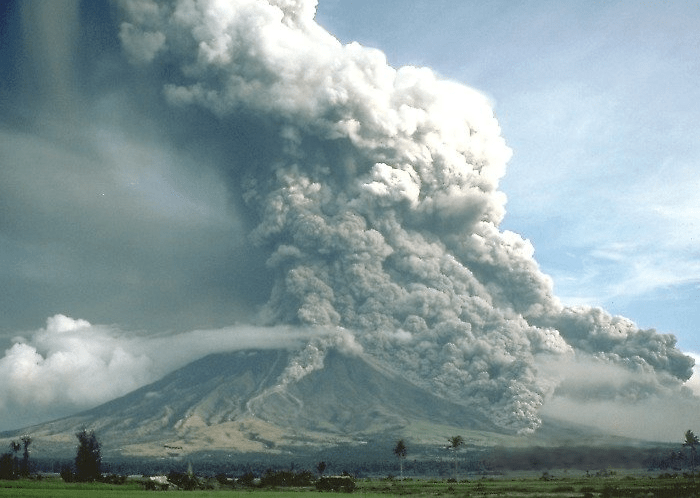
Since 1991, the biggest cause of volcanic fatalities has been secondary lahars: San Cristóbal, 2,547 deaths in 1999; and, Mayon, 1,266 in 2006, although there has not been a VEI 6 or more since Pinatubo’s 1991 eruption. There have been several other fatal incidents in recent years, such as the recent eruptions of White Island, New Zealand, and Ontake-san, Japan, where visitors were caught in phreatic eruptions.
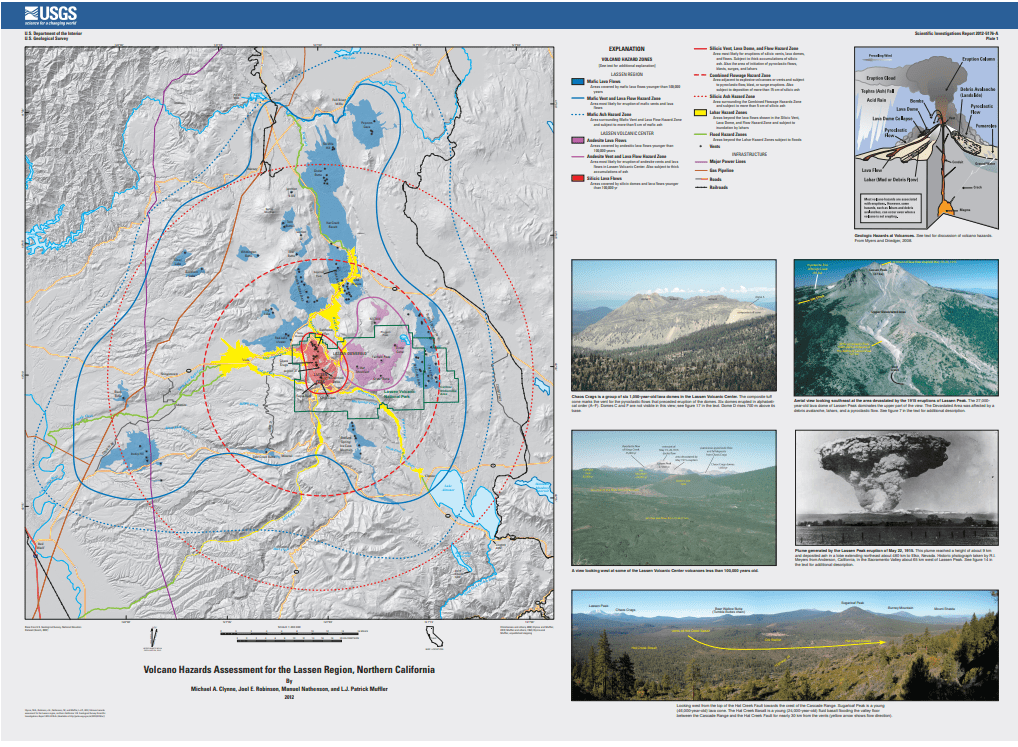
The above touches the surface of disaster management planning. Should your volcano start to ramp up, consult with the experts, such as USGS or others who have volcanoes in a similar setting to yours.
We will look at the 1991 eruption of Pinatubo and others in more detail in later articles.
The Armchair Volcanologist
© Copyright remains with the author; all rights reserved, 2020.
Sources and Further Reading
Volcanic Fatalities Database Version 1.0a: http://globalvolcanomodel.org/volcanic-fatalities/
“Volcanic fatalities database: analysis of volcanic threat with distance and victim classification”, Sarah K. Brown, Susanna F. Jenkins, R. Stephen J. Sparks , Henry Odbert and Melanie R. Auker, Journal of Applied Volcanology (2017) 6:15, Brown et al. (2017)
USGS Volcano Hazards Program: https://www.usgs.gov/natural-hazards/volcano-hazards/be-ready-next-volcanic-event
“Volcanoes, Earthquakes and Tsunamis”, David Rothery, Teach Yourself, 2010
“Eruptions That Shook the World”, Clive Oppenheimer, Cambridge University Press, 2011
“Volcanoes”, Peter Francis, Clive Oppenheimer, Oxford University Press, Second Edition, 2004
“Volcanoes. Crucibles of Change”, Richard V. Fisher, Grant Heiken, Jeffrey B. Hulen, Princeton University Press, 1997.


